
ABSTRACT
Background: The prevalence of electrocardiographic (ECG) patterns of left ventricular (LV) hypertrophy and strain in calcific aortic valve disease has not been extensively evaluated. We sought to evaluate the prevalence of ECG-defined LV hypertrophy and strain in a large cohort of patients with various grades of calcific aortic valve disease and to correlate these ECG patterns with survival.
Methods: A total of 1,437 patients (mean age 66 ± 14 years, 62.6% men) with calcific aortic valve disease were evaluated. Demographic, clinical variables and presence of ECG patterns of LV hypertrophy and strain were collected and related to occurrence of all-cause mortality, correcting for aortic valve replacement during follow-up.
Results: Aortic sclerosis was diagnosed in 29% of patients, mild aortic stenosis (AS) in 13%, moderate AS in 30% and severe AS in 28%. Seventy-six patients showed ECG pattern of LV hypertrophy without strain whereas 227 showed ECG pattern of LV hypertrophy with strain. Patients with LV hypertrophy with strain pattern showed more frequently severe AS. During a mean follow-up of 7.2 ± 4.8 years (10,258 patient-years), 545 (37.9%) patients died. Compared to ECG without hypertrophy pattern, ECG strain pattern was independently associated with all-cause mortality (HR 1.36, 95% CI 1.08–1.72; p = 0.009), whereas LV hypertrophy pattern on ECG was not (HR 1.38, 95% CI 0.94–2.24; p = 0.094).
Conclusions: The ECG strain pattern reflects an advanced stage of the LV remodeling process in the natural history of calcific aortic valve disease and is independently associated with worse outcome.
Introduction
The left ventricular (LV) remodeling process that accompanies aortic stenosis (AS) is characterized by myocyte hypertrophy, with increase of the muscle fiber diameter and the addition in parallel of new myocytes in response to the increased wall stress and pressure overload. In addition, the interstitial space increases with deposition of collagen (interstitial fibrosis) and, at a later stage, loss of myocytes and replacement by fibroblasts (replacement fibrosis).Citation1 Interstitial and replacement fibrosis may lead to conduction and repolarization abnormalities that can be identified on surface electrocardiogram (ECG). An ECG pattern of LV hypertrophy and strain, defined by a downsloping convex ST segment with an inverted asymmetrical T-wave opposite to the QRS axis in leads V5 and/or V6,Citation2 has been shown to correlate with myocardial fibrosisCitation3 and is associated with increased cardiovascular morbidity and mortality in AS.Citation3–Citation7 Although its prognostic value has been well established, there is currently limited data on the prevalence of the ECG strain pattern in increasing AS severity and its relationship with LV remodeling and prognosis. The present study aimed at investigating the prevalence and prognostic value of ECG strain pattern in a large registry of patients with various grades of calcific aortic valve disease and its echocardiographic correlates.
Materials and methods
Patients
From the departmental echocardiographic database of the Leiden University Medical Center (Leiden, The Netherlands), patients with native calcific aortic valve disease were identified. Patients with prosthetic aortic valves, subvalvular or supravalvular AS, dynamic subaortic obstruction, moderate or severe coexisting aortic or mitral regurgitation, any grade of mitral stenosis and active endocarditis and pacemaker rhythm were excluded.
Clinical history, physical examination, transthoracic echocardiography and resting 12-lead ECG were evaluated at the time of first diagnosis of AS. Particularly, the presence of ECG signs of LV hypertrophy with and without strain pattern was recorded. Baseline clinical variables included cardiovascular risk factors, total cholesterol levels, hemoglobin level and glomerular filtration rate calculated by the Modification of Diet in Renal Disease formula.Citation8 The occurrence of transcatheter or surgical aortic valve replacement and all-cause mortality after the index ECG were recorded.
Data were collected at the departmental Cardiology Information System (EPD-Vision®; Leiden University Medical Centre, Leiden, the Netherlands) and subsequently analyzed retrospectively. The institutional review board of the Leiden University Medical Centre approved this retrospective analysis of clinically acquired data and waived the need for patient written informed consent.
Electrocardiography
Resting 12-lead ECG performed within a 12-month timeframe prior to or after the date of the echocardiography diagnosing aortic calcific valve disease were analyzed. ECG was calibrated at 0.1 mV/mm with a paper speed of 25 mm/s. Sinus rhythm and atrial fibrillation were defined according to current guidelines.Citation9 In the lead with the greatest QRS width, QRS duration was measured in milliseconds (ms). According to current recommendations, LV hypertrophy pattern was defined as Sokolow-Lyon voltage (sum of SV1 and RV5/V6) ≥ 35 mV.Citation2 In patients with LV hypertrophy on ECG, the presence of ECG strain pattern was evaluated. ECG strain pattern was defined as any downsloping convex ST segment with an inverted asymmetrical T-wave opposite to the QRS axis in leads V5 and/or V6 ().Citation2 The patient population was divided according to the presence of ECG-defined LV hypertrophy and strain pattern: patients without LV hypertrophy, patients with LV hypertrophy but without strain pattern and patients with LV hypertrophy with strain pattern.
Echocardiography
Commercially available ultrasound systems (Vivid 7 and E9 systems; GE-Vingmed, Horten, Norway) were used to perform transthoracic echocardiography in all patients at rest. Data were stored digitally and analyzed offline (EchoPAC version 113.0.3; GE-Vingmed, Horten, Norway). Two-dimensional (2D), colour, pulsed, and continuous-wave Doppler data were acquired from parasternal, apical, subcostal and suprasternal views according to current recommendations.Citation10 LV end-diastolic and end-systolic volumes were calculated using the Simpson’s biplane method of discs and the LV ejection fraction (EF) was calculated and expressed as a percentage.Citation11 The LV mass was calculated from the 2D LV linear measurements obtained on the parasternal LV long-axis view using the formula as recommended.Citation11 From the apical LV long-axis or 5-chamber views, continuous wave Doppler spectral recordings of the aortic jet were obtained and the mean pressure gradient was estimated with the modified Bernoulli equation. On a zoomed parasternal long-axis view, 5 mm below the aortic annulus, the LV outflow tract diameter was measured and the cross-sectional area was derived. The velocity time integral was measured on spectral pulsed wave Doppler recordings on the aforementioned location of the LV outflow tract obtained from the apical LV long-axis or 5-chamber views. The continuity equation was used to calculate the aortic valve area. LV end-diastolic and end-systolic volumes and LV mass were indexed to body surface area.
Follow-up
Patients were followed-up for the occurrence of all-cause mortality. Survival data, collected from the departmental cardiology information system or the Social Security Death Index, were complete for all subjects. In addition, the occurrence and timing of aortic valve replacement was noted.
Statistical analysis
After testing for Gaussian distribution, all continuous variables were presented as mean ± standard deviation. Non-Gaussian distributed continuous variables were presented as median and interquartile range. Comparisons of continuous variables across patient groups were performed using the one-way ANOVA-test, with post-hoc Bonferroni analysis when appropriate. All categorical variables were presented as percentages and frequencies and compared with the χ2 test. To test intra-observer variability in the interpretation of the different ECG patterns, 45 studies (15 of each category) were randomly selected and a repeated analysis was performed by observer A (EAP) at two different time points. Observer B (EMV) interpreted the ECGs at one time point and these were compared with the interpretation of observer A to test the inter-observer variability. Intra- and inter-observer agreements were calculated using intraclass correlation coefficients (ICCs), with excellent agreement defined as ICC >0.75 and strong agreement defined as ICC = 0.60 to 0.74.
The cumulative event rates for the clinical endpoint of all-cause mortality were estimated with the Kaplan–Meier curves and the log-rank test was used to compare the groups. To investigate the independent association between ECG-defined LV hypertrophy and strain pattern with all-cause mortality, multivariate Cox proportional hazards regression analysis was performed. Clinical and echocardiographic parameters known to influence mortality in patients with AS were chosen on a-priori manner, based on analyses of previous studies.Citation3,Citation12,Citation13 A tolerance level of >0.5 was set to avoid multicollinearity between the univariate determinants. Subsequent surgical or transcatheter aortic valve replacement was included in the model as a time-dependent covariate. Hazard ratios (HR) and 95% confidence intervals (CI) were calculated. The incremental value of ECG pattern over clinical and echocardiographic parameters was assessed with the change in χ2 and the calculation of the net reclassification index and the integrated discrimination improvement (Supplemental material). A two-tailed p-value of <0.05 was considered significant. All statistical analyses were performed using SPSS for Windows version 23 (SPSS Inc; IBM Corp., Armonk, NY, USA).
Results
Baseline characteristics
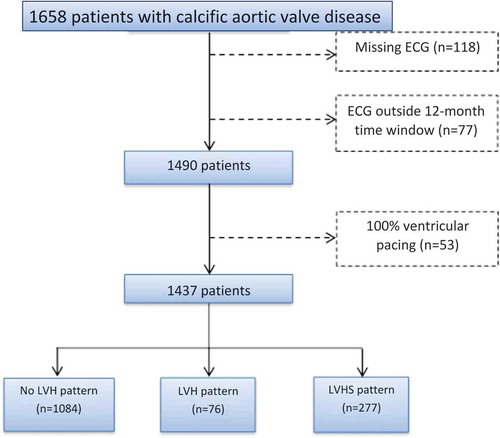
presents the flowchart to select the final patient population. A total of 1,437 patients with calcific aortic valve disease, divided according to the presence of LV hypertrophy and strain pattern on surface ECG, were included. The mean age at first calcific aortic valve disease diagnosis was 66 ± 14 years, and 62.6% were men. The distribution of patients according to the calcific aortic valve disease severity was as follows: 425 (29%) had aortic sclerosis, 182 (13%) mild AS, 432 (30%) moderate AS and 398 (28%) severe AS. The majority of patients did not present LV hypertrophy on the ECG (n = 1,084, 75.4%) whereas 76 (5.3%) presented LV hypertrophy without strain pattern and 277 (19.3%) showed LV hypertrophy with strain pattern. Intra- and inter-observer variability of the different ECG patterns showed excellent agreement (intra-observer kappa = 0.933; inter-observer kappa = 0.867).
Figure 1. Graphical representation of LV hypertrophy and strain patterns on ECG. LV hypertrophy pattern was defined according to the Sokolow-Lyon voltage criteria, with the sum of the S wave depth in V1 (orange arrow) and tallest R wave height in V5 or V6 (red arrow) being higher than 35 mm. LV hypertrophy with strain pattern was defined as ST depression (green arrow) and asymmetrical T wave inversion (purple arrow) in the lateral leads (V5 and V6). ECG, electrocardiogram; LVH, left ventricular hypertrophy; LVHS, left ventricular hypertrophy with strain.
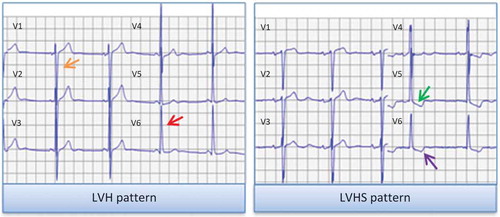
Figure 2. Flowchart of inclusion of calcific aortic valve disease patients, according to the presence of LV hypertrophy and strain pattern on ECG. ECG, electrocardiogram; LVH, left ventricular hypertrophy; LVHS, left ventricular hypertrophy with strain.
Patient characteristics according to LV hypertrophy and strain pattern on ECG
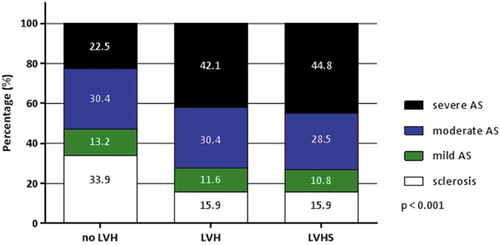
shows the differences in patient characteristics according to the presence of the different patterns on surface ECG (no LV hypertrophy, LV hypertrophy without strain, LV hypertrophy with strain). Patients with LV hypertrophy and strain pattern were significantly older and used statins, diuretics, and antiplatelet therapy more frequently as compared with the other two groups of patients. In addition, these patients had significantly larger LV volumes and LV mass index and lower LVEF as compared with the other two groups. Compared to patients without LV hypertrophy, patients with LV hypertrophy (with and without strain pattern) showed significantly greater transvalvular aortic peak velocities and gradients and smaller aortic valve area. As shown in , severe AS was more frequently observed among patients with LV hypertrophy and strain patterns on the ECG.
Table 1. Population characteristics according to presence of LV hypertrophy with and without strain pattern.
Figure 3. Distribution of various AS categories according to the different ECG patterns of left ventricular hypertrophy and strain. AS, aortic stenosis; ECG, electrocardiogram; LVH, left ventricular hypertrophy; LVHS, left ventricular hypertrophy with ECG strain.
Prognostic impact of LV hypertrophy and strain pattern on ECG
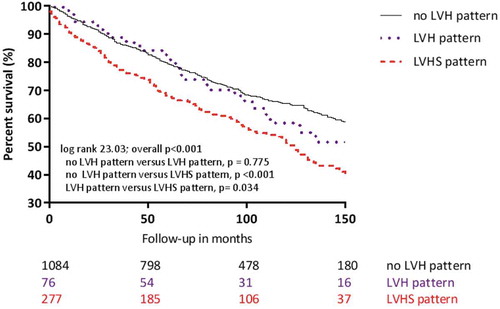
During a mean follow-up of 7.2 ± 4.8 years (10,258 patient-years), 708 (49.3%) patients underwent aortic valve replacement and 545 (37.9%) died. shows that the cumulative event-free survival was significantly different across the three groups (log rank 23.03; p < 0.001). Patients with LV hypertrophy with strain pattern on ECG had significantly worse survival compared with the other two groups (no LVH vs. LVHS pattern, p < 0.001; LVH vs. LVHS pattern, p = 0.034), whereas there was no difference in survival between no LVH and LVH pattern (p = 0.775).
Figure 4. Kaplan–Meier survival curve in AS patients divided according to presence of LV hypertrophy and strain pattern on ECG. AS, aortic stenosis; ECG, electrocardiogram; LVH, left ventricular hypertrophy; LVHS, left ventricular hypertrophy with strain.
As shown in , significant univariate associates of all-cause mortality were age, aortic valve area, LVEF, LV mass index and subsequent aortic valve replacement and were included in a multivariate Cox proportional hazards model. Subsequent aortic valve replacement was included as a time-dependent co-variate. LV hypertrophy pattern on ECG was not significantly associated with all-cause mortality (HR 1.38, 95% CI 0.94–2.24; p = 0.094) whereas the combination of LV hypertrophy with strain pattern on ECG was independently associated with the outcome (HR 1.36, 95% CI 1.08–1.72; p = 0.009).
Table 2. Univariate and multivariate models of clinical, echocardiographic and electrocardiographic parameters.
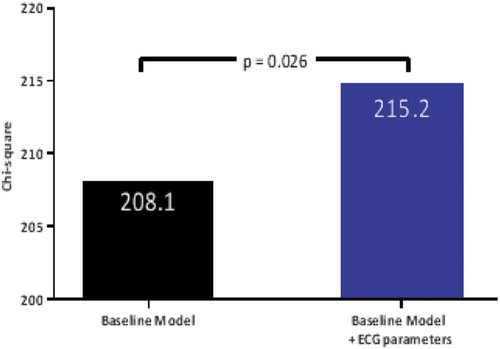
shows that the addition of LV hypertrophy with and without strain pattern on ECG to the baseline model resulted in a significant increment of the χ2 of the model suggesting that these ECG patterns have incremental prognostic value (baseline model χ2 = 208.1; baseline + ECG-parameters model χ2 = 215.2, p = 0.025). An ECG pattern of LV hypertrophy and strain had slight incremental prognostic value over clinical and echocardiographic variables when applying net reclassification index (0.107) and integrated discrimination improvement index (0.005) (see Supplemental material).
Figure 5. Incremental prognostic value of ECG pattern of LV hypertrophy and strain in patients with aortic stenosis. The bar-graph illustrates the change in global χ2 value by the addition of LV hypertrophy with and without strain pattern on ECG to a baseline model including clinical and echocardiographic variables and the timing and occurrence of aortic valve replacement. ECG, electrocardiogram; LV, left ventricular.
Discussion
The presence of LV hypertrophy with strain pattern on ECG is frequent in an unselected large group of patients with various grades of calcific aortic valve disease. Its prevalence is particularly high in the group of patients with severe AS. Patients exhibiting the ECG strain pattern demonstrated larger LV mass and volumes, and lower LVEF, reflecting a more advanced stage of LV remodeling in response to the pressure overload caused by the AS. ECG strain pattern, and not ECG hypertrophy pattern, was independently associated with all-cause mortality in this large cohort of patients with calcific aortic valve disease.
Prevalence of LV hypertrophy and strain pattern on ECG in patients with calcific aortic valve disease
Development of LV hypertrophy and strain pattern on ECG has been linked to an adverse hypertrophic response in ASCitation14 and other models of increased pressure afterload such as hypertension.Citation15,Citation16 The increase in myocyte volume and wall stress, and their impact on reduced coronary flow reserve have been linked to the development of the characteristic repolarization abnormalities.Citation17,Citation18 The increasing prevalence of the ECG strain pattern in worsening AS severity has been demonstrated previously by Greve and colleagues in the electrocardiographic sub-study of the Simvastatin and Ezetimibe in Aortic Stenosis (SEAS) trial.Citation14 Among 1,471 patients with AS (6% of them with severe AS), the prevalence of ECG strain pattern was 18.5% in patients with mild AS compared with 39.4% in patients with severe AS (p < 0.001).Citation14 Furthermore, Shah and co-workersCitation3 have reported a prevalence of ECG strain pattern of 14% in 140 patients with asymptomatic AS included in the Scottish Aortic Stenosis and Lipid Lowering Trial, Impact on Regression (SALTIRE) study.Citation19 However, the prevalence of ECG strain pattern in the patients with severe AS (23% of the overall population) was not reported. In the present study, the prevalence of ECG strain pattern was 19.3% among the overall population of AS patients. In the subgroup of patients with severe AS, this prevalence increased up to 31%. The study by Shah and co-workers evaluating the anatomical and functional correlations of ECG strain pattern in patients with moderate to severe AS showed that the presence of myocardial fibrosis with late gadolinium contrast-enhanced cardiac magnetic resonance imaging was almost universal in patients with ECG strain pattern.Citation3 Therefore, ECG strain pattern is an indirect sign of an advanced stage of LV remodeling process that occurs in the natural history of calcific aortic valve disease.
Prognostic influence of LV hypertrophy and strain pattern on ECG in patients with calcific aortic valve disease
The presence of ECG LV hypertrophy and strain pattern in AS patients has been independently associated with cardiovascular death.Citation3,Citation5–Citation7 Analysis from the SALTIRE study with 1,254 patient-years of follow-up, showed the independent prognostic value of the ECG strain pattern for predicting aortic valve replacement or cardiovascular death.Citation3 Similarly, Greve and colleagues have shown the independent association of the ECG strain pattern with increased risk for sudden cardiac death, myocardial infarction, and heart failure.Citation5 Recently, in 390 patients with significant AS referred for isolated surgical aortic valve replacement, Guinot and co-workers showed the independent association between the ECG strain pattern and long-term mortality.Citation20 Our study expands the evidence on the association between ECG strain pattern and worse outcome by including a large population with a broad spectrum of calcific aortic valve disease, with the longest follow-up to date (10,258 patient-years). The mortality rate reported in our cohort (37.9%) probably relates to this long follow-up, as a large number of patients eventually progressed to a more severe grade of AS during follow-up, leading to worse outcome. Independently of established markers of worse prognosis in AS and the occurrence of surgical or transcatheter valve replacement during follow-up, the presence of the ECG strain pattern provided incremental prognostic value. These findings are important in a watchful waiting strategy. For example, the ongoing EVOLVED randomized clinical trial (NCT03094143), comparing the clinical outcomes of patients with asymptomatic severe AS and midwall fibrosis on cardiovascular magnetic resonance managed with aortic valve replacement versus standard of care, includes ECG strain as a marker for LV decompensation.
Study limitations
The present retrospective evaluation has some limitations. The retrospective design of the present study and sole inclusion of patients referred to a tertiary centre may be a potential selection bias. All-cause mortality was chosen as the primary endpoint since specific causes of death were not uniformly available.
Conclusions
In patients with calcific aortic valve disease, the presence of ECG strain pattern reflects a more advanced stage in the LV remodeling process and has a detrimental effect on clinical outcomes. In a watchful waiting strategy of patients with AS, ECG analysis may be an important tool for risk stratification.
Disclosure statements
Our Department of Cardiology receives unrestricted research grants from Biotronik, Medtronic, Boston Scientific, and Edwards Lifesciences. Victoria Delgado has received speaker fees from Abbott Vascular. Melissa Leung received a Pfizer Investigator Initiated Research Grant. The remaining authors have nothing to disclose.
Supplementary Materials
Download TIFF Image (568.1 KB)Supplemental data
Supplemental data for this article can be accessed on the publisher’s website.
Related Research Data
References
- Chin CW, Everett RJ, Kwiecinski J, et al. Myocardial fibrosis and cardiac decompensation in aortic stenosis. JACC Cardiovasc Imaging. 2017;10:1320–1333.
- Hancock EW, Deal BJ, Mirvis DM, et al. AHA/ACCF/HRS recommendations for the standardization and interpretation of the electrocardiogram: part V: electrocardiogram changes associated with cardiac chamber hypertrophy: a scientific statement from the American Heart Association Electrocardiography and Arrhythmias Committee, Council on Clinical Cardiology; the American College of Cardiology Foundation; and the Heart Rhythm Society. Endorsed by the International Society for Computerized Electrocardiology. J Am Coll Cardiol. 2009;53:992–1002.
- Shah AS, Chin CW, Vassiliou V, et al. Left ventricular hypertrophy with strain and aortic stenosis. Circulation. 2014;130:1607–1616. doi:10.1161/CIRCULATIONAHA.114.011085
- Chin CW, Messika-Zeitoun D, Shah AS, et al. A clinical risk score of myocardial fibrosis predicts adverse outcomes in aortic stenosis. Eur Heart J. 2016;37:713–723. doi:10.1093/eurheartj/ehv525
- Greve AM, Boman K, Gohlke-Baerwolf C, et al. Clinical implications of electrocardiographic left ventricular strain and hypertrophy in asymptomatic patients with aortic stenosis: the Simvastatin and Ezetimibe in Aortic Stenosis study. Circulation. 2012;125:346–353. doi:10.1161/CIRCULATIONAHA.111.049759
- Hering D, Piper C, Horstkotte D. Influence of atypical symptoms and electrocardiographic signs of left ventricular hypertrophy or ST-segment/T-wave abnormalities on the natural history of otherwise asymptomatic adults with moderate to severe aortic stenosis: preliminary communication. J Heart Valve Dis. 2004;13:182–187.
- Lund O, Nielsen TT, Emmertsen K, et al. Mortality and worsening of prognostic profile during waiting time for valve replacement in aortic stenosis. Thorac Cardiovasc Surg. 1996;44:289–295. doi:10.1055/s-2007-1012039
- National Kidney Foundation. K/DOQI clinical practice guidelines for chronic kidney disease: evaluation, classification, and stratification. Am J Kidney Dis. 2002;39:S1–S266.
- Calkins H, Kuck KH, Cappato R, et al. HRS/EHRA/ECAS Expert Consensus Statement on Catheter and Surgical Ablation of Atrial Fibrillation: recommendations for patient selection, procedural techniques, patient management and follow-up, definitions, endpoints, and research trial design. Europace. 2012;14:528–606.
- Joint Task Force on the Management of Valvular Heart Disease of the European Society of Cardiology, European Association for Cardio-Thoracic Surgery, Vahanian A, et al. Guidelines on the management of valvular heart disease (version 2012). Eur Heart J. 2012;33:2451–2496. doi:10.1093/eurheartj/ehs109
- Lang RM, Badano LP, Mor-Avi V, et al. Recommendations for cardiac chamber quantification by echocardiography in adults: an update from the American Society of Echocardiography and the European Association of Cardiovascular Imaging. Eur Heart J Cardiovasc Imaging. 2015;16:233–270. doi:10.1093/ehjci/jev014
- Dweck MR, Joshi S, Murigu T, et al. Midwall fibrosis is an independent predictor of mortality in patients with aortic stenosis. J Am Coll Cardiol. 2011;58:1271–1279. doi:10.1016/j.jacc.2011.03.064
- Gerdts E, Rossebo AB, Pedersen TR, et al. Relation of left ventricular mass to prognosis in initially asymptomatic mild to moderate aortic valve stenosis. Circ Cardiovasc Imaging. 2015;8:e003644.
- Greve AM, Gerdts E, Boman K, et al. Differences in cardiovascular risk profile between electrocardiographic hypertrophy versus strain in asymptomatic patients with aortic stenosis (from SEAS data). Am J Cardiol. 2011;108:541–547. doi:10.1016/j.amjcard.2011.03.084
- Okin PM, Devereux RB, Nieminen MS, et al. Relationship of the electrocardiographic strain pattern to left ventricular structure and function in hypertensive patients: the LIFE study. Losartan Intervention For End point. J Am Coll Cardiol. 2001;38:514–520. doi:10.1016/S0735-1097(01)01378-X
- Okin PM, Devereux RB, Fabsitz RR, et al. Quantitative assessment of electrocardiographic strain predicts increased left ventricular mass: the Strong Heart Study. J Am Coll Cardiol. 2002;40:1395–1400. doi:10.1016/S0735-1097(02)02171-X
- Villari B, Hess OM, Moccetti D, Vassalli G, Krayenbuehl HP. Effect of progression of left ventricular hypertrophy on coronary artery dimensions in aortic valve disease. J Am Coll Cardiol. 1992;20:1073–1079. doi:10.1016/0735-1097(92)90360-Y
- Julius BK, Spillmann M, Vassalli G, Villari B, Eberli FR, Hess OM. Angina pectoris in patients with aortic stenosis and normal coronary arteries. Mechanisms and pathophysiological concepts. Circulation. 1997;95:892–898. doi:10.1161/01.CIR.95.4.892
- Cowell SJ, Newby DE, Prescott RJ, et al. A randomized trial of intensive lipid-lowering therapy in calcific aortic stenosis. N Engl J Med. 2005;352:2389–2397. doi:10.1056/NEJMoa043876
- Guinot B, Magne J, Le Guyader A, et al. Usefulness of electrocardiographic strain to predict survival after surgical aortic valve replacement for aortic stenosis. Am J Cardiol. 2017;120:1359–1365. doi:10.1016/j.amjcard.2017.06.072