
Abstract
As a global event, urbanization will bring long-term effects to the supporting systems and ecosystem services of the whole world. The concept of Urban and Rural Non-construction Land (URNCL) is proposed based on ecological security. It is a spatial response to facing the grand challenge of resources and environmental and a demand to achieve sustainable development in rapid urbanizing regions. The paper carries out quantificationally and systematically comprehensive research of spatial evolution of URNCL and response of ecological security of Foshan city (ecological factor and ecosystem service) based on integrating multiple data sources including remote sensing data, land-use classification data, relevant statistical data and field survey and monitoring data and introducing remote sensing analysis methods, geographic information systems spatial analysis methods and mathematical model methods.
Since the reform and opening up, China has been facing an unprecedented crisis “man-land relationship” while the economy is growing at a high speed. Rapid urbanization region is facing two prominent realistic contradictions: (1) the conflicts between tight constraints of land resources and expansion of construction land. The disorder of urban and rural spatial growth can be summarized as tow aspects: the extension of the city and the sprawl of local town (Wi & Wang, Citation2008). The rapid expansion of construction land and the lack of effective guidance lead to highwayki expansion or urban sprawl to the periphery to the periphery in “pie” style in many big cities. (2) the contradiction between the decline of ecological carrying capacity and the increasing demand of human ecosystem services. The error industrialization, urbanization and modernization pattern that is high material consumption, high pollution, high consumption cause environmental pollution, ecological destruction and disasters, which makes the process of human development face with unprecedented challenges. Guided by the development view of the return of land ethics perspective, “the original behavioral philosophy that humans dominate nature” should be transformed. Combined the natural evolution of land with the development of reasonable development needs of human beings, we put forward the concept of urban and rural construction land.
1. The connotation of urban and rural non-construction land
Urban and Rural Non-construction Land (URNCL) is within scope of urban and rural space, based on ecological security, habitat society, development strategy, engineering and other needs, which couldn’t be used for large-scale urban development and construction within a certain period or no longer, whose spatial representation is the scope of the “blank” or “green” area outside the space urban and rural construction land. According to “The evaluation standard of urban and rural land (CJJ132–2009)”, the URNCL should include non-building land, unfavourable construction land and construction land with important ecosystem services.
1.1. Classification of URNCL
Types of URNCL should be divided into internal and external planning area. Within the planning area, referring to urban land classification standards, the G class green space and E class other and (except E6 class towns and villages construction land and E8 class land for open-pit mines) was classified as non-construction land; outside the planning area, referring to the standard of present land-use classification, the cultivated land, garden, woodland, grassland, water area and other land were classified as non-construction land. The URNCL from the ownership relationship, including state-owned non-construction land (forest parks, scenic spots, the state-owned forest farms, etc.) and collective ownership non-construction land (mainly agricultural land); From the view of function, URNCL including ecological dominant non-construction land for regional ecological security (such as forest parks, nature reserves, a certain size area of basic farmland protection areas, etc.) and the structure dominant non-construction land for blocking construction land sprawling (park green space within the city, greenbelt around the city, wedge-shaped green space, etc.) and non-construction land of two kinds of functions at the same time.
1.2. The impact of land-use change on Ecological Security
Land-Use and Cover Change (LUCC) will affect the structure and function of the major terrestrial ecological processes such as energy exchange, water cycle, soil erosion and accumulation, crop production and so on. LUCC will trigger the related ecological environmental effect, and lead to the change and evolution of ecosystems and ecological environment (Hou & Cai, Citation2004). The influence of LUCC on regional ecology is quite extensive, such as surface runoff, surface temperature, habitat suitability and diversity, water resources, the emission of carbon dioxide, nitrogen content and other aspects. Among them, surface runoff, surface temperature and biodiversity are considered as the three most important indicators of LUCC to regional ecological impact (Termorshuizen & Opdam, Citation2009; Lee, Huang, & Chan, Citation2008). The research focus of LUCC ecological environment effect is usually related to the research area. The ecological environmental effects of different research areas tend to have their own focus. For example, the ecological environment effects caused by urban expansion are usually hydrological process change, water environment change, regional ecosystem service function change and other aspects (Shao, Ni, Wei, & Xie, Citation2005; Shi, Chen & Pan, Citation2000).In the short period of time, because of the drastic change of land-use in rapid urbanization area, which makes the regional ecological environment is facing a huge impact.
2. The evolution characteristics of URNCL in Foshan City
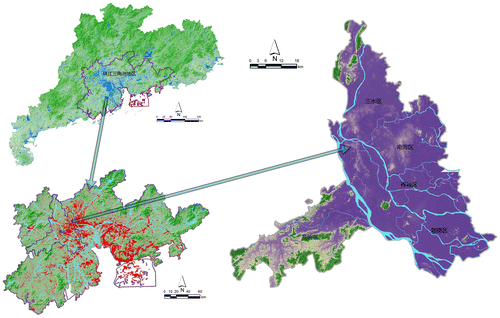
Foshan is located in the south-central area of Guangdong province, the hinterland of the Pearl River Delta, across the north latitude 22° 38′ ~23° 34′, longitude 112° 22′ ~113° 23′, east relies on Guangzhou, west meets Zhaoqing, south of Zhongshan, north of Qingyuan, adjacent to Hong Kong and Macao, the geographical position is superior. Foshan jurisdiction includs Chancheng district, Nanhai district, Shunde district, Sanshui district and Gaoming district, there are 11 neighbourhood offices, 20 town, an overseas Chinese economic development zone (area county crown units). With a total area of 3848.49 km2, permanent population is 5.9529 million, 2008 census register population is 3.6434 million.
Following the functional and structural classification principles of landscape ecology, considering the structure and characteristics of land use and the influence degree of human activities in Foshan at the same time, the URNCL is divided into (near) natural, semi natural and artificial three types; hen according to the land cover and vegetation structure characteristics, the land was divided into farmland, forest land, greenbelt, dike pond, water. Nature land includes the forest, water and a part of the green space (mainly for grassland), semi-natural land including the farmland(farmland and garden) and the dike-pond, artificial land mainly refers to urban green space.
This study analyzed the results of TM / ETM + remote sensing image classification, including 1990, 1995, 2000, 2005 and 2008. It is found that URNCL area decreased significantly from 1990 to 2008 in Foshan City, in 2008, Foshan’s URNCL with a total area of 2511.62 km2, less 985.67 km2 than in 1990, and the reduce rate is 28.18%. Farmland, woodland and dike-pond are the main types of URNCL in Foshan, proportion has been an absolute advantage (greater than 80%); the proportion of green space and water are less than 10% (Table ).
Table 1. Types of URNCL in Foshan City during 1990–2008.
3. The impact of URNCL change on the overall quality of ecological environment
The introduction of the regional ecological environment index as the whole quality index for characteristics of regional ecological environment, combined with the ecological service function of different land-use types, using the analytic hierarchy process for various types of land weight assignment, gain the index of the quality of the regional ecological environment. The eco-environmental quality and area proportion of various land-use type in the region are considered comprehensively, introducing the regional ecological environment index (EV) to the overall situation of quantitative characterization of a regional ecological environment quality. The greater its value, the better the quality of the regional ecological environment, and its expression is:(1)
In the Formula (Equation1(1) ), the LUi and Ci refer to the area and ecological environment index of the I land-use type in the period of T in this region; TA refers to the total area of the region; n refers to the land-use type and quantity of the area (Figure ).
Figure 1. Location and topography of Foshan City.
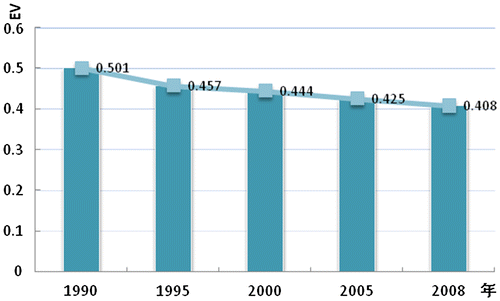
Based on the ecological service function of different land-use types, the expert weight analysis method is adopted, which is determined by nine experts in land management, environmental engineering and ecological evaluation. According to the effect of different land-use types on ecological environment quality, the weights of different landscape components were determined finally (Table ). By calculating the change of eco-environmental quality index in Foshan City during 1990–2008, it shows that the change of URNCL in Foshan has caused the ecological environment quality to decline year by year, from 0.501 in 1990 down to 0.408 in 2008 (Figure ).
Table 2. The ecological quality index weight of different land-use types in Foshan City.
Figure 2. The change of ecological environment quality index in Foshan City.
The rapid growth of construction land with low eco-environmental quality index and the sharp decline of (almost) natural URNCL with high ecological environment quality index are the main reasons for the formation of this phenomenon (Figure ).
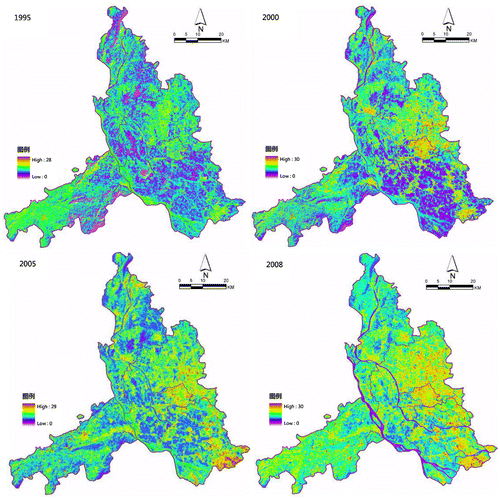
Figure 3. Changes of surface temperature in Foshan City.
4. The influence of URNCL change on the ecological factors
4.1. Impact on hydrological system
Foshan City domain two-thirds area belongs to the plain river network of the Pearl River Delta, with a dense network of rivers, the influence of URNCL change on the regional hydrological system is very significant. As one of the most important factors for the ecological environment, hydrological effects, and the land, vegetation constitute a stable triangular frame, which determines the overall quality of the ecological environment (Table ).
Table 3. Change of vegetation coverage in different levels in Foshan City.
According to the natural runoff and the average annual rainfall calculation from 1980 to 2000 in Foshan City, over the years annual runoff coefficient can be calculated to found a downward trend before 1995 and then began to increase significantly. Through a long time series of measured data research, some scholars found that a load range exists in the external disturbances of the regional hydrologic system, that is, there is a certain threshold, human disturbance and the changes of hydrological system exist “time delay” phenomenon (Yang, Citation2000). The large-scale development and construction changed the regional land mosaic structure since from the early 80’s of the last century in Foshan, making the regional hydrological cycle system changes. Before 1995, it is construction land increased the fastest (non-construction land reduced the fastest) period in Foshan, also during this period, the importance of farmland→pond of urban and rural non-construction with internal type conversion is the biggest. Due to impervious rate of construction, land and water (dike-pond) were significantly higher than that of other types of non-construction land, resulting runoff velocity is faster, but the runoff coefficient measured by average annual rainfall and natural runoff flow metre is not increasing linearly as expected, but appeared to decrease the fluctuation trend. After 1995 there is a clear upward trend, which also verifies the hysteresis phenomenon between human disturbance and hydrologic system changes.
4.2. Effects on surface temperature
Based on the calculated temperature pixel value of ArcGIS, the statistics of the surface temperature distribution area can be found: the urban heat island effect in Foshan City in 1990 was not obvious, but the heat island area whose surface temperature is higher than 20 °C had obvious upward trend from 1995. This is due to the rapid growth of land surface temperature in the 1990–1995 research period and the rapid decline in land surface temperature of non forest land types. After 2005, the region of the heat island area with a surface temperature higher than 25 °C increased greatly, which was directly related to the decrease of the water surface area with low surface temperature in this period. According to the change of surface temperature in Foshan City, the heat island area with surface temperature greater than 25 °C was mainly distributed in the original built-up area, newly developed area and main traffic line around before 2000. The beginning of 2005, the heat island area in Foshan city showed obviously a spread tendency, from Chancheng spread to the Guicheng street and Dali Town in the Eastern of Nanhai District, the formation of a larger area of city heat island area; at the same time, there has been a strong heat island effect area higher than 28 °C in the streets of Daliang and Ronggui in Shunde district; the urban heat island in Gaoming area has been mainly in built-up area and along Gaoming road; the heat island in Sanshui district has been mainly divided into built-up area and industrial park. In 2008, The area of heat island area which surface temperature was higher than 25 °C was further expanded in Foshan City, adjacent to the Guangzhou eastern region has been rolling into the film and the South China Sea area to the east of the island area extended to South Nanzhuang Town and Lecong Town, North Street and extended to the south of the town of Shishan Village; the distribution of urban heat island in Shunde is axially diffused along 105 National Road (Figure ).
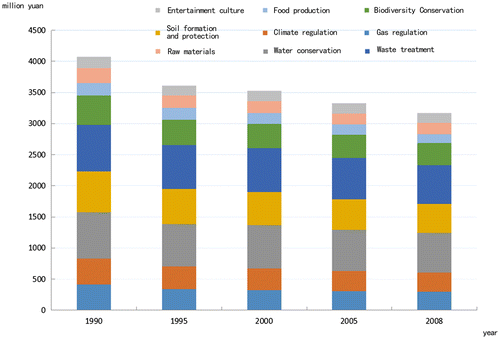
Figure 4. Changes of ecosystem services in Foshan City.
4.3. Effect on vegetation cover
Biodiversity, as the basic parameter of the regional ecological environmental system, is closely related to the elements of the regional ecological environment, its essence is the entity function of ecological environment factor under the support of fixed landscape pattern and material and energy circulation mode, which has index significance to the ecological environment quality of the reaction region (Li, Citation2007; Ding et al., Citation2010). The most populor and mature Normalized Difference Vegetation Index (NDVI) was used to characterize the impact of URNCL evolution on the biodiversity in this paper. According to actual vegetation cover of Foshan City, the types of vegetation cover can be classified into three categories: lower cover vegetation (0 < NDVI ≤ 0.15), middle coverage of vegetation (0.15 < NDVI ≤ 0.3) and high coverage of vegetation (NDVI > 0.3). According to the change of NDVI and spatial distribution in Foshan City, it can be found that the vegetation index of the city showed a downward trend, in which the largest decline in 1990–1995, the rate of decrease slowed after 1995, the reversal of the trend of small amplitude decreased after 2005, which is similar to the trend of forest types of urban and rural non construction land. The differences between different coverage level are large, the area of lower cover vegetation increased generally; middle coverage of vegetation area showed a downward trend; the downward trend in the area of high coverage of vegetation is very significant, rate of change come to −88.62%. From the perspective of spatial distribution, the average value of NDVI showed up as: Gaoming District>Sanshui District>Nanhai District>Shunde District>Chancheng District, while the change range of Nanhai District is the most obvious.
5. The impact of URNCL changes on the ecological system
As one of the ecological system, the urban ecological system integrates the ecosystem services with human services (Li, Liang, & Zhao, Citation2011). With the development of urbanization, the ecological service function is gradually replaced by human services. Integration of the service functions believes that there are ecological system threshold in the process of urbanization, when exceeding the threshold level, the ecosystem is on the verge of collapse (Ding et al., Citation2010). The definition of ecosystem service function is given in detail by Daily in his book <the natural services: human society’s dependence on the natural ecological system>: ecosystem services is to support and meet the natural system of human survival and the situation and the process of species composition. Including, ecosystem production, generation and maintenance of biodiversity, adjustment and stabilization of climatic conditions, mitigation of drought and flood disasters, maintenance and the fertility of soil, air and water purification, waste detoxification and decomposition, the material circulation, pollination and seed dispersal of crops and natural vegetation, plant diseases and insect pests outbreak control, human culture’s development and evolution, human senses of mental and spiritual benefits (Forman, Citation2008; Nassauer & Opdam, Citation2008).
Ecosystem service value (ESV) is calculated as follows:(2)
(3)
In the above formula, ESV is the value of ecosystem services (yuan), Ak is the acreage of study area land k types of area (ha), VCk is ecological value coefficient (Yuan/ha·a), ESVf is individual ecosystem services and their values (yuan), VCfk are single service function value coefficient (Yuan/ha·a).
This article choose < Chinese land ecosystem unit area ESV table > by Xie Gaodi, Lu Chun-xia and other scholars, through the different land-use types of the calculation of ecological service value, the total value of ecosystem service functions, in Foshan City, down from 40.7546 million yuan in 1990 to 31.6628 million yuan in 2008 in our study, the reduction value of the formation and conservation of soil and ecosystem service function value of biodiversity is most obvious, the most effective of Foshan city ecological service function is soil and water loss and reduction of large forest patches, the biggest drop is in 1990–1995, after that the decline has been slow (Figure ). Contrast to the analysis of URNCL change on the hydrological system disturbance, the threshold value is about in 1995, which can be speculated that this time period is the threshold interval for the transformation of the function of the ecosystem.
6. Discussion
In this paper we put forward the concept of URNCL based on the ecological security theory, which is the spatial response to huge challenges of resource and environment to the development of the rapid urbanization area. In addition, it is the demand for changing the concept of development and achieving the sustainable development. According to the analysis of URNCL evolution and the ecological security response in Foshan City, it can be found that the change of land use from one model to another, especially from the ecological productive land (non construction land) to the energy consumption type land (construction land), which will cause different degrees of influence and impact to the regional ecosystems following with a stress effect. The change of URNCL transform the land-use structure via the spatial-temporal accumulation of land use, which affects the first level of the ecological security – regional landscape pattern and ecological process, resulting in the changes of the spatial characteristics of landscape and further leading to the second aspects of the landscape ecological security/ecosystem service function change.
The impact on ecological security resulting from the changes of URNCL is reflected in two sides (ecological factors and ecosystems) one is the effect on the ecological factors of the ecosystem, reflected in the hydrological effect, surface temperature and vegetation cover three aspects: Performance: (1) hydrological effect: an increase in annual average runoff coefficient, the highest water level of annual flood has a rising trend; (2) surface temperature: from short time series and the local spatial scale, urban heat island region has trend of rolling piece. From long time series and regional spatical scale, regional spatial temperature in the annual average increased due to the accumulation of greenhouse gases; (3) the vegetation cover: the number of large forest patches as habitat decreased, the high vegetation coverage area decreased significantly. Second, reflected in the ecosystem service function: the service level and the service value of the ecosystem is reduced, the ecological service function is gradually transformed to the human requirement as the leading factor.
Disclosure statement
No potential conflict of interest was reported by the authors.
Funding
This research was financially supported by National Natural Science Foundation of China [project number 51408342]; MOE (Ministry of Education in China) Project of Humanities and Social Sciences [project number 14YJCZH166]; Key Laboratory of Subtropical Building Science, South China University of Technology [project number 2016ZB11]; Key Laboratory of Ecology and Energy-saving Study of Dense Habitat (Tongji University), Ministry of Education.
References
- Ding, N., Meng, F., Wang, Q., Li, Y., & Wang, J. (2010). Change of land use in rapidly urbanized area: A case study of Pudong New Area. Journal of Shandong Jianzhu University, 25, 364–367.
- Forman, R. T. T. (2008). Urban regions: ecology and planning beyond the city. New York, NY: Cambridge University Press.10.1017/CBO9780511754982
- Hou, L, & Cai, Y.-L (2004). The essential analysis and progress review of the land use/cover change research. Progress in Geography, 23, 96–104.
- Lee, C. L., Huang, S. L., & Chan, S. L. (2008). Biophysical and system approaches for simulating land-use change. Landscape and Urban Planning, 86, 187–203.10.1016/j.landurbplan.2008.02.006
- Li, B.-J. (2007). Study on Relationship between Land Use and Eco-Environment. Nanjing Agricultural University.
- Li, C., Liang, W.-C., & Zhao, R. Z. (2011). Evaluation of virescence ecological safety in dongying. Journal of Shandong Jianzhu University, 26, 529–531.
- Nassauer, J. I., & Opdam, P. (2008). Design in science: Extending the landscape ecology paradigm. Landscape Ecology, 23, 633–644.10.1007/s10980-008-9226-7
- Shao, J., Ni, J., Wei, C., & Xie, D. (2005). Land use change and its corresponding ecological responses: A review. Journal of Geographical Sciences, 15, 305–328.10.1360/gs050305
- Shi, P.-J., Chen, J., & Pan, Y.-Z. (2000). Landuse change mechanism in Shenzhen City. Acta Geographica Sinica, 55, 151–160.
- Termorshuizen, J. W., & Opdam, P. (2009). Landscape services as a bridge between landscape ecology and sustainable development. Landscape Ecology, 24, 1037–1052.10.1007/s10980-008-9314-8
- Yang, P.-R. (2000). Ecological landscape planning: urban development, landscape variation and hydrological effects of the Keelung River Basin 1980–2000. Taiwan: National Taiwan University.
- Wi, Y.-P., & Wang, J.-W. (2008). “Urban Expansion” and “Urban and Town Sprawl”: policy analysis of land-use regulations in the urban growth of China’s mega-cities. China Land Science, 22, 19–24.