
Abstract
Fuzzy set theory was successfully used to map areas of copper porphyry mineralization potential in the Ahar–Arasbaran district of Iran. Proximity to geological features is translated into fuzzy membership functions based upon qualitative and quantitative knowledge of spatial associations between known Cu porphyry occurrences and geological features in the area. Fuzzy sets of favourable lithology, geochemical anomaly, geophysical anomaly, structural feature, and alterations are combined using fuzzy logic as the inference engine. The fuzzy predictive maps delineate 84% of the known Cu porphyry occurrences. The results demonstrate the usefulness of a geologically constrained fuzzy set approach to map mineral potential and to redirect surficial exploration work in the search for yet undiscovered Cu porphyry mineralization in the mining district. The method described is applicable to other mining districts elsewhere.
1. Introduction
Geographical information systems (GIS) technology has shown growing application in many areas of knowledge, but especially in the mineral exploration. Mineral exploration involves the collection, analysis, and integration of data from different surveys. Mineral exploration generally starts on a small-scale (large areas) and, then, progresses to a larger scale (small areas) in order to define targets for more detailed investigations (Quadros, Koppe, Strieder, & Costa, Citation2006). Before the construction of a predictive model, which can be defined as representing the favourability or probability of occurrence of a mineral deposit of the type/style sought, a schematic subdivision has to be drawn depending on the type of inference mechanism considered. There are two general types of predictive modelling strategies: (1) knowledge-driven; and (2) data-driven (Feltrin, Citation2008). A third method is also used, which in fact combines the two main methods (Pazand & Hezarkhani, Citation2016). The former means that evidential weights are estimated subjectively based on one’s expert opinion about spatial association of target deposits with certain geological features and is based on genetic (ore genesis) associations, whereas the latter means that evidential weights are quantified objectively with respect to locations of known target deposits (Bonham-Carter, Citation1994; Carranza & Hale, Citation2001; Carranza, van Ruitenbeek, Hecker, van der Meijde, & van der Meer, Citation2008; Cheng & Agterberg, Citation1999; Moon, Citation1998; Porwal, Carranza, & Hale, Citation2004). Knowledge-driven approaches rely on the geologist’s input to weight the importance of each data layer (evidence map) as they relate to the particular exploration model being used. This approach is more subjective but has the advantage of incorporating the knowledge and expertise of the geologist in the modelling process (Harris et al., Citation2001). Examples of knowledge-driven approaches include Boolean logic, index overlays (Harris, Citation1989), analytical hierarchy process (Wilkinson, Harris, & Grunsky, Citation1999), and fuzzy logic (An, Moon, & Bonham-Carter, Citation1992). In this paper, we report the results of mapping Copper porphyry potential in the Ahar–Arasbaran district by employing the theory of fuzzy sets. The Ahar–Arasbaran metallogenic zone has been studied for decades because of its mineral potential for metallic ores, especially skarn copper (skarn and porphyry) and gold sulphides of which many occurrences are known in the area (Hezarkhani, Citation2006; Hezarkhani & Williams-Jones, Citation1996; Hezarkhani, Williams-Jones, & Gammons, Citation1997, Citation1999; Mollai, Dave, & Sharma, Citation2004; Mollai, Sharma, & Pe-Piper, Citation2009). The aim here is to demonstrate methods for processing the data and producing a Cu porphyry prospectivity map. This is important as each modelling method has advantages and disadvantages and one or the other may be more appropriate given certain geologic environments and exploration scenarios. However, the Cu prospectivity maps are compared in a general sense by evaluating how each map has predicted the known Cu prospects. The purpose of this work was to use the GIS techniques to perform the analysis and to provide maps for a better understanding of mineral potentials in the study area which evaluate fuzzy method for mineral potential mapping in order to define areas for detailed investigation.
2. Study area
Ahar–Arasbara area measures about 23,132 km2 and is located in the Azarbaijan province of north-western Iran. Iran can be divided into two marginal, active, fold belts located in the NE (Kopeh Dagh), resting on Eurasian Hercynian basement and in the SW (Zagros), overlying the precambrian Arabian plate (Nabavi,Citation1976) (Figure ). The Iranian plateau is located between these marginal fold belts. Intrusive rocks of Iran are of Precambrian, Mesozoic and Tertiary age (Stockline & Nabavi, Citation1973). The Tertiary plutonic bodies were mainly intruded during the Late Eocene–Oligocene, Oligo-Miocene and Pliocene epochs and host important mineralization. In the Alborz unit, Precambrian basement rocks are of Gondwanan affinity. Tectonic movements in the Late Precambrian caused significant uplift in Azarbaijan and locally formed angular disconformities (Eftekharnezhad, Citation1975). Vertical movements during the Cambrian are inferred from stratigraphic gaps between the Cambrian and younger rock units. Silurian and Early Devonian sedimentary sequences, as well as Upper Carboniferous sedimentary rocks, are absent in Azarbaijan (Nabavi, Citation1976). A thick Triassic to Upper Cretaceous sedimentary-volcanic sequence was subsequently folded during Late Cretaceous–Early Tertiary orogenic movement (Eftekharnezhad, Citation1975).
Figure 1. Major structural zones of Iran (after Nabavi, Citation1976) and the location of the Ahar–Arasbaran area in these zones and a modified and simplified geologic map of it (after Abdolahi & Hosseini, Citation1996; Amini,Citation1994; Asadian, Citation1993; Asadian, Mirzaee, Mohajjel, & Hadjialilu, Citation1994; Babakhani & Nazer, Citation1991; Faridi & Haghfarshi, Citation2006; Mahdavi & Amini Fazl, Citation1988; Mehrpartou, Citation1997, Citation1999; Mehrpartou, Aminifazl, & Radfar, Citation1992).
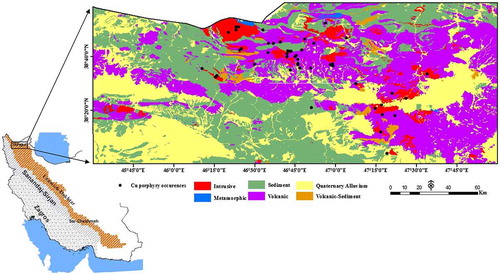
During the Late Eocene–Oligocene, the Alborz and central Iran units were cut by several intrusive bodies. Late Eocene–Oligocene (mainly Oligocene) plutonic activity was reported by Khain (Citation1975) from the Lesser Caucasus to northern Azarbaijan (Pourhosseini, Citation1981; Stockline & Eftekharnezhad, Citation1969). Urumieh–Dokhtar volcanic belt, which was first identified by Stocklin and Setudenia (Citation1972), consists of alkaline and calc-alkaline volcanic rocks (Figure ) and related intrusive (I-type) and was formed by subduction of the Arabian plate beneath central Iran during the Alpine orogeny (Berberian, Citation1976, Citation1983; Berberian & King, Citation1981; Pourhosseini, Citation1982; Stocklin & Setudenia, Citation1972). A belt of skarn–porphyry Cu deposits of late Tertiary age extends from Urumieh–Dokhtar in the NW Iran region (Figure ) and includes the well-known Sungun porphyry skarn deposit (Hezarkhani & Williams-Jones, Citation1997). Important Cu skarn deposits are found in and around the Oligocene–Miocene volcanic rocks in the area (Hezarkhani, Citation2006; Mollai et al., Citation2004, Citation2009) (Figure ).
3. Conceptual model
Porphyry copper deposits due to the large and important reserves have been well-studied. Also, these types of deposit have a special pattern that is important for regional exploration they are very good (Abedi, Mostafavi Kashani, Norouzi, & Yousefi, Citation2017; Yousefi & Carranza, Citation2017). Most of the porphyry copper deposits have been intensively studied in the Mesozoic-Cenozoic orogenic belts of the American Cordillera and East Pacific Rim (e.g., Ahmad & Rose, Citation1980; Dilles & Einaudi, Citation1992; Sillitoe, Citation1973) and their properties is relatively well understood. Several conceptual models have been proposed to explain the different styles of Cu Porphyry mineralization (Bliss, Citation1992; Gruen, Heinrich, & Schroeder, Citation2010; Sillitoe, Citation1999, Citation2010; Sillitoe & Gappe, Citation1984; Volkov et al., Citation2006; Xu et al., Citation2009). In Iran, all known porphyry copper mineralization occurs in the Cenozoic Urumieh–Dokhtar orogenic belt (Figure ). This belt was formed by subduction of the Arabian plate beneath central Iran during the Alpine orogeny (Berberian & King, Citation1981; Pourhosseini, Citation1981) and hosts two major porphyry Cu deposits (Zarasvandi et al., Citation2015). The Sarcheshmeh deposit is the only one of these being mined, and contains 450 million tonnes of sulphide ore with an average grade of 1.13% Cu and 0.03% Mo (Waterman & Hamilton, Citation1975). The Sungun deposit, which contains 500 million tons of sulphide reserves grading 0.76% Cu and 0.01% Mo (Hezarkhani & Williams-Jones, Citation1999), is currently being developed. A number of subeconomic porphyry copper deposits are all associated with mid- to late-Miocene diorite /granodiorite to quartz-monzonite stocks. Classic patterns of hydrothermal alteration (Hezarkhani, Citation2006, Citation2007) exist in most of these deposits. Based on the available spatial data-sets, we indentified following regional-scale recognition criteria for porphyry copper deposit occurrence in the Ahar–Arasbaran area:
| (1) | Host rock lithology | ||||
| (2) | Geophysics anomaly | ||||
| (3) | Geochemical anomaly | ||||
| (4) | Structural feature | ||||
| (5) | Alteration map | ||||
A general framework of this modelling can be seen in Figure .
Figure 2. General framework applied for data integration.
4. Fuzzy sets
In classical set theory, the membership of a set is defined as true (=1) or false (=0). In fuzzy set theory, a fuzzy set is defined as a subset from a large set whose membership in the subset may not be complete. Fuzzy sets are represented by membership functions. Membership function, μ
A
(x), is a mapping of the fuzzy membership of x from the universe of discourse X into the unit interval [0, 1], thus:(1)
The grade of membership is large (traditionally 1) for objects which fully belong to the fuzzy set; it is small (traditionally 0) for objects which do not belong to the fuzzy set (Zimmermann, Citation1991). In a fuzzy set, with increasing degrees of certainty, the membership of a class is closer to 1. Thus, individual classes of maps can be evaluated regarding their membership in a fuzzy set, based on a subjective judgement. Grade of membership usually is represented by a membership function which need not be linear or even continuous; indeed, many interesting fuzzy sets have extremely non-linear membership functions (Carranza & Hale, Citation2001). The membership always relates to a certain proposition. In our example, the proposition is “favorable location for Cu porphyry mineralization.”
For combining fuzzy sets, Zadeh (Citation1965) and Zimmermann (Citation1991) define a number of set operators based on fuzzy mathematics. The most widely used operators in fuzzy modelling are the fuzzy AND, fuzzy OR, the fuzzy complement, the fuzzy algebraic sum, the fuzzy algebraic product, and the gamma operator. The fuzzy AND operation is equivalent to a Boolean AND (logical intersection) operation on classical set values of 1 and 0. It is defined as:
(2)
where μ A is the fuzzy membership value for map A at a particular location, μ B is the fuzzy membership value for map B, and so on. The effect of this operation is to make the output map be controlled by the smallest (minimum) fuzzy membership value occurring at each location. The fuzzy AND operation is appropriate where two or more pieces of evidence for a hypothesis must be present together for the hypothesis to be true.
The fuzzy OR is similar to the Boolean OR (logical union) whereby the output fuzzy membership values are controlled by the maximum values of any of the input maps, for any particular location. The fuzzy OR is defined as:
(3)
This operator, in some circumstances, can be reasonable for mineral-potential mapping where favourable evidences for the occurrence of mineralization are rare and the presence of any evidence may be sufficient to suggest favourability.
The fuzzy algebraic product is defined as:(4)
The combined fuzzy membership values tend to be small with this operator, because of the effect of multiplying several numbers less than 1. The output is always smaller than, or equal to, the smallest contributing fuzzy membership value, and is thus “decreasive.”
The fuzzy algebraic sum operator is complementary to the fuzzy algebraic product, and is defined as:(5)
The result of this operation is always larger than, or equal to, the largest contributing fuzzy membership value. The effect thus is “increasive.”
The fuzzy “γ -operator” (Zimmermann & Zysno, Citation1980) is defined as:(6)
This “γ-operator” is obviously a combination of the fuzzy algebraic product and the fuzzy algebraic sum, where γ is a parameter between the range 0 and 1. When γ is 1, the combination is the same as the fuzzy algebraic sum; when γ is 0, the combination equals the fuzzy algebraic product. The parameter indicates where the actual operator is located between the logical “and” and “or.” The fuzzy method enables evidence maps to be combined in a series of steps regarded as an inference net (flowchart), instead of combining them in a single operation. The inference net is, in fact, a simulation of the logical process defined by a specialist.
5. Methods and result
5.1. Criteria description
The data used in this study were selected based on the relevance with respect to Cu porphyry exploration criteria as discussed previously. Airborne magnetic data (total field and vertical gradient) were used to identify linear magnetic anomalies representing geological features such as magnetite-bearing lithologies, ductile high-strain zones, shallow intrusive body, and faults. A number of geologic maps of differing scales (100,000 and 250,000) were used to prepare host rock evidence map. Total of 7000 stream sediment geochemical data were processed and determined anomaly and threshold (Hongjin, Daoming, Yanxiang, Yangang, & Xisheng, Citation2007; Rubio, Nombela, & Vilas, Citation2000; Woodsworth, Citation1972) of Cu, Mo, Pb, Zn, As, Au, Sb as pathfinder of Cu porphyry mineralization and prepare geochemical evidence map. Structural layer (faults), extracted from the geological maps and magnetic data. The area was divided into 100 × 100 m network and fault density per each cell was calculated and prepare fault concentration map as structural evidence map. Remote sensing data (Aster data) were used for extraction of advance argillic, argillic, phyllic, and iron oxide alteration layers (Azizi, Tarverdi, & Akbarpour, Citation2010) and to prepare an alteration evidence map. These evidence maps for creating proximity zones (buffering) around different features were buffered (Table ) and ready for data integration. The score of class is calculated using following equation:(7)
Table 1. Fuzzy membership values for evidential maps.
where W i is the weight of the ith evidential map and W j is the weight of the jth evidential class. Based on their subjectively assessed favourability, all classes of an evidential map are ranked in the scale of 1–10 in a reverse direction that is the most favourable class is ranked 10, and the least favourable class is ranked 1. Values of 10 are not assigned for evidential map because we can never be certain completely that a given distance is completely essential for the occurrence of copper mineralization. We used linear membership function for fuzzification of multiclass evidential maps in a knowledge-driven approach. Fuzzy membership values for evidential maps are given in Table .
5.2. Integration of fuzzy sets
Fuzzy sets can be combined altogether using one fuzzy operator or a variety of different fuzzy operators. The two-stage inference engine used here (Figure ) comprises four parallel networks that sequentially combine collateral fuzzy evidential maps transmitted by the fuzzifier through the fuzzy OR operator to yield intermediate fuzzy evidential maps in the first stage (Figure ), which are combined in the second stage using the fuzzy γ operator to generate the synthesized fuzzy favourability map.
Figure 3. Maps of fuzzy membership values of (A) favourable host environment; (B) favourable structure feature; (C) favourable alteration feature.
The intermediate fuzzy evidential maps were combined in the second stage of the inference engine using the fuzzy γ operator with γ = 0:75, 0.80, 0.85, and 0.90, to produce the fuzzy favourability maps shown in Figure .
Figure 4. Grey-scale synthesized fuzzy favourability maps obtained using γ value of (A) 0.75, (B) 0.80, (C) 0.85, and (D) 0.90. Combined fuzzy favourability ranges from minimum (white) to maximum (black).
Table gives the combined fuzzy favourability values and their respective area coverage in the synthesized fuzzy favourability maps. The plots of the cumulative fuzzy favourability and the cumulative areas are shown in the Figure . It can be seen from the plots and Table that the threshold combined favourability value is less than 0.5 for the three maps obtained using γ values of 0.75, 0.80, and 0.90, whereas it is 0.5 for the map obtained using a γ value of 0.85. The value < 0.5 suggest unfavourable model conditions, therefore, the former maps were rejected and the latter was defuzzified using 0.5 as the threshold. The resulting binary favourability map is shown in Figure .
Table 2. Defuzzification of fuzzy favourability maps.
Figure 5. Variation of cumulative combined fuzzy favourability with cumulative area in favourability maps. Note sharp change in slope of curves (marked by arrows) at cumulative combined fuzzy favourability values of (A) 1.2, (B) 1.5, (C) 1.8, and (D) 2.2. These values, respectively, correspond to threshold combined fuzzy favourability values of (A) 0.3, (B) 0.4, (C) 0.5, and (D) 0.4 (Table ).
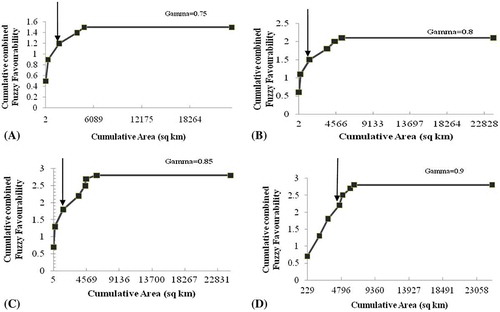
Figure 6. Favourability map for Cu porphyry mineralization. Black areas are favourable (combined fuzzy favourability value > 0.5) and white areas are unfavourable (combined fuzzy favourability value < 0.5). Small grey circle are “discovered” Cu porphyry and Au ephithermal deposits.
5.3. Validation of the results
The results were validated by overlaying the known mineral deposits on the binary favourability map (Figure ). It can be seen that the favourable areas, which occupy 1338 km2, contain 16 of the 19 known Cu Porphyry deposits in the study area. Thus, the model predicts 84.2% of the known Cu porphyry deposits; while at the same time reduce the search area to less than 5.7% of the total area.
6. Conclusions
The characteristics of a certain type of mineral deposits can be different in different areas, which are a function of the relative importance of individual factors of mineralization in different areas, are related to geological features associated to mineralization. In this research, data layers have been integrated according to their favourability in porphyry copper mineralization using fuzzy logic methods that the following results were obtained:
| (1) | The application of fuzzy set theory to predictive mineral potential mapping provides a strong theoretical framework for handling the complexity of modelling multiclass evidential maps in a flexible and consistent way. | ||||
| (2) | A qualitative and quantitative knowledge of the spatial association between known mineral occurrences and geological features in an area is important for mineral potential mapping. | ||||
| (3) | The qualitative and quantitative knowledge of spatial association between known mineral occurrences and geological features are together useful in the subjective decision on the appropriate fuzzy membership functions or scores. A qualitative knowledge alone may have proven inadequate to produce a fuzzy predictive map of Cu porphyry potential for the area. | ||||
| (4) | The design of the fuzzy inference network to combine the evidences for mapping mineral potential must be based upon the knowledge of the genesis or mode of formation of known mineralization in a particular area. | ||||
| (5) | The knowledge-driven fuzzy models reported in here result in demarcation of potential zones occupying less than 6% of the study area. This is a significant result in terms of reduction in search area. | ||||
| (6) | The best predictive maps produced by this study are comparable with the results of previous geological work. These maps predict 84% of the known occurrences. These maps can be used to direct exploration work to search for undiscovered occurrences in the area. | ||||
| (7) | This method is useful for exploration of Cu porphyry deposits because of its very significant pathfinder feature such as alteration pattern, geochemical pattern, and geological environment. | ||||
Disclosure statement
No potential conflict of interest was reported by the authors.
References
- Abdolahi, M. , & Hosseini, M. (1996). Geological map of Iran 1:100,000 series- Jolfa . Tehran: Geological Survey of Iran.
- Abedi, M. , Mostafavi Kashani, S.B. , Norouzi, G.H. , & Yousefi, M. (2017). A deposit scale mineral prospectivity analysis: A comparison of various knowledge-driven approaches for porphyry copper targeting in Seridune, Iran. Journal of African Earth Sciences , 128 , 127–146.10.1016/j.jafrearsci.2016.09.028
- Ahmad, S.N. , & Rose, A.W. (1980). Fluid inclusion in porphyry and skarn ore at Santa Rita. New Mexico: Economic Geology , 75 , 229–250.
- Amini, B. (1994). Geological map of Iran 1:100,000 series- Meshkinshahr . Geological Survey of Iran.
- An, P. , & Moon, W.M. , & Bonham-Carter, G.F. (1992). On a knowledge-based approach of integrating remote sensing, geophysical and geological information. Proc. IGARSS’92 , Houston, Texas, pp. 34–38.
- Asadian, O. (1993). Geological map of Iran 1:100,000 series- Tabriz . Geological Survey of Iran.
- Asadian, O. , Mirzaee, A. , Mohajjel, M. , & Hadjialilu, B. (1994). Geological map of Iran 1:100,000 series- Marand . Geological Survey of Iran.
- Azizi, H. , Tarverdi, M. , & Akbarpour, A. (2010). Extraction of hydrothermal alterations from ASTER SWIR data from east Zanjan, northern Iran. Advances in Space Research , 46 , 99–109.10.1016/j.asr.2010.03.014
- Babakhani, A. , & Nazer, N. (1991). Geological map of Iran 1:100,000 series- Lahrood . Geological Survey of Iran.
- Berberian, M. (1976). Contribution to the seismotectonics of Iran (part II) . Geological Survey of Iran, 39 pp. 518, 5 maps, 259 figures.
- Berberian, M. (1983). The southern Caspian: A compressional depression floored by a trapped, modified oceanic crust. Canadian Journal of Earth Sciences , 20 , 163–183.10.1139/e83-015
- Berberian, M. , & King, G.C. (1981). Towards a paleogeography and tectonic evolution of Iran. Canadian Journal of Earth Sciences , 18 , 210–265.10.1139/e81-019
- Bliss, J. (1992). Developments in mineral deposit modeling . U.S. Geological Survey Bulletin 2004.
- Bonham-Carter, G.F. (1994). Geographic information systems for geoscientists, modelling with GIS . Ontario: Pergamon Press.
- Carranza, E. , & Hale, M. (2001). Geologically constrained fuzzy mapping of gold mineralization potential, Baguio District, Philippines. Natural Resources Research , 10 (2), 125–136.
- Carranza, E. , van Ruitenbeek, F. , Hecker, C. , van der Meijde, M. , & van der Meer, F. (2008). Knowledge-guided data-driven evidential belief modeling of mineral prospectivity in Cabo de Gata, SE Spain. International Journal of Applied Earth Observation and Geoinformation , 10 , 374–387.10.1016/j.jag.2008.02.008
- Cheng, Q. , & Agterberg, F. (1999). Fuzzy weights of evidence method and its application in mineral potential mapping. Natural Resources Research , 8 (1), 27–35.
- Dilles, J.H. , & Einaudi, M.T. (1992). Wall-rock alteration and hydrothermal flow paths about the Ann-Mason porphyry copper deposit, Nevada; a 6-km vertical reconstruction. Economic Geology , 87 , 1963–2001.10.2113/gsecongeo.87.8.1963
- Eftekharnezhad, J. (1975). Brief description of tectonic history and structural development of Azarbaijan . Internal Report to the Ministry of Mines. Geological Survey of Iran. 10. (In Farsi).
- Faridi, M. , & Haghfarshi, E. (2006). Geological map of Iran 1:100,000 series- khajeh . Geological Survey of Iran.
- Feltrin, L. (2008). Predictive modelling of prospectivity for Pb–Zn deposits in the Lawn Hill Region, Queensland, Australia. Ore Geology Reviews , 34 , 399–427.10.1016/j.oregeorev.2008.05.002
- Gruen, G. , Heinrich, C. , & Schroeder, K. (2010). The Bingham Canyon porphyry Cu-Mo-Au deposit. II. Vein geometry and ore shell formation by pressure-driven rock extension. Economic Geology , 105 , 69–90.10.2113/gsecongeo.105.1.69
- Harris, J.R. (1989). Data integration for gold exploration in eastern Nova Scotia using a GIS. Proc. Remote Sensing for Exploration Geology , Calgary, Alberta, pp. 233–249.
- Harris, J. , Wilkinson, L. , Heather, K. , Fumerton, S. , Bernier, M. , & Ayer, J. (2001). Application of GIS processing techniques for producing mineral prospectivity maps – A case study: Mesothermal Au in the Swayze Greenstone Belt, Ontario, Canada. Natural Resources Research , 10 (2), 91–124.
- Hezarkhani, A. (2006). Petrology of the intrusive rocks within the Sungun Porphyry Copper Deposit, Azerbaijan, Iran. Journal of Asian Earth Sciences , 27 , 326–340.10.1016/j.jseaes.2005.04.005
- Hezarkhani, A. (2007). Fluid inclusion studies on BH3 drill core from Sonajil copper system . Ahar Copper Company, internal report No. 2, p. 3.7.
- Hezarkhani, A. , & Williams-Jones, A.E. (1996). Physico-chemical controls of alteration and mineralization at the Sungun Porphyry Copper Deposit, Iran. Geological Association Canada – Mineralogical Association Canada (GAC-MAC) Annual Meeting , Winnipeg, 21, A-44 1996.
- Hezarkhani, A. , Williams-Jones, A.E. , & Gammons, C. (1997). Copper solubility and deposition conditions in the potassic and phyllic alteration zones, at the Sungun Porphyry Copper Deposit, Iran. Geological Association Canada – Mineralogical Association Canada (GAC-MAC) Annual Meeting , Ottawa, Canada 50, A-67 1997.
- Hezarkhani, A. , Williams-Jones, A.E. , & Gammons, C.H. (1999). Factors controlling copper solubility and chalcopyrite deposition in the Sungun porphyry copper deposit, Iran. Mineralium Deposita , 34 , 770–783.10.1007/s001260050237
- Hongjin, J. , Daoming, Z. , Yanxiang, S. , Yangang, W. , & Xisheng, W. (2007). Semi-hierarchical correspondence cluster analysis and regional geochemical pattern recognition. Journal of Geochemical Exploration , 93 , 109–119.
- Khain, V.E. (1975). Structure and main stages in the tectono-magmatic development of the Caucasus: An attempt at geodynamic interpretation. American Journal of Science , 275A , 131–156.
- Mahdavi, M.A. , & Amini Fazl, A. (1988). Geological map of Iran 1:100,000 series- Ahar . Geological Survey of Iran.
- Mehrpartou, M. (1997). Geological map of Iran 1:100,000 series- Siahrood . Geological Survey of Iran.
- Mehrpartou, M. (1999). Geological map of Iran 1:100,000 series- Kaleybar . Geological Survey of Iran.
- Mehrpartou, M. , Aminifazl, A. , & Radfar, J. (1992). Geological map of Iran 1:100,000 series- Varzeghan . Geological Survey of Iran.
- Mollai, H. , Dave, V.K.S. , & Sharma, R. (2004). Copper mineralization at Mazraeh NorthWest of Iran: Evidences for fluid evolution and Skarn deposit. Abstract Volume of 32nd International Geological Congress , Florence, August 20–28, p. 223.
- Mollai, H. , Sharma, R. , & Pe-Piper, G. (2009). Copper mineralization around the Ahar batholith, north of Ahar (NW Iran): Evidence for fluid evolution and the origin of the skarn ore deposit. Ore Geology Reviews , 35 , 401–414.10.1016/j.oregeorev.2009.02.005
- Moon, W. (1998). Integration and fusion of geological exploration data: A theoretical review of fuzzy logic approach. Geosciences Journal , 2 (4), 175–183.10.1007/BF02910163
- Nabavi, M. (1976). An Introduction to the Geology of Iran . Geological Survey of Iran Publication, 109 pp. (in Persian).
- Pazand, K. , & Hezarkhani, H. (2016). Comparison of subjective and objective methods for the spatial estimation of the porphyry Cu potential in Ahar-Arasbaran area, north-western Iran. Bollettino di Geofisica Teorica ed Applicata , 57 , 343–364.
- Porwal, A. , Carranza, E. , & Hale, M. (2004). A hybrid neuro-fuzzy model for mineral potential mapping. Mathematical Geology , 36 (7), 803–826.
- Pourhosseini, F. (1981). Petrogenesis of Iranian plutons: A study of the Natanz and Bazman intrusive complexes (PhD thesis). University of Cambridge, 315 pp., also Geological Survey of Iran, Report No. 53.
- Pourhosseini, F. (1982). Petrogenesis of Iranian plutons: A study of the Natanz and Bazman intrusive complexes (PhD thesis). University of Cambridge, 315 pp.
- Quadros, T. , Koppe, J. , Strieder, A. , & Costa, J. (2006). Mineral-potential mapping: A comparison of weights-of-evidence and fuzzy methods. Natural Resources Research , 15 (1), 49–65.
- Rubio, B. , Nombela, M.A. , & Vilas, F. (2000). Geochemistry of major and trace elements in sediments of the Ria de Vigo (NW Spain): An assessment of metal pollution. Marine Pollution Bulletin , 40 , 968–980.10.1016/S0025-326X(00)00039-4
- Sillitoe, R.H. (1973). Geology of the los Pelambres porphyry copper deposit, Chile. Economic Geology , 68 , 1–10.10.2113/gsecongeo.68.1.1
- Sillitoe, R.H. (1999). Style of high-sulfidation gold, silver and copper mineralization in porphyry and epithermal environments. In Pacrim ‘99 Congress, Bali, Indonesia, 1999 (pp. 29–44). Melbourne: Australian Institute of Mining and Metallurgy.
- Sillitoe, R.H. (2010). Porphyry copper systems. Economic Geology , 105 , 3–41.10.2113/gsecongeo.105.1.3
- Sillitoe, R.H. , & Gappe, I.M., Jr. (1984). Philippine porphyry copper deposits: Geologic setting and characteristics . Bangkok: United Nations ESCAP, CCOP Technical Publication 14, 89 pp.
- Stocklin, J. , & Setudenia, A. (1972). Lexique Stratigraphique International Volume III ASIE Centre National de la Recherche Scientifique. 15, quaiAnodle-France 75 (Paris-VII).
- Stockline, J. , & Eftekharnezhad, J. (1969). Explanatory text of the Zanjan quadrangle Map, 1/250,000 . Geological Survey of Iran.
- Stockline, J. , & Nabavi, M.H. (1973). Tectonic map of Iran . Geological Survey of Iran.
- Volkov, A.V. , Savva, N.E. , Sidorov, A.A. , Egorov, V.N. , Shapovalov, V.S. , Prokofev, V.Y. , & Kolova, E.E. (2006). Spatial distribution and formation conditions of Au-bearing porphyry Cu–Mo deposits in the Northeast of Russia. Geology of Ore Deposits , 48 (6), 448–472.
- Waterman, G.C. , & Hamilton, R.L. (1975). The Sar Cheshmeh porphyry copper deposit. Economic Geology , 70 , 568–576.10.2113/gsecongeo.70.3.568
- Wilkinson, L. , Harris, J. , & Grunsky, E. (1999). Building a lithogeochemical dataset for GIS analysis: Methodology, problems, and solutions . Geol. Survey Canada, Open File 3788, 568 pp.
- Woodsworth, G.J. (1972). A geochemical drainage survey and its implications for metallogenesis, Centeral coast mountains, British Columbia. Economic Geology , 66 , 1104–1120.
- Xu, W. , Pan, F. , Qu, X. , Hou, Z. , Yang, Z. , Chen, W. , … Cui, Y. (2009). Xiongcun, Tibet: A telescoped system of veinlet-disseminated Cu (Au) mineralization and late vein-style Au (Ag)-polymetallic mineralization in a continental collision zone. Ore Geology Reviews , 36 , 174–193.10.1016/j.oregeorev.2009.04.004
- Yousefi, M. , & Carranza, E.J.M. (2017). Union score and fuzzy logic mineral prospectivity mapping using discretized and continuous spatial evidence values. Journal of African Earth Sciences , 128 , 47–60.10.1016/j.jafrearsci.2016.04.019
- Zadeh, L.A. (1965). Fuzzy sets: IEEE Information and Control , 8 (3), 338–353.
- Zarasvandi, A. , Rezaei, M. , Sadeghi, M. , Lentz, D. , Adelpour, M. , & Pourkaseb, H. (2015). Rare earth element signatures of economic and sub-economic porphyry copper systems in Urumieh–Dokhtar Magmatic Arc (UDMA), Iran. Ore Geology Reviews , 70 , 407–423.10.1016/j.oregeorev.2015.01.010
- Zimmermann, H.-J. (1991). Fuzzy set theory – And its applications (2nd ed., 399 pp.). Dordrecht: Kluwer Academic.10.1007/978-94-015-7949-0
- Zimmermann, H.-J. , & Zysno, P. (1980). Latent connectives in human decision making. Fuzzy Sets and Systems , 4 , 37–51.10.1016/0165-0114(80)90062-7