
Abstract
The water quality data of fixed 44 wells were monitored during post- and pre-monsoon season 2005–2013 of Kanchipuram district of state Tamil Nadu, India. Water Quality Indices (WQIs) methodology was applied to categorize groundwater on the basis of rating. In total, 13 groundwater quality parameters: calcium (Ca2+), magnesium (Mg2+), sodium (Na+), potassium (K+), bicarbonate (HCO3 −), nitrate (NO3 −), chloride (Cl−), fluoride (F−), sulphate (SO4 2−), total hardness (TH), total dissolved solids (TDS), hydrogen ion concentration (pH) and electrical conductivity (EC) were taken for statistical analysis. Three different WQI models were computed using a decadal physicochemical water quality data mainly for drinking (WQI1 and WQI2) and irrigation (WQI3) need. The WQIs variability thematic maps were generated in the Geographical Information System environment through ArcGIS software. These spatial distribution maps of WQI provide a detailed overview. The work outlined that the groundwater of the area is impaired by the anthropogenic activities and needs proper management plan to control further contamination and pollution of the groundwater of the area. Further, the groundwater of few monitoring wells needs a proper treatment before its consumptive uses. The alternative water supply should be provided to local inhabitants for daily uses.
Introduction
Groundwater is a major source of drinking water supply in urban and rural areas. Risk assessment of groundwater involves identifying and understanding the hazard associated with a particular occurrence, action or circumstance and determination of the probability for the occurrence of such hazards (Smith, Citation2001). Hence, evaluation of groundwater quantity and quality and establishing database is an important step to develop further civilization and for future water resources development strategies (Gautam et al., Citation2013, Citation2015, Citation2016, Citation2018; Jacintha et al., Citation2016; Kumar et al., Citation2018; Nemčić-Jurec et al., Citation2017; Rawat, Mishra, & Singh, Citation2017a; Rawat, Tripathi, & Singh, Citation2017b; Rawat et al., Citation2018; Singh et al. Citation2013a, Citation2015; Thakur, Diwakar, & Singh, Citation2015; Tiwari, De Maio, Singh, & Mahato, Citation2015; Tiwari, Lavy, Amanzio, & De Maio, Citation2017; Tiwari, Singh, & Mahato, Citation2014; Tiwari, Singh, Singh, & De Maio, Citation2016).
Water Quality Indices (WQIs) are widely used tool in evaluation of water quality; it summarizes a number of water quality parameters into a meaningful single numerical value (Singh et al. Citation2013a, Citation2015; Singh, Singh, & Gautam, Citation2016; Stambuk-Giljanovik, Citation2003). It is simple and easy to understand for decision makers about quality and possible uses of any water body (Jacintha et al., Citation2016). WQIs serve the understanding of water quality issues by integrating large complex data and generating a score that provide to prioritize the management plan and fund. The water resources are impaired by human induced activities and geogenic activities (Amin, Fazal, Mujtaba, & Singh, Citation2013; Singh, Singh, Kumar, Gupta, & Mukherjee, Citation2009). WQI reflects the composite influence of different water quality parameters and is being used to provide comparisons of water quality status for different locations and at different time and acts as a water quality status prediction tool (Singh et al., Citation2013a, Citation2016; Tiwari et al., Citation2014). Still there is no globally accepted composite WQI in literature. Few commonly used WQIs namely National Sanitation Foundation Water Quality Index Additive Model (NSFAWQI)(assessment and communication), National Sanitation Foundation Water Quality Index Multiplicative Model (NSFMWQI) (insensitive to low sub index values), Unweighted Multiplicative Water Quality Index (UMWQI) (need to minimize overall index and sub index values) and Canadian Council of Ministers of the Environment Water Quality Index (CCME-WQI; to manage large complex data and to evaluate success and failure of management strategies) and many more are referred by many researchers. WQIs are relying on normalizing, or standardizing parameters values by parameter according to expected concentrations, and divulge as “good” vs. “bad” concentration. The UMWQI model parameters are weighted according to their perceived importance to overall water quality and the index is calculated as the weighted average of all observations of interest (Liou, Lo, & Wang, Citation2004; Pesce & Wunderlin, Citation2000; Sargaonkar & Deshpande, Citation2003; Stambuk-Giljanovik, Citation2003; Tsegaye et al., Citation2006). Scientists are trying to develop a unique WQI by minimizing the overall index and sub index values. WQIs provide ways to introduce and determine that particular standard value and helps in prediction of harmful effects.
WQIs have been mostly used in evaluation of potable water; very limited study has been carried out to evaluate the water for agriculture purpose (Singh et al., Citation2015). EC and Na+ play a vital role in evaluation of water status for irrigation. Higher EC in water creates a saline soil and deteriorates the soil health and reduces the crop yield. The salts apart from affecting the growth of plants also affect the soil structure, permeability and aeration which indirectly affect plant growth. Higher salt content in irrigation water causes an increase in soil solution osmotic pressure (Shaki & Adeloye, Citation2006; Thorne & Peterson, Citation1954). The saline soils are reclaimed by the use of gypsum.
Geographical information system (GIS) used for variety of application from micro-level planning to macro-level planning, implementation and regular monitoring (Srivastava et al., Citation2013). The GIS is rapidly growing field of research with an integration of different subjects from atmosphere to ocean, land, sea, water resources, health, defence, agriculture, demography, forestry to economics and many more. GIS is defined as a technique to capture, store, retrieve, analyse and predict (Gajbhiye et al., Citation2016). GIS is also used as database system to store and prepare 2D, 3D or 4D water quality status maps according to concentration values of different chemical constituents. Different researchers used the GIS in the field of groundwater quality mapping (Singh et al., Citation2013a, Citation2013b).
The integration of WQIs with GIS provides the detailed, quick and reliable information for decision makes to adopt or implement strategies related to water pollution and scarcity (Singh et al., Citation2013b). The integration of WQIs data with other physical or biological driver’s database in GIS helps in improving the already polluted water bodies and suggests the decision maker to take necessary action in time. The water suitability of sampled well is evaluated based on recommended permissible limits for parameters as recommended by WHO (Citation2006) for drinking use and food and agriculture organization (FAO) for agriculture purpose.
The main objective of the work was to evaluate the decadal water quality data for potable and irrigation uses. In this work, WQI1 and Nemerow's Pollution Index (NPI) (WQI2) index is used for appraisal of groundwater for domestic purposes. Whereas ratio of dissolved sodium as %Na (WQI3), is used to evaluate groundwater for irrigation purpose.
Study area
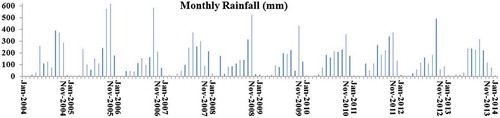
Study area Kanchipuram district of Tamil Nadu state (11° 00′–12° 00′ North latitudes and 77° 28′–78° 50′ East longitudes; Figure 1(a)) with average elevation as 83.2 m above mean sea level. The land around study area is flat and slopes towards the south and east. Study area is bound by Bay of Bengal in the East. The 47% population is engaged in agriculture activities and paddy is dominant crop. The soil in the region is mostly clay, with some loam, clay and sand. This district is mainly depending on the seasonal rains, the distress conditions prevail in the event of the failure of rains. Northeast and Southwest monsoon are the major donors with 54 and 36% contribution each to the total annual rainfall. During normal monsoon, the district receives average annual rainfall of 1213.3 mm (Figure 1(b)).
Figure 1a. Land use/land cover map of study area with forty four fixed well locations. Source: Author.
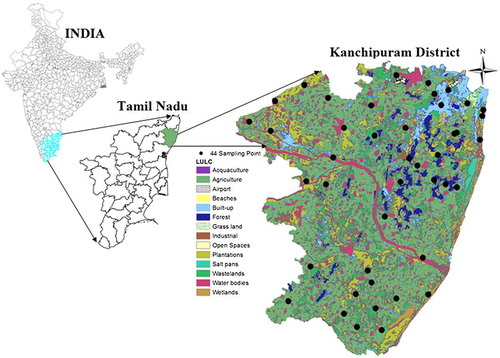
Figure 1b. Graphical representation of rainfall variability in study area during 2005–2013.
Materials and methods
The data related to groundwater quality were acquired from Chennai Water Metro Board/Central Ground Water Board (CGWB) during the pre- and the post-monsoon seasons using fixed sampling (because of fixed tube wells) technique. Forty-four groundwater samples were acquired of May 2005 (pre-monsoon) and sampling activity was repeated during January 2006 (post-monsoon) and it is a regular monitoring. Out of 44 samples points, most of wells are situated near agricultural location while some points were along village and town. Information related to date of collection/sampling, vegetation and cropping system, location of nearby ponds etc. was also recorded.
Collected samples were analyzed by CGWB as per procedure laid down in APHA (Citation1998) in the laboratory to measure primary parameters of groundwater as Ca2+, Mg2+, Na+, K+, HCO3 −, NO3ˉ, Cl−, F−, SO4 2, CO3 2ˉ, TDS, pH and EC.
Computation of WQI
For computation of WQI, 13 quality parameters have been chosen, analysis involved in two steps; a single analysis for each parameter and the WQI ( WQI1, WQI2 and WQI3). Standards of water quality recommended by the WHO (Citation2006) have been used to calculate WQI.
The weighted arithmetic index method (Brown, McClelland, Deininger, & Tozer, Citation1970; Singh et al. Citation2013b, Citation2015, 2016) was used for the calculation of WQI. Further, quality rating or sub index (Q
n
) was calculated using the following expression Equationsn (Equation1–Equation3(3) ):
(1)
Q n = Quality rating for the nth water quality parameter; V n = Actual value of nth parameter; v i = Ideal value of this parameter; V s = Standard permissible value of the nth parameter (Table ); [Consider V i = 0 for all except pH where V i = 7 for pH]
Table 1. Calculation for proportionality constant (K) and unit weight (W n ) for groundwater parameters of study area.
Unit weight was calculated by a value inversely proportional to the recommended standard value V
s
of the corresponding parameter.(2)
where W n = unit weight for the nth parameters; K = constant for proportionality; V s = standard value for the nth parameters (Table ).
The method to classify water quality is based on overall water quality index (WQI)1, which are calculated by aggregating the quality rating Q
n
linearly as expressed by Equation (Equation3(3) ).
(3)
WQI rating was performed according to Rawat et al. (Citation2017a) and Singh et al. (Citation2015). According to Rawat et al. (Citation2017a), WQI values are rated as excellent (WQI < 25), good (20< WQI > 50), poor (50 < WQI > 75), very poor (70 < WQI > 100) and unfit for human consumption (WQI > 100; Table ).
Table 2. Rating of water quality according to WQI1, WQI2 and WQI3 Index.
Nemerows pollution index (NPI or WQI2)
It is a simplified pollution index introduced by Neme (Mohan, Singh, Panday, Kumar, & Jain, Citation2007) which is also known as Nemerow's Pollution Index. It is given as by Equation (Equation4(4) ):
(4)
Soluble sodium percentage (SSP or WQI3)
Excess Na+, combining with carbonate, leads to formation of alkali soils, whereas with chloride, saline soils are formed. Neither soil will support plant growth (Rao, Citation2006; Singh et al., Citation2013). Generally, %Na+ should not exceed 60% in irrigation waters. Sodium content is generally expressed in terms of per cent sodium or soluble sodium percentage (WQI3). Wilcox (Citation1955) planned a method for rating the irrigation waters based on the percentage of sodium. The percentage of sodium in water can be calculated using Equation (5) as follow.5
Sodium percentage is an important factor for studying sodium hazard. It is also used for adjudging the quality of water for agricultural purposes. High percentage sodium water for irrigation purpose may stunt the plant growth and reduces soil permeability (Joshi, Kumar, & Agrawal, Citation2009; Singh et al., Citation2015).
Variability analysis of WQI n
For variability analysis of WQI n (n = 1, 2, 3) during study period is segregated into three parts (i) average WQI n of the pre-monsoon, (ii) average WQI n of the post-monsoon and (iii) average WQI n (pre + post-monsoon) during study period. For creating special destitute map of WQI n of study area, IDW (Inverse Distance Weightage) interpolation method was used in GIS environment.
GIS and inverse distance weighted (IDW)
The boundary of the study area was digitized from Survey of India toposheet using ArcGIS software. The precise locations of monitoring wells were recorded using GARMIN 12-Channel GPS and later are imported in GIS platform. The computed WQIs obtained from the water quality parameter were used in GIS and thematic maps were created with the help of spatial analyst module available in ArcGIS 10 software. Inverse distance weighted (IDW) interpolation technique was used for generating the WQIs thematic maps. IDW is versatile, easy to use program, and fairly accurate under a wide range of conditions and capture the extent of local spatial variation (Singh et al., Citation2015). By applying IDW method, the property at each unknown location for which a solution is seeking can be expressed as mathematically by Equation 5 (Singh et al., Citation2015). The expression for IDW can be depicted using the Equations 6, Equation7(7) , and Equation8
(8) :
(6)
(7)
(8)
where λ i – is the weight for neighbor i (the sum of weights must be unity to ensure an unbiased interpolator); d(S o , S i ) – is the distance from the new point to a known sampled point; β – is a coefficient that is used to adjust the weights and n – is the total number of points in the neighborhood analysis.
Results
Hydrogeochemistry
The descriptive statistical results of the pre-monsoon of the year (2005–2013) are given in Table (a). EC varied from 180 to 12240 dS/m with a mean of 1322.90 dS/m. The range, mean and SD of pH are 6.80–8.6, 8.37 and 0.40. The mean cations concentration followed a descending order as: Na+>Ca2+>Mg2+>K+, 140.54, 64.31, 50.26 and 18.46 mg/l, respectively. Similarly in case of anions, the mean concentration follows a descending order as: HCO3 - > Cl- > SO4 2- > CO3 2- > NO3 - > F-, 259.78, 236.10, 92.55, 24.46, 8.42 and 0.43 mg/l, respectively. Mean concentration of pH, EC, Ca2+, Na+, K+, Cl−, SO4 2−, CO3 2−, HCO3 −, NO3 − and F− are below the WHO (Citation2006) recommended concentration during the pre-monsoon year (2005–2013). The mean concentration of Mg2+ (50.26 mg/l) in the pre-monsoon is higher than recommended WHO (Citation2006) as 50 mg/l.
Table 3. Descriptive statistics of physiochemical parameters of forty four samples (a) pre-monsoon (2005–2013) and (b) post-monsoon (2006–2013).
Results of the post-monsoon year (2006–2013) are given Table (b). The results of the descriptive statistics revealed that there is no statistically significant differences between the mean concentration of the parameters values between June (pre-monsoon) and January (post-monsoon), only few degree of decreasing except mean value of K+ (increasing 0.93 mg/l with respect to the pre-monsoon value of K+ (18.46 mg/l). The mean cations concentration is followed a descending order as: Na+ (125.56 mg/l) > Ca2+ (62.74 mg/l) > Mg2+ (47.93 mg/l) > K+ (19.39 mg/l). The mean concentration in groundwater during the post-monsoon year (2006–2013) followed a descending order as: HCO3 − > Cl− > SO4 2− > CO3 2− > NO3 − > F−, 244.94, 223.54, 76.04, 28.70, 7.15 and 0.39 mg/l, respectively. The mean concentration of pH ranged between 8.37 ± 0.40 at pre-monsoon and 8.20 ± 0.43 at the post-monsoon (Table (a) and (b)).
Post-monsoon water quality index (WQI)
Table 4(a) shows the WQI value of pre-monsoon. The post-monsoon (month of January) years wise all the samples with their category are given in Table (b) and Table ((a)–(c)). During the post-monsoon, concentration of chemical effect slow down the process (dilution process by rainfall) therefore more number of samples falls under first category according to WQI1 with respect to the pre-monsoon WQI1. During the post-monsoon year 2006 largest percent (84 %, total 37 well’s water) of samples come under excellent category because of during the pre-monsoon (July) 2012, 25 percent samples were under excellence limit and these percentage increased up to 84 percent due to only chemical dilution process by rainfall (during 2005 good amount of rainfall receive by study area, Figure 1(b)). Similarly, during year 2008 pre- monsoon (July), 22 percent well’s come under < 10 limit but after rainfall (good amount of rainfall events so more groundwater recharge, Figure 1(b)) and dilution process this percentage increase up to 43%during post- monsoon year 2009. Due to rainfall factor, year 2009 the pre-monsoon 9% increase up to 68% (Table (a)) at the post-monsoon 2010. From Table (a), clearly reveal effect of rainfall phenomena over WQI, after rainfall any well’s water not come under unsuitable category.
Table 4. Descriptive statistics of computed different WQI (WQI1, WQI2 and WQI3) (a) pre-monsoon (2005–2013) and (b) post-monsoon (2006–2013).
Table 5a. Variability of groundwater samples during post-monsoon based on WQI1 Index.
Table 5b. Variability of groundwater samples during post-monsoon based on WQI2 Index.
Table 5c. Variability of groundwater samples during post-monsoon based on WQI3 Index.
Table (b), most time of study period much no. of wells are found under excellence (< 10) and good (10–20) category some time few no. of wells come under third category (20–30) during the post-monsoon years but it is observed with this index that is after rainfall no well not exist in fourth and fifth category of WQI3 it is only due to dilution process by rainfall.
Table (c), it is clearly observed effect of rainfall over WQI value due to dilution process during post monsoon. According to Table (c) after pre-monsoon, any well not exist in category 30–40 (forth) and > 40 (fifth). After rainfall leaching of Ca2+, Mg2+, Na+ and K+ are more chances from rock but its net result give high yield in dominator of Equation 5. Its result will be come as less WQI3 value, due to this reason after rainfall mostly wells water come under suitable classes for irrigation purposes.
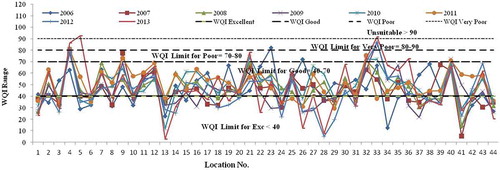
Figure 2(a), well no. 4, two time (2008 and 2011, Table (b)) jump into forth category of WQI1 with scoring of 89.62 and 80.35 (Table (a)). Well no. 22 (year 2013), 36 (year 2011), 25 and 43 comes under forth category during 2007 and 2013, respectively. According to WQI1 during the post-monsoon single well is not come under unfit class, form Figures 2(a) and 3(a) it is clear that during the post-monsoon year dilution process was active in study area, therefore, almost for all well WQI1 values has been reduced.
Figure 2a. Graphical representation of variability in study area of groundwater samples during post-monsoon based on WQI1.
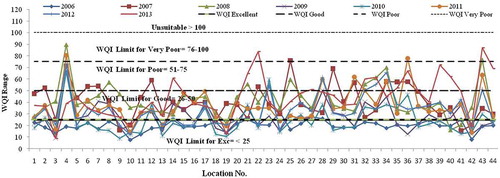
Figure 2(b) and Table (b), it is observed that WQI2 also capable to show dilution process effect over wells during post-monsoon years. During the post-monsoon time series only seven time different wells as well no. 6 (2008), 24 (2006), 27 (2007, 2010 and 2013), 34 (2007) and 36 (2011 and 2012) are comes under third category (20–30) of WQI2 (Figure 2(b) and Table (a)) otherwise all wells come under excellence and good class according to WQI2 scaling method. According to average values throughout year WQI2 values exist under first category (Table (a)).
Figure 2b. Graphical representation of variability in study area of groundwater samples during post-monsoon based on WQI2.
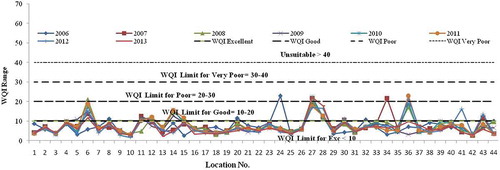
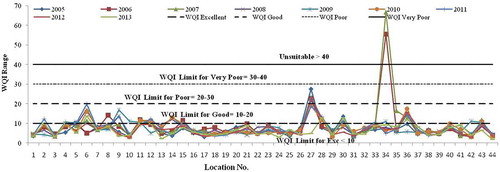
Figure 2(c) and Table (b), reveal that after the pre monsoon due to rainfall factor mostly no. of wells come under first and second class of WQI3. Impotency of rainfall factor can be understand as that during the pre-monsoon total 44 no. of wells were (Table (c)) come under unfit or unsuitable category for irrigation but due to rainfall factor these 44 well reduce up to 8 (6 in poor and 2 in unfit class, Table (c)). On an average during the post-monsoon wells were exist under second class of WQI3 (Table (c)).
Figure 2c. Graphical representation of variability in study area of groundwater samples during post-monsoon based on WQI3.
Pre-monsoon water quality index (WQI)
Year wise all samples with their corresponding category are given in Table (a) and Table ((a)–(c)). WQI1, during the pre-monsoon year 2005 (34.1 % = 15 samples out of 44) and 2010 (38 % = 17 samples out of 44) large percentage of samples come under excellent/fair class. WQI1 each time large number of samples comes under good (WQI1 ranges, 25–50) class. Three samples come under unfit class (>100) during the pre-monsoon(2009). WQI2-based result of same time period (Table (b)), shows large number of samples comes under excellent category (<10) because WQI2 index is based on ratio and it is very rare change for sum of ratio, cross first limit (<10) barrier due to this fact WQI2 cannot touch > 40 limit. Therefore according WQI2, study area come under two classes as excellence (< 10) and good (10–20).
Table 6a. Variability of groundwater samples during pre- monsoon based on WQI1 Index.
Table 6b. Variability of groundwater samples during pre-monsoon based on WQI2 Index.
Table 6c. Variability of groundwater samples during pre-monsoon based on WQI3 Index.
From irrigation point of view WQI3 (Table (a)) reveal that most of study period (2005–2013), area come under good (40–70) category therefore groundwater of study area is suitable for irrigation purposes (Shaki & Adeloye, Citation2006).
Figure 3(a) and Table (a), well no. 4, is more polluted due to 5 parameters EC (1780 dS/m), Cl− (277 mg/l), TDS (1075 mg/l), F− (2.17 mg/l) and Na+ (340 mg/l). In same manner well no. 23 also come under unsuitable limit (>100, Figure 3(a)) during 2009 because this year four parameters (pH = 8.8, EC = 1430 dS/m, Mg2+ = 49~50 mg/l and F = 1.6 mg/l) out of 13 parameters cross the WHO (Citation2006) standard limit and second reason is two parameters as pH (WpH = 0.134) and F- (WF = 0.759) out of four parameters (pH, EC, Mg2+ and F−) have high weight with respect to other parameters therefore WQI1 having high value for well no. 23. Figure 3(a) and Table (a) also reveal that well no. 34 come under the fifth class (>100) because six chemical parameters EC (1880 dS/m), Ca2+ (80 mg/l), Mg2+ (83 mg/l), Cl− (383 mg/l), TDS (1019 mg/l) and F− (1.78 mg/l) are above the WHO (Citation2006) standard values during the pre-monsoon year 2009 and during 2007 this well was also polluted because this time seven parameters (EC = 12240 dS/m, Ca2+ = 380 mg/l, Mg2+ = 1021 mg/l, Cl− = 4219 mg/l, Na+ = 823 mg/l, SO4 2− = 612 mg/l and TDS = 7341 mg/l) were above the standard limit WHO(Citation2006). Well no. 35 was also unsuitable (Figure 3(a)) for drink during the pre- monsoon year 2013, because present of heavy weightage parameter (pH and F).
Figure 3a. Graphical representation of variability in study area of groundwater samples during pre-monsoon based on WQI1.
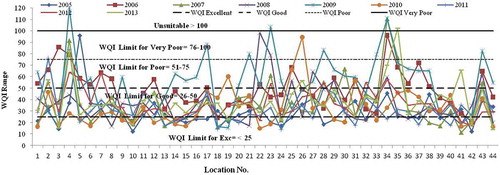
Figure 3(b) and Table (a) reveal that according WQI2 water of well no. 34 is unfit for drinking purposes because WQI2 index is sum of normalized values of individual groundwater parameters therefore most of time WQI values close to 1 or near to 1, when numerator will be near to WHO (Citation2006) and when numerator is so high with respect to denominator than WQI2 value will be so high like well no. 34 during the pre-monsoon 2007, six parameters (EC = 10400/1400, Mg2+ = 742/50, Na+ = 1380/200, Cl− = 3368/250, SO4 2− = 960/400 and TDS = 6839/1000) out of 13 parameter having high value of numerator with respect to denominator Sn, standard value of parameter according to WHO (Citation2006). Average value of WQI1 for each year comes under good (25-50) category (Table (a)) during the study periods.
Figure 3b. Graphical representation of variability in study area of groundwater samples during pre-monsoon based on WQI2.
According to Figure 3(b), some well come under unsafe drinking water category during the pre-monsoon year 2008 because this period numerator of seven (EC = 12240/1400, Ca2+ = 380/75, Mg2+ = 1021/50, Na+ = 828/200, Cl− = 4219/250, SO4 2− = 612/400 and TDS = 7341/1000) parameters were so high that why WQI2 value (66.70) is higher than 2007 WQI value (55.37). Throughout the study period (2005–2013) average value of WQI2 for each comes under excellence (< 10) category (Table (a)).
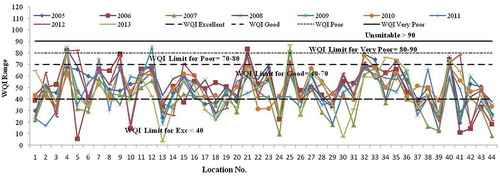
From Figure 3(c) and Table (a), most time of study period much no. of wells are found under excellence (<40) and good (40–70) category some time WQI3 hit to fourth (80–90, very poor category) category. WQI3 is basically depend on sum of concentration of Ca2+, Mg2+, Na+ and K+ parameter, and which year this sum will be lowest this year WQI3 will be highest or touch to fifth category of WQI3. During the pre-monsoon year 2005, well no. 25 show value of WQI3 above 80 because of sum of three parameters (Ca2+ (=6)+ Mg2+ (=12)+Na+ (=104) and K+(=6)) is 128 which is vey less than numerator value (104 × 100) of Equation 6, therefore ratio of numerator and denominator comes under the forth category limit (80–90, very poor, Figure 3(c) and Table (a)). Similarly, well no. 4 come under forth category during 2006, 2008, 2009, 2011, 2012 and 2013, and in these years numerator (28500, 38000, 34000, 36600, 35200 and 35200) value was so higher then denominator value (348, 457, 402, 456, 431.59 and 434.67). After post-monsoon concentration of chemicals in groundwater will likely to increase due to leaching processes. Well no. 12 and 25 are poor for irrigation point of views during 2009 and 2013 respectively, according to WQI3. Overall average value of WQI3 at each year (2005–2013) comes under good (40–70) category during the pre-monsoon (Table (a)).
Figure 3c. Graphical representation of variability in study area of groundwater samples during pre-monsoon based on WQI3.
Variability of groundwater based on WQI1
The nine year the pre-monsoon average WQI1 of 44 wells are interpolated and resultant as a distributed WQI1 map represent by Figure 4(a)-A. Figure 4(a) (A), reveal that most part of study area comes under the second category (good class) which is illustrated in map by light green colour. Figure 4(a)-A clearly indicated that after 25–50 range 50–70 range (forth class of WQI1 or permissible class) is dominate in study area which is illustrated by yellow colour patches. Blue or excellent class area in study area is very small in compare of yellow that mean during study period (2005–2013) less amount of excellent category was available in study area. Interpolated map of WQI1 (Figure 4(a)-A) during study period, reveal that few area of study area are comes under groundwater polluted area. Maximum and minimum average value of WQI1 during years 2005–2013 were 69.9 (under permissible limit) and 21.7 (excellent), respectively.
Figure 4a. Variability in study area of groundwater based on WQI1 (A) pre-monsoon, (B) post-monsoon (C) difference of pre-monsoon and post-monsoon. Source: Author.
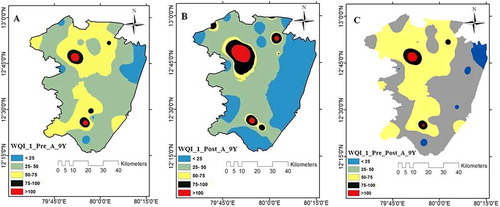
Figure 4(a) (B), represents special destitute WQI1 map of eight year (2005–2013) the pre monsoon average WQI1 for 44 wells. According to WQI1 scaling and IDW method, study area showing clear effect of rainfall factor over groundwater because during the post-monsoon Blue colour area (excellent/first class) increased and light green area (good/second class) decrease or may be merge into Blue coloured area due to dilution process by rainfall. From Figure 4(a)-A and (a)-B, clearly indicated that rainfall effect is more over yellow colour occupied area (permissible/third class). During the eight year, the post-monsoon period WQI1 average value increased for class fourth and fifth, because every time these area GW’s chemical parameter existing in higher ranges from WHO (Citation2006) standard values and during rainfall leaching process is much from leather factory (near of big black patch).
Figure 4(a)-C represents net effect of average WQI1 the pre and the post-monsoon of year 2005–2013. Figure 4(a)-C, reveal that due to net effect over excellence category of groundwater is almost vanish or may be due to net chemical concentration effect Blue colour patch converted/merge into third category (or yellow color patches). Net yellow colours patch (permissible/third class) area are more in compare to average pre and the post-monsoon WQI1, this is indication of great changes in first category due to more pollution/contamination of GW. Second category area almost reaming constant but very poor (fourth) and unfit (fifth) category become reduces in compare of Figure 4(a)-A and (a)-B. Over all according WQI1 scaling, study area wells water can be use for drinking before some degree of treatment.
Variability of groundwater based on WQI2
The map (Figure 4(b)-A) is average of nine years the pre-monsoon WQI2 for study area. Figure 4(b)-A, clearly indicates that during last nine the pre-monsoon year most part of study area come under second category of WQI2. According to WQI2 scaling ways study area existing good area of Blue patch (or excellent category). WQI2 is not capable to pick or representing accurately third, fourth, and fifth category of water because this method is based on normalization process, after normalization it is very rear for any well to achieve third fourth and fifth category.
Figure 4b. Variability in study area of groundwater based on WQI2 (A) pre-monsoon, (B) post-monsoon (C) difference of pre-monsoon and post-monsoon. Source: Author.
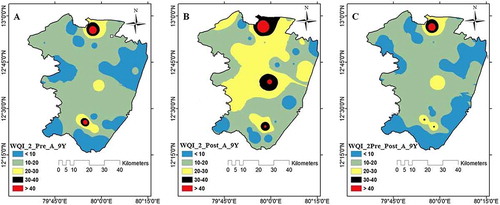
The map of WQI2 for the post-monsoon eight years average (Figure 4(b)-B) is indicating third category of WQI2 is increased while first category of WQI2 in decreasing mod with respect to Figure 4(b)-A. Second category of WQI2 is almost remaining constant which is reveal that some part of Blue colour shifted toward second class. From observation of Figure 4(b)–(C), we can conclude that due to rainfall, leaching process is high in study area therefore nominator of Equation Equation4(4) , is become so higher than dominator (S
n
) which give higher value of WQI2 during post monsoon and this reason also explain to redaction in Blue colour patch in study area during post-monsoon.
Figure 4(b)-C it can be conclude that by averaging process of (pre–post-monsoon) full time series data sets (2005–2013) for calculating WQI2, mathematically chemical concentration are rearrange such a ways that they reduces effect of high concentration values therefore Figure 4(b)–(C) shows large area of second category (or light green patches). Figure 4(b)–(C) reveal average effect of the pre- and the post-monsoon reduces the permissible category in to good category. Over all WQI2 having capability to show/pick leaching process during the post-monsoon because WQI2 give more importance to individual contamination value of parameter.
Variability of groundwater based on WQI3
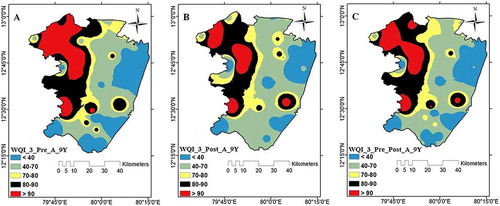
The nine year the pre-monsoon average WQI3 of 44 wells are interpolated for irrigation suitability point of views represent by Figure 4(c)-A. Figure 4(c)-A, reveal that almost 50 percent part of study area can easily found suitable groundwater (blue colour patch (or excellences category)+light green patch (or good category)) for irrigation during pre-monsoon. Figure 4(c)-A indicating study area also having a high Na% area (red patches) while this unsuitable category lies into very poor category (Fig. 4(c)-B), due to rainfall more leaching of cations (Ca2+, Mg2+, Na+ and K+) therefore dominator of Equation 5 become strong in compare of numerator its result low value of WQI3 during post-monsoon. From Figure4(c)-C, red patches (or high Na%) area increases in compare of the post-monsoon but less than the pre-monsoon due to net effect (pre + post monsoon) most part of study area easily found suitable irrigation water.
Figure 4c. Variability in study area of groundwater based on WQI3 (A) pre-monsoon, (B) post-monsoon (C) difference of pre-monsoon and post-monsoon. Source: Author.
Discussions
There is less significant differences in WQIs values were observed among the 44 sampling sites over the study year (Table (a), (b)) shows poor to medium and good and also excellent at few monitoring locations. Slight variations were observed due to seasonality.
According to the classifications for the different water uses, high values indicate that the water requires treatment before use for irrigation or other purposes. Long-term data-sets are required to confirm the environmental effect of water pollution. It should be noted that several authors have reported the polluting effect of rain and climatic conditions on the dynamics and water quality of rivers and reservoirs. The rainfall changes the overall WQI value due to dilution effect. The water which has higher value of WQI needs treatment before irrigation or other purposes.
The lowest WQI values were observed in the northern part of the study area, while the highest water quality values were found in the southern part. The water quality of any study area is notably affected by anthropogenic activities such as agricultural production, the industry, and urban growth (Singh et al., Citation2012, Citation2015). Many researchers suggested that anthropogenic activities in their study area have been responsible for changes in the groundwater quality (Singh, Tiwari, Panigary, and Mahato, Citation2013; Singh et al. Citation2015; Thakur et al., Citation2013; Thakur et al., Citation2015), sediment quality (Singh et al., Citation2017a) and surface water quality (Singh et al., Citation2017b).
Higher concentration of nitrate is observable in the rural part of the study area due to excess input of chemical or mineral fertilizer, improper manure management practices and improper operation and maintenance of septic systems (Singh et al., Citation2012). The higher value of WQI at study stations have been reported due to higher values of iron, nitrate, TDS, hardness, fluorides, bicarbonate and manganese in the groundwater (Ramakrishnaiah, Sadashivaiah, & Ranganna, Citation2009).
The calculated WQI showed fair water quality rating in post-monsoon season later it changed to medium in summer and winter seasons mainly due to human activities, soil process and climatic effects in the study area (Rajankar, Gulhane, Tambekar, Ramteke, & Wate, Citation2009). Singh et al. (Citation2016) have studied the Bhopal lake water through WQI methodology and their finding suggests that generally, pre-monsoon samples have higher pollution level due to more evaporation of lake water, input of excess of domestic waste water and less dilution.
Conclusion
Groundwater is a natural resource, the evaluation of groundwater using the long-term water quality helps in developing new strategies. This study demonstrates that the use of WQIs and GIS methods together, they could provide useful information for water quality assessment. WQIs have potential in assessing and communicating overall impacts of existing, planned, or proposed water quality interventions and management decisions. The WQIs approach helps in categorization the water based on their physiochemical parameters and provides a composite numerical value at a defined scale. The WQIs has potential for decision making and management in flag contaminate of concern, predicts potentially harmful conditions, guides prioritization management efforts and funds, assess overall impacts of water quality interventions, communicate impacts of management and policy decisions, monitor water resource and health. The WQI output numeric values at defined scale suggest the water quality status with respect to excellent to severely polluted. In this study, physicochemical parameters have been used in process of spatial and temporal pattern of WQI n for the study area. During observation we found that WQI1 is more reliable than WQI2 because for WQI1 weightage factor (W s ) will be constant always if each time chemical parameter of groundwater is constant in number while WQI1 can show variability due to individual parameter concentration. Advantage of WQI2 is scaling, it is capable to show the effect of leaching of particular (or individual) parameter. WQI3 index can be used as irrigation parameter due to its easiness. Even though the WQIs tool is quick and reliable but they do not replace analysis of detailed water quality and other environmental data. These are dependent on these detailed data to drive the algorithms behind the composite numeric values. For improved prediction of water quality the WQIs can be used together with such indices of biological integrity, in order to give a more comprehensive view of water resources health. Spatial thematic map of WQIs shows the utility of GIS technique.
Disclosure statement
No potential conflict of interest was reported by the authors.
Acknowledgements
The authors are grateful to K. Santhanam (Former Joint Director (Geology), Water Resources Division, P.W.D, Chennai) for providing water quality data-sets and thank Dr. Anil Kumar Mishra (Principal Scientists, Water Technology Centre, IARI, New Delhi) for his critical input and suggestions on the manuscript.
References
- Amin, A. , Fazal, S. , Mujtaba, A. , & Singh, S.K. (2013). Effects of land transformation on water quality of Dal Lake, Srinagar, India. Journal of the Indian Society of Remote Sensing , 42 (1), 119–128. doi:10.1007/s12524-013-0297-9
- APHA . (1998). Standard method for the examination of water and wastewater (20th ed.). Washington, DC: American Public Health Association.
- Brown, R.M. , McClelland, N.I. , Deininger, R.A. , & Tozer, R. (1970, October). A water quality index -do we dare. Water and Sewage Works , 117 , 339–343.
- Gajbhiye, S. , Meshram, C. , Singh, S.K. , Srivastava, P.K. , & Islam, T. (2016). Precipitation trend analysis of Sindh River basin, India, from 102-year record (1901-2002). Atmospheric Science Letters , 17 , 71–77.10.1002/asl.2016.17.issue-1
- Gautam, S.K. , Maharana, C. , Sharma, D. , Singh, A.K. , Tripathi, J.K. , & Singh, S.K. (2015). Evaluation of groundwater quality in the Chotanagpur plateau region of the Subarnarekha river basin, Jharkhand State, India. Sustainability of Water Quality and Ecology , 6 , 57–74. doi:10.1016/j.swaqe.2015.06.001
- Gautam, S. K. , Tziritis, E. , Singh, S. K. , Tripathi, J. K. , & Singh, A. K. (2018). Environmental monitoring of water resources with the use of PoS index: A case study from Subarnarekha River basin, India. Environmental Earth Sciences , 77 :70. doi:10.1007/s12665-018-7245-5
- Gautam, S.K. , Sharma, D. , Tripathi, J.K. , Ahirwar, S. , & Singh, S.K. (2013). A study of the effectiveness of sewage treatment plants in Delhi region. Applied Water Science , 3 (1), 57–65. doi:10.1007/s13201-012-0059-9
- Gautam, S.K. , Singh, A.K. , Tripathi, J.K. , Singh, S.K. , Srivastava, P.K. , Narsimlu, B. , & Singh, P. (2016). Appraisal of surface and groundwater of the Subarnarekha River Basin, Jharkhand, India: Using remote sensing, irrigation indices and statistical techniques. In P.K. Srivastva , P.C. Pandey , P. Kumar , & A.S.H.D. Raghubanshi (Eds.), Geospatial Technology for Water Resource Applications (pp. 144–169). Boca Raton, FL: CRC Press.
- Jacintha, T.G.A. , Rawat, K.S. , Mishra, A. , & Singh, S.K. (2016). Hydrogeochemical characterization of groundwater of Penninsular Indian region using multivariate statistical techniques. Applied Water Science , 7(6): 3001–3013. doi:10.1007/s13201-016-0400-9
- Joshi, D.M. , Kumar, A. , & Agrawal, N. (2009). Assessment of the irrigation water quality of River Ganga in Haridwar District India. J Chem , 2 (2), 285–292.
- Liou, S.M. , Lo, S.L. , & Wang, S.H. (2004). A generalized water quality index for Taiwan. Environmental Monitoring and Assessment , 96 , 35–52.10.1023/B:EMAS.0000031715.83752.a1
- Kumar, N. , Singh, S. K. , Singh, V. G. , & Dzwairo B. (2018). Investigation of impacts of land use/land cover change on water availability of Tons River Basin, Madhya Pradesh, India. Modeling Earth Systems and Environment , 1–16. doi:10.1007/s40808-018-0425-1
- Mohan, A. , Singh, R.K. , Panday, K. , Kumar, V. , & Jain, V. (2007). Assessment of water quality in industrial Zone of Moradabad: Physico-chemical parameters and water quality index. Indian Journal Environmental Protection , 27 (11), 10–31.
- Nemčić-Jurec, J. , Singh, S.K. , Jazbec, A. , Gautam, S.K. , & Kovac, I . (2017). Hydrochemical investigations of groundwater quality for drinking and irrigational purposes: Two case studies of Koprivnica-Krizˇevci County (Croatia) and district Allahabad (India). Sustainable Water Resources Management , 1–24. doi:10.1007/s40899-017-0200-x
- Pesce, S.F. , & Wunderlin, D.A. (2000). Use of water quality indices to verify the impact of Córdoba City (Argentina) on Suquía River. Water Research , 34 , 2915–2926.10.1016/S0043-1354(00)00036-1
- Rajankar, P.N. , Gulhane, S.R. , Tambekar, D.H. , Ramteke, D.S. , & Wate, S.R. (2009). Water quality assessment of groundwater resources in Nagpur Region (India) Based on WQI. E-Journal of Chemistry , 6 (3), 905–908.10.1155/2009/971242
- Ramakrishnaiah, C.R. , Sadashivaiah, C. , & Ranganna, G. (2009). Assessment of water quality index for the groundwater in Tumkur Taluk, Karnataka State, India. CODEN ECJHAO E-Journal of Chemistry. , 6 (2), 523–530.
- Rao, S.N. (2006). Seasonal variation of groundwater quality in a part of Guntur District andhra Pradesh. India. Environmental Geology , 49 , 413–429.
- Rawat, K.S. , Mishra, A.K. , & Singh, S.K. (2017a). Mapping of groundwater quality using normalized difference dispersal index of Dwarka sub-city at Delhi National Capital of India. ISH Journal of Hydraulic Engineering , 5010 , 1–12.
- Rawat, K.S. , Singh, S.K. , Jacintha, T.G.A. , Nemcˇic´-Jurec, J. , Tripathi, V.K. (2018). Appraisal of long term groundwater quality of peninsular India using water quality index and fractal dimension. Journal of Earth System Science . doi:10.1007/s12040-017-0895-y
- Rawat, K.S. , Tripathi, V.K. , & Singh, S.K. (2017b). Groundwater quality evaluation using numerical indices: A case study (Delhi, India). Sustainable Water Resources Management . 1–11. doi:10.1007/s40899-017-0181-9
- Sargaonkar, A. , & Deshpande, V. (2003). Development of an overall index of pollution for surface water based on a general classification scheme in Indian context. Environmental Monitoring and Assessment , 89 , 43–67.10.1023/A:1025886025137
- Shaki, A.A. , & Adeloye, A.J. (2006). Evaluation of quantity and quality of irrigation water at Gadowa irrigation project in Murzuq basin, southwest Libya. Agricultural Water Management , 84 , 193–201.10.1016/j.agwat.2006.01.012
- Singh, H. , Pandey, R. , Singh, S.K. , & Shukla, D.N. (2017a). Assessment of heavy metal contamination in the sediment of the River Ghaghara, a major tributary of the River Ganga in Northern India. Applied Water Science , 7(7): 4133–4149.
- Singh, S. , Singh, C. , Kumar, K. , Gupta, R. , & Mukherjee, S. (2009). Spatial-temporal monitoring of groundwater using multivariate statistical techniques in Bareilly district of Uttar Pradesh, India. Journal of Hydrology and Hydromechanics , 57 (1), 45–54.
- Singh, H. , Singh, D. , Singh, S.K. , & Shukla, D.N. (2017b). Assessment of river water quality and ecological diversity through multivariate statistical techniques, and earth observation dataset of rivers Ghaghara and Gandak, India. International Journal of River Basin Management , 5(3): 347-360. doi:10.1080/15715124.2017.1300159
- Singh, S.K. , Singh, P. , & Gautam, S.K. (2016). Appraisal of urban lake water quality through numerical index, multivariate statistics and earth observation data sets. International Journal of Environmental Science and Technology , 13 (2), 445–456. doi:10.1007/s13762-015-0850-x
- Singh, S.K. , Srivastava, P.K. , Gupta, M. , & Mukherjee, S. (2012). Modeling mineral phase change chemistry of groundwater in a rural-urban fringe. Water Science & Technology , 66 (7), 1502–1510. doi:10.2166/wst.2012.338
- Singh, S.K. , Srivastava, P.K. , & Pandey, A.C. (2013a). Fluoride contamination mapping of groundwater in Northern India integrated with geochemical indicators and GIS. Water Science and Technology: Water Supply , 13 (6), 1513–1523. doi: 10.2166/ws.2013.160
- Singh, S.K. , Srivastava, P.K. , Pandey, A.C. , & Gautam, S.K. (2013b). Integrated assessment of groundwater influenced by a confluence river system: Concurrence with remote sensing and geochemical modelling. Water Resources Management , 27 (12), 4291–4313. doi: 10.1007/s11269-013-0408-y
- Singh, S.K. , Srivastava, P.K. , Singh, D. , Han, D. , Gautam, S.K. , & Pandey, A.C. (2015). Modeling groundwater quality over a humid subtropical region using numerical indices, earth observation datasets, and X-ray diffraction technique: A case study of Allahabad district, India. Environmental Geochemistry and Health , 37 (1), 157–180. doi:10.1007/s10653-014-9638-z
- Singh, P.K ., Tiwari, A.K. , Panigary, B.P. , & Mahato, M.K. (2013). Water quality indices used for water resources vulnerability assessment using GIS technique: a review. International Journal of Earth Science and Engineering , 6(6–1), 1594–1600.
- Smith, K. (2001). Environment hazards: Assessing risk and reducing disaster (3rd ed.). (p. 324). London: Routlege.
- Srivastava, P.K. , Singh, S.K. , Gupta, M. , Thakur, J.K. , & Mukherjee, S. (2013). Modeling impact of land use change trajectories on groundwater quality using remote sensing and GIS. Environmental Engineering and Management Journal , 12 (12), 2343–2355.
- Stambuk-Giljanovik, N. (2003). Comparison of dalmatian water evaluation indices. Water Environment Research , 75 (5), 388–405.10.2175/106143003X141196
- Thakur, J.K. , Diwakar, J. , & Singh, S.K. (2015). Hydrogeochemical evaluation of groundwater of Bhaktapur Municipality, Nepal. Environmental Earth Sciences , 74 (6), 4973–4988. doi:10.1007/s12665-015-4514-4
- Thakur, J.K. , Singh, P. , Singh, S.K. , & Baghel, B. (2013). Geochemical modelling of fluoride concentration in hard rock terrain of Madhya Pradesh, India. Acta Geologica Sinica – English Edition , 87 (5), 1421–1433. doi:10.1111/1755-6724.12139
- Thorne, D.W. , & Peterson, H.B. (1954). Irrigated soils . London: Constable and Company.
- Tiwari, A.K. , Lavy, M. , Amanzio, G. , & De Maio, M . (2017). Identification of artificial groundwater recharging zone using a GIS-based fuzzy logic approach: a case study in a coal mine area of the Damodar Valley, India. Applied Water Science , 7 (8), 4513–4524. doi:10.1007/s13201-017-0603-8
- Tiwari, A.K. , De Maio, M. , Singh, P.K. , & Mahato, M.K. (2015). Evaluation of surface water quality by using GIS and a heavy metal pollution index (HPI) model in a coal mining area, India. Bulletin of Environmental Contamination and Toxicology , 95 , 304–310.10.1007/s00128-015-1558-9
- Tiwari, A.K. , Singh, P.K. , & Mahato, M.K. (2014) GIS-based evaluation of water quality index of groundwater resources in West Bokaro Coalfield, India. Current World Environment , 9 (3), 843–850. doi:10.12944/CWE.9.3.35
- Tiwari, A.K. , Singh, P.K. , Singh, A.K. , & De Maio, M . (2016). Estimation of heavy metal contamination in groundwater and development of a heavy metal pollution index by using GIS technique. Bulletin of Environmental Contamination and Toxicology , 96 , 508–515.10.1007/s00128-016-1750-6
- Tsegaye, T. , Sheppard, D. , Islam, K.R. , Johnson, A. , Tadesse, W. , Atalay, A. , & Marzen, L. (2006). Development of chemical index as a measure of in-stream water quality in response to land-use and land cover changes. Water, Air, and Soil pollution , 174 , 161–179.10.1007/s11270-006-9090-5
- Wilcox, L.V. (1955). Classification and use of irrigation water (pp. 1–19), Agric circ 969, Washington, DC: USDA.
- World Health Organization . (2006). Guidelines for drinking-water quality. Recommendations (Vol 1, 3rd ed.). Geneva: World Health Organization.