
Abstract
Morphometric analysis gives a quantitative description of drainage basin. The main aim of the present study is to identify the morphometric parameters of a watershed of Mula River basin, Pune district of state Maharashtra, India, and to prioritize the sub-basin. The work outlines the significance of digital elevation model for assessment of drainage pattern and extraction of relative parameters. Basin has been divided into 5 sub-watershed namely SW1 to SW5. The stream order of watershed ranges from first to sixth order and have dendritic drainage pattern means homogeneity in texture and lack of structural control. Further, each parameter has been assigned their ranks according to their value. The basin with lowest parameter value is ranked as first. It was considered as high priority for adopting conservation measure as well. The suitable locations for conservation measure structures in highly prioritized sub-watersheds were also identified for the appropriate land and water management plane. The relevance of work shows the appropriate measure structure locations for preventing the soil from getting eroded from the highly prioritized sub-watershed.
1. Introduction
Land and water both are most vital natural resources of the earth as life and various developmental activities depend on it. These resources are limited and their uses are increasing day by day due to population rise. Therefore, a need for water resources planning, conservation and better management for its sustainable use is required for sustained growth of a country like India. Watershed management plays a significant role in conservation of water and soil resources and their sustainable development. Adoption of better watershed management practices overcomes issues of drought, flood, excessive runoff, poor infiltration, soil erosion, human health, and low productive yield.
Horton (Citation1932, Citation1945) has explained the need of quantitative geomorphological analysis in management of water resource. Afterwards many geomorphologists have further developed the methods of watershed morphometry (Gregory, Citation1966; Schumm, Citation1956; Strahler, Citation1957, Citation1964). In India, many authors (Sreedevi, Subrahmanyam, & Ahmed, Citation2005; Yadav, Dubey, Szilard, & Singh, Citation2016; Yadav, Singh, Gupta, & Srivastava, Citation2014) used remote sensing and GIS tools in morphometric analysis and other (Balázs, Bíró, Gareth, Singh, & Szabó, Citation2018; Narsimlu, Gosain, Chahar, Singh, & Srivastava, Citation2015; Paudel, Thakur, Singh, & Srivastava, Citation2014; Rawat & Singh, Citation2017; Singh, Basommi, Mustak, Srivastava, & Szabo, Citation2017; Singh, Mustak, Srivastava, Szabó, & Islam, Citation2015).
Morphometric analysis is a significant tool for prioritization of sub-watersheds even without considering the soil map (Biswas, Sudhakar, & Desai, Citation1999). Morphometry is the measurement of the configuration of earth’s surface shape and dimension of its landform (Clarke, Citation1996). It gives a quantitative description of drainage basin which is very much useful in studies such as hydrologic modelling, watershed prioritization, natural resources conservation and management, and rehabilitation.
Literature review suggests that previously drainage morphometric parameters were either extracted from topographical maps or field surveys. With advent of high resolution digital elevation model (DEM), the extraction of drainage parameters from DEM gets more popularity in last three decades due to rapid, precise, updated and cost effective way of performing watershed analysis (Maathuis & Wang, Citation2006; Moore, Grayson, & Ladson, Citation1991).
Majority of researchers have derived morphometric parameters from Shuttle Radar Topographic Mission (SRTM) DEM, it works on a C-band interferometric radar configuration (Elmahdy, Marghany, & Mohamed, Citation2016; Grohmann, Riccomini, & Alves, Citation2007; Kaliraj, Chandrasekar, & Magesh, Citation2015; Khalkho et al., Citation2017; Love Kumar, Khalkho, Pandey, & Nigam, Citation2017; Nigam, Tripathi, Ambast, Love Kumar, & Khalkho, Citation2017; Szabó, Singh, & Szabó, Citation2015) and CARTOSAT DEM (Yadav et al., Citation2014, Citation2016). These satellite products provide a better way to estimate precise morphometric parameters due to high spatial resolution and sophisticated computer program for any basin in rapid ways.
Morphometric parameters of any watershed plays a crucial role in prioritization of sub-watershed, scientific literature have discussed role of morphometric parameters: watershed prioritization in the Guhiya basin, India (Khan, Gupta, & Moharana, Citation2001), check dam positioning by prioritization of micro-watershed using the Sediment Yield Index (SYI) model (Nookaratnam, Srivastava, Venkateswarao, Amminedu, & Murthy, Citation2005), computed morphometric characteristics of Lonar Nala, watershed in Akola district, Maharashtra prioritization of watershed (Moharir & Pande, Citation2014). Manju and George (Citation2014) carried out critical evaluation and assessment through the calculation of morphometric parameter of Vagamon and Peermade sub-watershed of Kerala. Rais and Javed (Citation2014) used morphometric parameters for the artificial recharge sites in Manchi Basin, Eastern Rajasthan. Yadav et al. (Citation2016) have used the remote sensing and GIS for prioritization of the sub-watersheds of agricultural dominated northern river basin of India. Prioritization of sub-watersheds based on morphometric and land use analysis (Javed, Yousuf, & Rizwan, Citation2009).
In the present study, morphometric analysis and prioritization of sub-watershed are carried out for a watershed of Mula River basin in Pune district of Maharashtra, India. Watershed morphometric parameters namely bifurcation ratio, drainage density, stream frequency, stream length, circulatory ratio, elongation ratio etc. were extracted. The objectives of the current study are (i) to extract the morphometric parameters (bifurcation ratio, stream length, density of streams, number of streams, perimeter of study area, slope and elevation difference of drainage basin) from DEM using GIS technique and (ii) to prioritize sub-watersheds primarily for groundwater potential and conservation structures.
2. Materials and methods
2.1. Description of study area
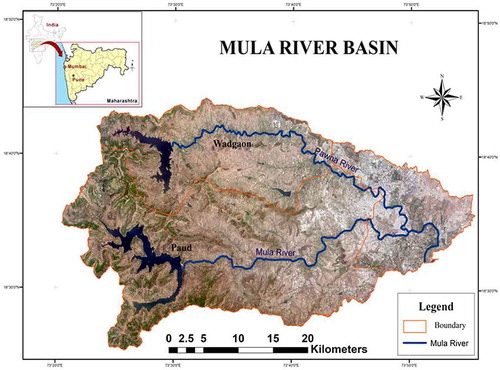
The study is conducted on Mula River Basin of Pune district covering an area of 1294.70 km2. It is east flowing river located on western ghat. The study area lies between 18°34′ and 18°33′ N latitude and 73°49′ E and 74°20′ E longitude. The river Mula is one of the sub tributary of Bhima on the Deccan Plateau. The drainage pattern of Mula River is dendritic. Pune district has a hot semi arid climate (BSn) bordering with tropical wet and dry (Aw) with average temperature ranging between 19 and 33 °C. The annual precipitation of Pune district is 722 mm which occurs mainly in monsoon season (June to September) and July is the wettest month of the year. The major crops found in this area is Jowar, wheat, bajra, sugarcane, rice, soybean, onion, groundnut, vegetables, turmeric, grape, pomegranate etc. (Figure ).
Figure 1. Location map of the study area. Source: Author.
2.2. Data-sets used
The toposheets were collected from Survey of India of scale of 1:50000. The topographical maps were georeferenced in ArcGIS software. The Shuttle Radar Topography Mission (SRTM 30 m) data were used to derive the DEM. The boundary of Mula river basin was delineated using both toposheets and DEM. The DEM data of study area were freely available and it was downloaded from (https://earthexplorer.usgs.gov/). Further, the pre-processed DEM was used for extraction and quantification of morphometric parameters.
2.3. Methodology
The SRTM DEM was used for estimation of morphometric parameter of Mula river basin such as: Bifurcation ratio (R b ), Drainage density (D d ), Stream frequency (F s ), Stream length ratio (R l ), Mean stream length (L μ ), Form factor (F f ), Elongation ratio(R e ), Circulatory ratio (R c ), Length of overland flow (L o ), Basin relief (R r ), Gradient ratio (G r ) etc. The detailed adopted methodology is expressed through flowchart (Figure ). Table explains the formulae used for quantitative determination of morphometric parameters. All the analysis was performed in the Geographical Information System environment with the aid of ArcGIS software.
Figure 2. Flowchart of used methodology.
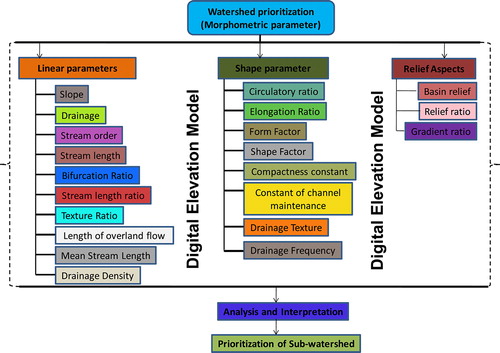
Table 1. Formulae used for computation morphometric parameters.
Prioritization rating of five sub-watershed of Mula River is carried out through ranking the computed morphological parameters. The sub-watershed with lowest ranking is given the highest priority in terms of soil erosion and less conservation measure. Groundwater condition which is assessed on the basis of groundwater map acquired from government of Maharashtra’s, India.
3. Results and discussions
The linear, shape and relief parameters have been measured and determined.
3.1. Estimation of linear parameters
3.1.1. Stream order
Stream ordering is the first step taken in any drainage basin analysis. In this work ranking of streams has been carried out based on the method proposed by Strahler (Citation1964). The Mula River is VIth order. The stream ordering, area, numbers of streams, length of stream, and total segments of the five sub-watersheds are presented in Tables and . It is observed that as stream order increases the stream number decreases. However, highest stream number was found in Ist order stream (Figure ). Watershed encompasses a dendritic drainage pattern which indicates homogenous subsurface strata means lack of structural tectonic control. Change in stream order and stream number suggests that streams are flowing from high altitude and with less lithological variations.
Table 2. Sub-watershed wise stream order with number of segments.
Table 3. Sub-watershed wise stream order with stream length.
Figure 3. Drainage map of the study area showing stream ordering. Source: Author.
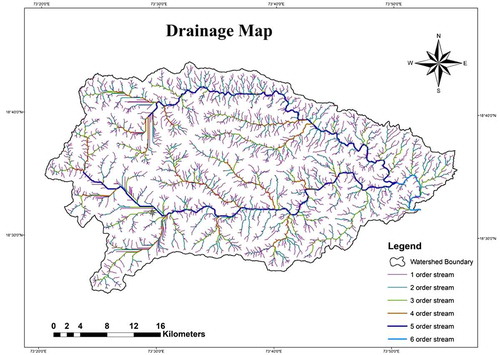
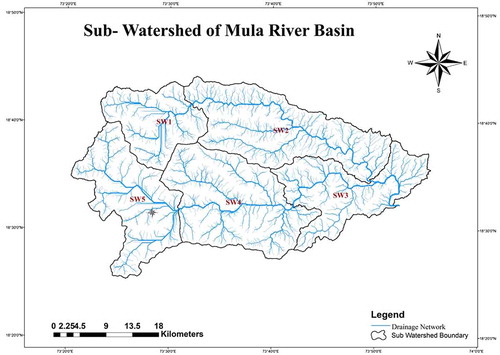
Figure 4. Sub watersheds of Mula River basin. Source: Author.
3.1.2. Stream length
Stream length is most important variable in a drainage basin. The stream length of all five sub-watersheds was calculated on the basis of law proposed by (Horton, Citation1945). Horton’s second law suggested that as stream order decreases stream length increases. It means stream length is maximum for first order stream. The total stream length of Mula River is 2190.59 km. The order wise stream length and total stream length of five sub-watersheds are expressed in (Tables and ) and (Figure ). It explains the permeability of the rock formations in a basin. This change in stream may indicate flowing of streams from high altitude, lithological variations, and moderately steep slopes.
Table 4. Sub-watershed wise stream order with mean stream length.
3.1.3. Mean stream length (L μ)
According to Strahler (Citation1964), the stream length is a characteristic property related to drainage network components of drainage basins. Generally, it shows higher the stream order, longer the length of stream and lower the stream order shorter the length of stream. The mean stream length is presented in (Table ).
3.1.4. Stream length ratio (Rl )
Stream length ratio is defined as the ratio between the mean stream lengths of one order with that of the next lower order of the stream segments. The stream length ratio between the streams of different orders of the study area does not follow any trend in different sub-watershed. This change might be attributed to the variation in slope and topography, indicating the late youth stage of geomorphic development in the streams of the study area (Vittala, Govindiah, & Honne Gowda, Citation2004). R l values of different orders and sub-watershed are presented in (Table ). The length ratio gives a general idea about the relative permeability of the rock formations in a basin.
Table 5. Stream length ratio of sub-watershed.
3.1.5. Bifurcation ratio (Rb )
Bifurcation ratio describes the branching pattern of a drainage network and is defined as ratio between the total numbers of stream segments of a given order to that of the next higher order in a basin (Schumm, Citation1956). Theoretically bifurcation ratio is 2.0 and natural drainage system has 3.0–5.0 in which geologic structures do not distort the drainage pattern (Strahler, Citation1964). The values of bifurcation ratio are presented in (Table ). If the bifurcation ratio is less it indicates plain terrain, permeable and soft bed rock where infiltrates more water makes better ground water potential zone. Lower bifurcation ratio is also due to the presence of large number of first and second order streams in the sub-basins (Kumar, Jayappa, & Deepika, Citation2011). The average bifurcation ratio for Mula river basin is 4.58 which indicates moderate to high hilly region, moderate ground slope, moderate to high run-off, and moderate permeability of bed rocks. This indicates that the drainage pattern of the basin has not been affected by the structural disturbances.
Table 6. Sub-watershed wise bifurcation ratio.
3.1.6. Drainage density (Dd )
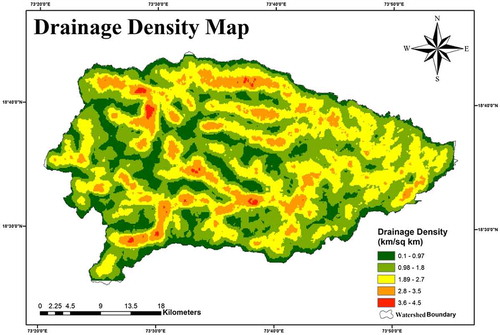
Horton, Citation1932 has introduced drainage density. It is an expression to indicate the closeness of spacing of channels. It shows landscape analysis, runoff potential, infiltration rate, climate condition, and vegetation cover. Weak or impermeable subsurface material, mountainous relief and sparse vegetation lead to high drainage density. High drainage density leads to fine drainage texture while low drainage density leads to coarse drainage texture. Generally drainage density is divided into four classes i.e., low < 2, moderate 2–4, high 4–6, very high > 6. Drainage density helps us to analyses a numerical measurement of landscapes dissection and run-off potential (Reddy, Maji, & Gajbhiye, Citation2004; Yadav et al., Citation2014). If drainage density value is nearly zero it indicates a permeable basin with high infiltration rates and high amount ground water potential. The low drainage density is likely to result in the area of highly resistant permeable subsoil material under dense vegetation and low relief (Nautiyal, Citation1994). High value indicates impermeable rocks and sparse vegetation and hilly region. Average drainage density is 1.70 which indicates moderate permeability and better vegetation cover (Figure ).
Figure 5. Drainage density of Mula River basin. Source: Author.
3.1.7. Texture ratio (T)
Texture ratio or drainage texture signifies the relative spacing of drainage lines. It is considered as the number of stream segments of all order present in per perimeter of that area (Horton, Citation1945). Drainage texture of any drainage basin depends on climate, rainfall, and rock types, relief, and stage of development (Horton, Citation1945; Smith, Citation1950). Texture is classified into four categories < 4 per km coarse, 4–10 per km intermediate, 10–15 per km fine and > 15 per km ultra fine. In the Mula river basin drainage texture ratio ranges from 0.55 to 4.50. In the sub watershed 1 and 2 have intermediate texture which indicates less infiltration and higher soil erosion (Table ).
Table 7. Morphological parameters.
3.1.8. Length of overland flow (Lo )
According to Horton (Citation1945), length of overland flow is the length of water over the ground before it gets concentrated into definite stream channels. The length of overland flow (L o ) is defined as half of the reciprocal of drainage density (Horton, Citation1945). It is one of the most important independent variables, affecting both the hydrological and physiographical developments of the drainage basin (Horton, Citation1945). Table has sub watershed wise information about the length of overland flow.
3.2. Estimation of areal parameters
3.2.1. Circulatory ratio (Rc)
Circulatory ratio is the ratio of the basin area to the area of a circle with the same perimeter (P) as the basin (Miller, Citation1953). In the given area circulatory ratio varies from 0 to 1. The circularity ratio is influenced by geological structures, climate, relief, land cover and stream length and slope of the basin. The circulatory ratio for sub watershed 0.03–0.33 which indicates youth stage of the tributaries in the basin also basin is not circular in shape and low runoff indicates enough time for infiltration of water (Table ).
3.2.2. Elongation ratio (Re)
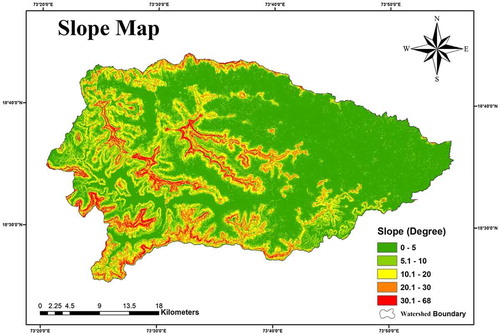
The elongation ratio is the ratio of the diameter of a circle of the same area as the drainage basin to the maximum length of the basin (Schumm, Citation1956). The higher the elongation ratio of a basin indicates active denudational process with high infiltration capacity and low runoff in the basin and lower indicates higher elevation and high headward erosion along tectonic lineaments (Reddy et al., Citation2004; Yadav et al., Citation2014). The values of the elongation ratio generally vary from 0.6 to 1.0 over a large variety of climatic and geologic types (Rudraiah, Govindaiah, & Srinivas, Citation2008). Elongation ratio varies from 0.580 to 0.607 and for Mula basin average is 0.59 which indicates that lower peak flow of longer duration, an elongated shape of the basin (Table ). Slope map shows the degree of slope (Figure ).
Figure 6. Slope map of the study area. Source: Author.
3.2.3. Form factor (Ff)
According to Horton (Citation1932), form factor (F f ) may be defined as the ratio of the basin area to square of the basin length. The form factor indicates the flow intensity of a basin for a defined area. The form factor value ranges zero to one. Smaller the value of the form factor, the more elongated shape of the basin. In this given study the form factor ranges from 0.264 to 0.290 (Table ). It shows flatter peak flow for longer duration of drainage basin, also lesser value shows elongated shape.
3.2.4. Shape factor (BS)
Shape factor means ratio of square of basin length (L 2) to the area of the basin. Shape factor of a basin helps to analyse shape irregularity of the drainage basin (Yadav et al., Citation2014). The average shape factor for Mula river basin is 3.65 (Table ).
3.2.5. Compactness constant (Cc)
It is the ratio between basin perimeters to the perimeter of a circle to the same area of the watershed (Horton, Citation1945). It derives the relationship between actual hydrologic basins to the exact circular basin having the same area as that of hydrologic basin (Table ).
3.2.6. Constant of channel maintenance (C)
The constant of channel maintenance is the inverse of drainage density (Schumm, Citation1956). Generally lower the C values of watershed indicate lower the permeability of rocks and vice versa. The average constant of channel maintenance for Mula river basin is 0.70 which indicates that moderate to high permeability, moderate slope and moderate surface runoff (Table ).
3.2.7. Drainage texture
The meaning of drainage texture is relative spacing of drainage lines (Smith, Citation1950). The term drainage texture must be used to indicate relative spacing of streams in a unit area along linear direction. Drainage texture of any drainage basin depends on climate, rainfall, vegetation, soil and rock types, infiltration rate, relief and the stage of development (Horton, Citation1945; Smith, Citation1950).
Vegetation plays important role in defining the drainage texture and density (Kale & Gupta, Citation2001). According to Smith (Citation1950) drainage basin is divided into four categories, that is coarse (< 4 per km), intermediate (4–10 per km), fine (10–15), and ultra fine (> 15 per km). Drainage texture helps to understand permeability and ground water recharge potentiality, higher the drainage texture which means higher permeability and better groundwater recharge potentiality. Mula river basin has different drainage texture in different sub watersheds (Table ).
3.2.8. Drainage frequency (Fs)
The number of streams (Nμ) in per unit area (A) is known as drainage density of the basin, if the stream frequency is high it indicates greater surface runoff and steep ground surface (Horton, Citation1932; Rao, Citation2009; Yadav et al., Citation2014). In this study area drainage frequencies are different for different sub watersheds. In the sub watershed number 1 and 4 have more than 2 per km2. For entire basin it is more than 1.5 per km2, it indicates moderate permeability and moderate soil erosion (Table ).
3.3. Estimation of relief aspects
3.3.1. Basin relief (R)
Basin relief is the actual difference between highest and lowest points of the drainage basin. It is one of the morphometric parameters which helps to understand denudational characteristics of the basin also it controls the stream gradient and influence the surface runoff and sediment also. The lowest pint is 550 m, and highest point is 1241 m and moderate slope and moderate runoff.
3.3.2. Relief ratio (Rr)
Relief ratio is the ratio between the basin relief and basin length. It is actually influenced by rocks and slope of the basin. If the values of relief ratio are high it indicates hilly region and low ratio indicates pediplain and valley region (Kumar et al., Citation2011). Relief ratio for the Mula river basin is different for various for sub watershed 1 to 5 are 27.43, 17.79, 15.25, 19.40 and 19.34, respectively. Relief ratio helps to understand where to establish settlement and afforestation also for agricultural opportunities.
3.3.3. Gradient ratio (Gr )
It is the ratio of difference between source and mouth elevation of major stream of basin to maximum length of major stream of that basin. The gradient ratio of Mula river basin is 0.43 m/km, it indicates that height decrease 0.43 m per km along the valley. If the gradient ratio is high it indicates steep slope and high runoff and low value indicates gentle slope and less surface runoff and good possibility of infiltration.
4. Prioritization of Sub-watershed for groundwater prospect
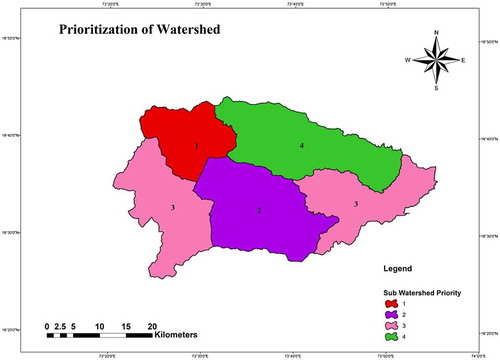
The analyses of morphometric parameters are significant in identifying and determining the zones of groundwater potentialities and areas of high erosion risk (Yadav et al., Citation2016). Prioritization of five sub-watershed has been done to identify the zone having high soil erosion activity so that with the time proper conservation measures can be taken for checking the soil erosion in that particular area. The parameter of all five sub-watersheds is calculated and priority ranking is presented in Table . The Final prioritized map of the study area showing different sub-watershed with their priority ranking is explain in Figure .
Table 8. Estimated compound parameter with priority ranking.
Figure 7. Map showing prioritized sub-watershed with their ranks. Source: Author.
5. Suitable sites for conservation measure structures
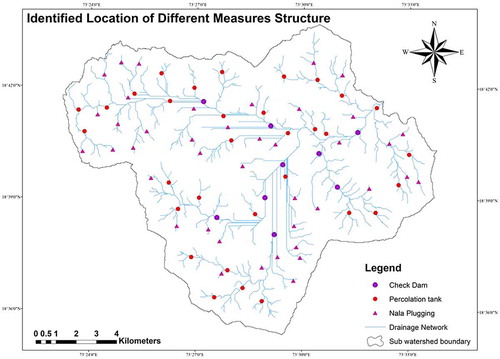
Remote sensing and GIS techniques proved to be highly beneficial while attempting prioritization of river basin and found to be suitable for identification of suitable locations for conservation measure structures in highly prioritized sub-watersheds. The drainage map and slope map were prepared. The most critical sub-watershed (SW1) was found through the morphological parameters analysis. Total 79 conservation measure structures sites was suggested in sub-watershed SW1, out of these 40 sites for nala plugging, 30 sites for percolation tank and 9 sites for the check dam was found to be suitable for the proper management practices (Figure ). These studies are extremely essential for the implementation of soil erosion prevention practices as well as land and soil management practices.
Figure 8. Identify location of different measures structures of SW1. Source: Author.
6. Conclusion
In this study, it shows that morphometric parameters are good option to evaluate higher, lower soil erosion and deficit and surplus zones of groundwater for the Mula River basin. In this study area watershed prioritization showed that SW 1 gets maximum priority for the higher soil erosion and most deficit zone of groundwater. Sub watersheds (SW 4) have moderate soil erosion and groundwater condition. The sub-watershed SW2, SW3 and SW 5 has less soil erosion prone area and is good in groundwater condition means have good availability of groundwater. Drainage density of Mula river basin shows moderate permeability of rocks and in higher altitude areas have high drainage density. High stream frequency in the SW 1, SW 2 and SW 4 of > 2 /km2 shows steep slopes, less infiltration, and hilly regions and poor groundwater condition and high erosion. SW 3 and SW 5 have moderate groundwater condition and moderate erosion. SW 1 and SW 5 natural drainage is controlled by relief. On the basis of priority and weighted sum analysis the possible locations of 79 conservation measures structure was proposed in the prioritized sub-watershed (SW1). In future work the coupling of morphometric parameters with the multicriteria decision-making will be carried out.
Disclosure statement
No potential conflict of interest was reported by the authors.
References
- Balázs, B. , Bíró, T. , Gareth, Dyke , Singh, S.K. , & Szabó, S. (2018). Extracting water-related features using reflectance data and principal component analysis of Landsat images. Hydrological Sciences Journal . 63 (2): 269–284. doi:10.1080/02626667.2018.1425802
- Biswas, S. , Sudhakar, S. , & Desai, V.R. (1999). Prioritisation of subwatersheds based on morphometric analysis of drainage basin: A remote sensing and GIS approach. Journal of Indian Society of Remote Sensing , 27 (3), 155166.
- Clarke, J.I. (1996). Morphometry from maps. Essays in geomorphology (pp. 235–274). New York, NY : Elsevier publication. Co.
- Elmahdy, S.I. , Marghany, M.M. , & Mohamed, M.M. (2016). Application of a weighted spatial probability model in GIS to analyse landslides in Penang Island, Malaysia. Geomat Nat Hazards Risk , 7 , 345–359. doi:10.1080/19475705.2014.904825
- Gregory, K.J. (1966). Dry valley and the composition of the drainage net. Journal of Hydrology , 4 , 327–340.
- Grohmann, C.H. , Riccomini, C. , & Alves, F.M. (2007). SRTM-based morphotectonic analysis of the Poços de Caldas Alkaline Massif, southeastern Brazil. Computers & Geoscience , 33 , 10–19.
- Hadley, R. & Schumm, S. (1961). Sediment sources and drainage basin characteristics in upper Cheyenne river basin. US Geological Survey Water-supply Paper. , 1531 , 198.
- Horton, R.E. (1932). Drainage basin characteristics. Transactions American Geophysical Union , 13 , 350–361.
- Horton, R.E. (1945). Erosional development of streams and their drainage basins: Hydrophysical approach to quantitative morphology. Bulletin of the Geological Society of America , 56 , 275–370.
- Javed, A. , Yousuf, M. , & Rizwan, K. (2009). Prioritization of sub-watersheds based on morphometric and land use analysis using remote sensing and GIS techniques. Journal of the Indian Society of Remote Sensing , 37 , 261–274. doi:10.1007/s12524-009-0016-8
- Kale, V.S. & Gupta, A. (2001). Introduction to geomorphology . New Delhi: Orient Longman.
- Kaliraj, S. , Chandrasekar, N. , Magesh, N.S. (2015). Morphometric analysis of the River Thamirabarani sub-basin in Kanyakumari district, South west coast of Tamil Nadu, India, using remote sensing and GIS. Environmental Earth Sciences , 73 , 7375–7401. doi:10.1007/s12665-014-3914-1
- Khalkho, D. , Tripath, M.P. , Patel, S. , Pandey, V.K. , Nigam, G.K. , & Kumar Love . (2017). Geospatial techniques for prioritization of sub-watersheds of hamp watershed of upper Mahanadi Basin using morphometric analysis. Trends in Biosciences , 10 (15), Print : ISSN 0974-8431, 2705-2713, 2017.
- Khan, M.A. , Gupta, V.P. , & Moharana, P.C. (2001). Watershed prioritization using remote sensing and geographical information system: A case study from Guhiya, India. Journal of Arid Environments , 49 , 465475.
- Kumar, A. , Jayappa, K. , & Deepika, B. (2011). Prioritization of sub-basins based on geomorphology and morphometric analysis using remote sensing and geographic information system (GIS) techniques. Geocarto International , 26 , 569–592. doi:10.1080/10106049.2011.606925
- Love Kumar, Khalkho, D. , Pandey, V.K. , Nigam, G.K. , & Yatnesh, B. (2017). Site suitability analysis of water storage structures using remote sensing & GIS for a small watershed of Lormi block in Mungeli district, Chhattisgarh State. IJABR , 7 (3), 495–503.
- Manju, E.K. & George, A.V. (2014). A comparative study of the Morphometric Analysis of High land sub-watersheds of Meenachil and Pamba Rivers of Kerala, Western Ghats, South India. International Journal of Innovation and Scientific Research , 11 (2), 527–532.
- Maathuis, B.H.P. & Wang, L. (2006). Digital elevation model based hydro-processing. Geocarto International , 21 (1), 21–26.
- Miller, V.C . (1953). A quantitative geomorphic study of drainage basin characteristics in the Clinch mountain area Virginia and Tennessee ( Proj. NR 389-402, Technical Report 3). New York, NY : Department of Geology, ONR, Columbia University, Virginia and Tennessee.
- Moharir, K.N. , & Pande, C.B. (2014). Analysis of morphometric parameters using remote-sensing and GIS techniques in the lonar nala in akola district Maharashtra India. International Journal for Technological Research in Engineering , 1 (10), 1034–1040.
- Moore, I.D. , Grayson, R.B. , & Ladson, A.R. (1991). Digital terrain modelling: A review of hydrological, geomorphological, and biological applications. Hydrological Processes , 5 (1), 3–30.
- Narsimlu, B. , Gosain, A.K. , Chahar, B.R. , Singh, S.K. , & Srivastava, P.K. (2015). SWAT model calibration and uncertainty analysis for streamflow prediction in the Kunwari River Basin, India, using Sequential Uncertainty Fitting. Environmental Processes , 2 , 79–95.
- Nautiyal, M.D. (1994). Morphometric analysis of drainage basin, district Dehradun, Uttar Pradesh. Journal of the Indian Society of Remote Sensing , 22 , 252–262.
- Nigam, G.K. , Tripathi, M.P. , Ambast, S.K. , Love Kumar, & Khalkho, D. (2017). Morphometric analysis of drainage basin using aerial photographs: A case of Karun watershed of Seonath sub-basin of Chhattisgarh. IJABR , 7 (3), 623–629.
- Nookaratnam, K. , Srivastava, Y.K. , Venkateswarao, V. , Amminedu, E. , & Murthy, K.S.R. (2005). Check dam positioning by prioritization of microwatersheds using SYI model and morphometric analysis – Remote sensing and GIS perspective. Journal of the Indian Society of Remote Sensing , 33 (1), 2528.
- Paudel, D. , Thakur, J.K. , Singh, S.K. , & Srivastava, P.K. (2014). Soil characterization based on land cover heterogeneity over a tropical landscape: An integrated approach using earth observation data-sets. Geocarto International , 30 (2), 218–241. doi:10.1080/10106049.2014.905639
- Rais, S. , & Javed, A. (2014). Identification of artificial recharge sites in Manchi basin, Eastern Rajasthan (India) using remote sensing and GIS techniques. Journal of Geographic Information System , 6 , 162–175.
- Rao, N.S. (2009). A numerical scheme for groundwater development in a watershed basin of basement terrain: A case study from India. Hydrogeology Journal , 17 , 379–396.
- Rawat, K.S. , & Singh, S.K. (2017). Estimation of surface runoff from semi-arid ungauged agricultural watershed using SCS-CN method and earth observation data sets. Water Conservation Science and Engineering , 1 , 233–247.
- Reddy, G.P.O. , Maji, A.K. , & Gajbhiye, K.S. (2004). Drainage morphometry and its influence on landform characteristics in a basaltic terrain, Central India – A remote sensing and GIS approach. International Journal of Applied Earth Observation and Geoinformation , 6 , 1–16.
- Rudraiah, M. , Govindaiah, S. , & Srinivas, V.S. (2008). Morphometry using remote sensing and GIS techniques in the sub-basins of Kagna river basin, Gulburga district, Karnataka, India. Journal of Indian Society of Remote Sensing , 36 , 351–360.
- Schumm, S.A. (1956). Evolution of drainage systems and slopes in badlands at Perth Amboy, New Jersey. Geological Society of America Bulletin , 67 , 597–646.
- Singh, S.K. , Basommi, B.P. , Mustak, S.K. , Srivastava, P.K. , & Szabo, S. (2017). Modelling of land use land cover change using earth observation data-sets of Tons River Basin, Madhya Pradesh, India. Geocarto International , 1–21. doi:10.1080/10106049.2017.1343390
- Singh, S.K. , Mustak, S. , Srivastava, P.K. , Szabó, S. , & Islam, T. (2015). Predicting spatial and decadal LULC changes through Cellular Automata Markov Chain Models using Earth Observation Datasets and Geo-information. Environmental Processes , 2 (1), 61–78.
- Smith, K.G. (1950). Standards for grading texture of erosional topography. American Journal of Science , 248 , 655–668.
- Sreedevi, P. , Subrahmanyam, K. , & Ahmed, S. (2005). The significance of morphometric analysis for obtaining groundwater potential zones in a structurally controlled terrain. Environmental Geology , 47 , 412–420.
- Strahler, A.N. (1957). Quantitative analysis of watershed geomorphology. Transactions American. Geophysical Union , 38 , 913–920.
- Strahler, A.N. (1964). Quantitative geomorphology of drainage basins and channel networks. In V.T. Chow (Ed.), Handbook of applied hydrology (pp. 39–76). New York, NY : McGraw Hill.
- Szabó, G. , Singh, S.K. , & Szabó, S. (2015). Slope angle and aspect as influencing factors on the accuracy of the SRTM and the ASTER GDEM databases. Physics and Chemistry of the Earth, Parts A/B/C. , 83–84 , 137–145.
- Vittala, S.S. , Govindiah, S. , & Honne Gowda, H. (2004). Morphometric analysis of sub-watersheds in the pawagada area of Tumkur district, South India, using remote sensing and GIS techniques. Journal of the Indian Society of Remote Sensing , 32 , 351–362.
- Yadav, S.K. , Singh, S.K. , Gupta, M. , & Srivastava, P.K. (2014). Morphometric analysis of Upper Tons basin from Northern Foreland of Peninsular India using CARTOSAT satellite and GIS. Geocarto International , 29 (8), 895–914.
- Yadav, S.K. , Dubey, A. , Szilard, S. , & Singh, S.K. (2016). Prioritization of sub-watersheds based on earth observation data of agricultural dominated northern river basin of India. Geocarto International . 33 (4), 339–356. doi:10.1080/10106049.2016.1265592