
ABSTRACT
These processes often attenuate the hazardous effects of these wastes, which may otherwise obviously manifest on the vegetation, soil, and water resources of an area. This research aims to determine the degree of environmental friendliness of drilling wastes generated from X-Gas Field, using results of physiochemical analysis in comparison with regulatory limits set by the Department of Petroleum Resources (DPR)/Federal Ministry of Environment (FMEnv). A total of 38 water samples were collected from the drilling, cuttings, mud, and waste pit. The results reveal the concentrations of total dissolved solids (TDS), salinity, total suspended solids (TSS), Biochemical Oxygen Demand (BOD), Chemical Oxygen Demand (COD), Pb, and Fe3+ above standard desirable limits stipulated by DPR and/or FMEnv. The high values of TDS, salinity, TSS, BOD, COD, Fe3+, and Pb indicate pollution from drilling wastes such as waste lubricant, spent bulk chemicals, contaminated water, and oil-based mud. Results of physicochemical analysis carried out on samples from drilling point, waste pit, and ash after thermal desorption process show that these elements are made less harmful and hence fit for disposal, reuse, or recycle. The statistical correlation and distribution of the ions show that EC, TSS and Cr3+, turbidity, total hydrocarbon content, BOD, COD, Zn2+, Cu2+, and Hg2+ have positive correlation indicating that the ions are derived from the same source.
1. Introduction
Previously, waste materials generated from various activities related to oil and gas exploration, production, storage, and transportation were regarded as useless, unwanted, and unusable and therefore were usually discarded. With recent developments in recycling and resource recovery technologies, the concept of waste management has changed. Materials previously regarded as useless and unwanted are now treated and reprocessed into various valuable or safer products. Drilling wastes are wastes generated during drilling of oil, gas, or water; and they are classified as used drilling fluids and drill cuttings (DCs). Drilling fluids (muds) lubricate and cool the bits, aid in lifting the drilling cuttings to the surface, control the formation pressures, and allow good drilling performance (Cordah, Citation1998; Davies & Kingston, Citation1992). The fluid phase of drilling mud can be water or mixture of natural oils, air, and gas (Onwukwe & Nwakaudu, Citation2012).
Drilling wastes make up to the second largest of the total volume of wastes generated by the exploration and production industry aside produced water (DOE, Citation1999; Haut, Rogers, McDole, Burnett, & Olatubi, Citation2007). Onshore operations have a wider range of management options than offshore operations. Proper management of drilling wastes should be considered especially in the areas where its toxic constituents could easily leach into the soil, surface, and groundwater systems. The pollution associated with drilling fluid wastes are caused by biocides, oil, completion or stimulation fluid components, corrosion inhibitors, reservoir fluids, and chemical component of drilling fluids (Patin, Citation2004). Wastes generated during drilling also have potential to impact on the soil quality, health, water, and entire ecosystem negatively if not properly managed (Sherif et al., Citation2017).
Drilling waste management is a means of controlling, collection, storage, transportation, processing, and disposal of wastes generated during drilling in a safe and acceptable environment that is in context with the existing regulatory requirements. Various management options, such as land application, underground injection, thermal treatment, and biological processes, can be used for drilling wastes remediation (Furukawa, Mukai, & Ohmura, Citation2017).
Drilling waste contains organic, inorganic, and heavy elements. Organic, inorganic, and heavy elements are generally classified as the hazardous substances occurring in drilling wastes. The organic, inorganic, and heavy elements can be toxic, corrosive, reactive, carcinogenic, teratogenic, and mutagenic, among other hazards (Zhou, Guo, & Zhang, Citation2014). Drilling wastes analyses permit identification of the commonly found organic, inorganic, and heavy elements derived from waste with its origin as shown in .
Table 1. Wastes components and environmentally significant constituents from drilling activities (adopted from Bashat, Citation2002).
Several authors have carried out numerous researches elsewhere on drilling waste management and treatment processes. Examples include Thurber (Citation1992), Morillon, Vidalie, Hamzah, Suripno, and Hadinoto (Citation2002), Veil (Citation2002), Page, Greaves, Lawson, Hayes, and Boyle (Citation2003), Haut et al. (Citation2007), Aird (Citation2008), ANL (Citation2011).
In the study area, researches conducted by Tuttle, Charpentier, and Brownfield (Citation1999), Akpokodje, Etu-Efeotor, Mbeledogu, and Ekejiuba (Citation1999), Lawrence, Munday, and Bray (Citation2002), Onwukwe and Nwakaudu (Citation2012), Ekpo and Uzegbu (Citation2004) centered on drilling waste generation and management approaches, modeling of reinjected produced water and contaminants fronts in non-freshwater aquifers, acidity of soil and sediments, and regional geology, hydrology, and geophysical investigations of Niger Delta province. No serious attention has been paid to the effect of the contaminated drill wastes water bodies, human health, and the ecosystem. Okpokwasili and Nnubia (Citation1995) documents the effects of oil spill dispersants and drilling fluids on substrate specificity of marine bacteria. Ekpo and Uzegbu (Citation2004) researched on the effect of drilling additives (chrome Lignosulfonate) on Pachymelania fusca and Tympanotonus fuscatus and observed an increase in the microbial biomass with high concentration of drilling additives. The work is consistent with Enty (Citation2011) which observed that drilling wastes constituted serious environmental problems in oil-rich communities. Vincent-Akpu and Sikoki (Citation2013) carried out research on the toxicity of drilling fluid on microbial load and survival of Oreochromis niloticus fingerlings and observed an increase in fungal biomass with increase in mud concentration and decrease in bacterial biomass with increase in mud concentration. Adekomaya (Citation2014) noted that development of approximate waste management strategies for drilling waste in the Niger Delta (Nigeria) was necessary for cleaner environment. Nrior, Odokuma, and Tete (Citation2017a) assessed the ultimate biodegradation of industrial detergent used in the upstream sector of the Nigeria Petroleum Industry in freshwater, brackish, and marine waters and found that bioremediation methods could become a potent tool for improved environment. In spite of the efforts made so far in degrading industrial wastes, little information exists on the status of drilling cuttings, mud, and waste on the environment before and after treatment. Furthermore, the present research is the first to apply thermal desorption unit (TDU) processes in the treatment of drilling wastes in the study area. This research work aims to determine the degree of environmental friendliness of used – drilling cuttings, mud, and wastes generated from X-gas field in the Niger Delta, Nigeria, before and after TDU operations using results of physiochemical analysis of the drilling wastes and compared with regulatory standard set by the Department of Petroleum Resources (DPR)/Federal Ministry of Environment (FMEnv).
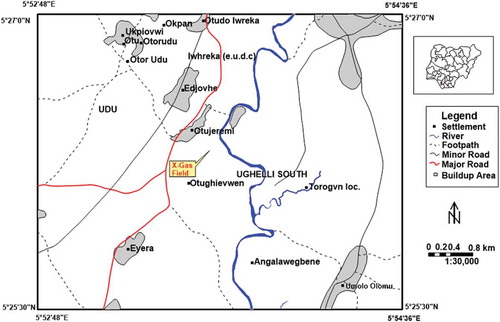
2. Location of study area (X-gas field, Niger Delta)
The study area is located within the Niger Delta area, from latitudes 5°25′30″N and 5°27′0″N and longitudes 5°52′48″E and 5°54′36″E and covers an area of about 148.06 km2 (). The X-gas field is 3.2 km northeast away from Ughelli South Local Government Headquarter. The area is characterized by swamps, which are flooded in the rainy season. Topographically, the highest elevation points are about 20 m above sea level at the northeast of the studied area, while the lowest elevation points are about 10 m above sea level, at the southern parts of the studied area. Stream network of the study area generally flows towards north–south direction and follow a dendritic drainage pattern. The area under study has two main seasons, namely the dry and wet seasons. The wet season ranges from April to October, while the dry season is from November to March. Historical records obtained from the nearest weather station indicate that the average maximum temperature for the wet season is 29.3°C. Typical of a tropical climate, the area is characterized by high rainfall (between 2480 and 3200 mm per annum). The vegetation is characterized by tropical rainforest which is mainly tall trees, shrubs, and grasses that are greenish.
Figure 1. Location map of the study area.
3. Hydrogeologic setting
The geology of Niger Delta has been discussed by many authors (Doust & Omatsola, Citation1990; Haack, Sundararaman, & Dahl, Citation1997). The three major geological formations identified in the area are (from the oldest) Akata Formation which is predominantly shale and clay, followed by Agbada Formation which is mainly fluviatile and fluviomarine of meader belt, black swamp, freshwater swamp, and Sombreior-Warri Deltaic Plain can be seen along the southeastern border of the basin, cover the central and southern parts of the basin and then (the youngest) Benin Formation, lithologically consists of continental deposit of massive, highly porous, freshwater-bearing sandstones, with local thin shale interbeds, which are considered to be of braided-stream origin and cover the northern parts of the basin as shown in . The depositional pattern of these geological formations gives rise to structural traps such as growth faults and roll-over anticlines in the Agbada Formation which houses the accumulation of petroleum reservoirs in the Niger Delta Basin (Stacher, Citation1995). The age of these geological formations ranged from Pleistocene to Pliocene.
Figure 2. Geological map of the study area.
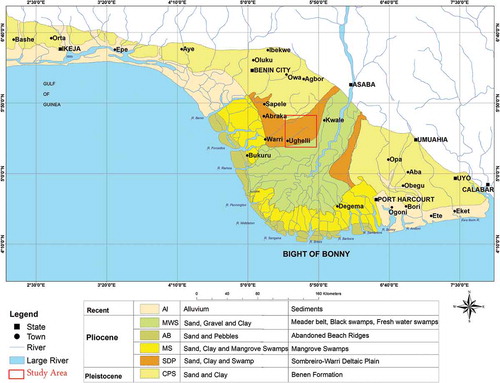
The work of Akpokodje (Citation2005) gave incite on the hydrogeological units of Niger Delta Basin in which Benin Formation which is mainly of massive, highly porous, freshwater sandstones and thin interbedded shale forms the major aquifer systems of the area. The aquifers thickness and conditions vary between unconfined conditions at surface between 0 and 20 m depth through semi-confined to confined conditions at depth above 90 m (Nwankwoala & Ngah, Citation2014). Etu-Efeotor and Akpokodje (Citation1990), Offodile (Citation2002), and Edet (Citation1993) gave the following values for the hydraulic properties: transmissivity of 228.43 m2/day, hydraulic conductivity of the range 0.103–45.024 m/day, specific capacity values ranged from 4.57 to 1555 m3/day, and specific yield ranged from 0.01 to 0.073. Groundwater flow in the study area is towards the southwest.
4. Materials and method
Drilling was carried out in the gas field using the rotary rig. In accordance with regulations of DPR and FMEnv, water-based mud and synthetic-based mud/pseudo-oil-based mud and brine were used for shallow depth (0–8000 ft) and deeper depths, respectively.
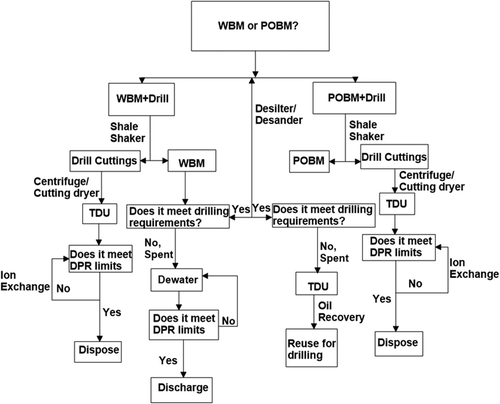
4.1. Treatment process of DCs and DM
The first step was to separate the cuttings from the drilling fluid at the shale shaker. Top-hole cuttings drilled with Water Based Mud (WBM) and bottom-hole cuttings (drilled and contaminated with pseudo-oil-based mud, POBM) were passed through the high gravity shakers (centrifuge) and cutting dryers to extract more attached drilling mud. The dried cuttings were then fluidized and incinerated at the TDU before they were reinjected into a reinjection well if they meet the regulatory limit for disposal. The cuttings were further treated for heavy metals where necessary using the ion exchanger equipment.
After separation, the unspent drilling mud was reused for drilling but was first channeled through the desander and desilter to remove smaller DCs particles that may affect the drilling process. The cuttings were treated with cement and Geosta (sodium silicate) to restore them to their initial status.
Treatment of the drilling mud starts with dewatering the water-based mud at the dewatering treatment plant onsite. The spent WBM was passed through active carbon and filters (carbon and silica) to decolorize and remove contaminants after which it was passed through alum, lime, and polymer for coagulation, pH control, and flocculation, respectively. This process is called coagulation and flocculation of the drilling mud. The resultant clean water was discharged into the environment after carrying out necessary physicochemical analysis to ensure they meet regulatory limit for discharge. The used POBM has its rheological properties for drilling intact; hence, it is properly stored for drilling other wells, while the spent POBM was taken to the TDU for thermal treatment.
The following materials were also used onsite for the drilling exercise: shale shakers, desander, cutting dryer, centrifuges, desilter, storage skips/tanks, and de-watering systems, as shown in –. These materials were put in place for drilling to take place by the oil company carrying out the project in compliance with DPR regulations for drilling activities for oil companies.
Figure 3. Arrows showing solid control units on drilling site.
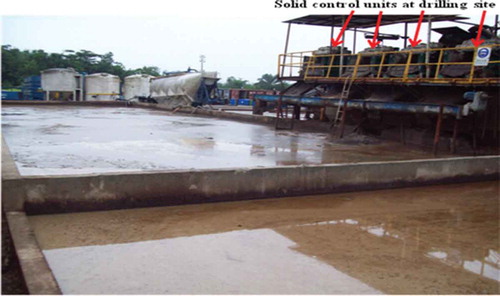
Figure 4. Flocculation unit of the dewatering system.
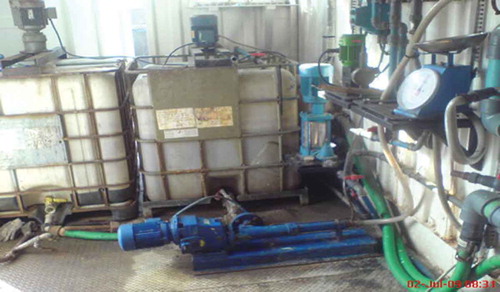
Figure 5. Coagulation unit of dewatering system.
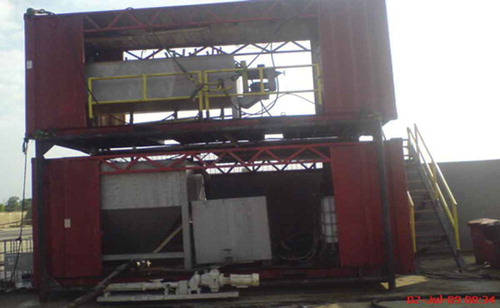
Figure 6. Flow chart of drilling waste management in X-Gas Field, Niger Delta Nigeria.
4.2. Collection of samples
A total of 38 samples were collected from the X-gas field for the purpose of this research. Thirteen samples were acquired from DCs and drill mud (DM) at different depths while 12 samples were obtained from drilling wastes pit. Each sample was collected in 1 l clean plastic containers by dipping the sampling containers into the drilling waste pit at various sampling points. The containers were flushed several times with the water to be sampled and then filled and tightly closed, leaving only a small air bubble below the stopper. The samples were carefully labeled, well preserved, and sent to the laboratory for chemical analysis. In-situ measurements of pH, EC, total dissolved solids (TDS), and DO were carried out at the field using portable digital pH meter, Hach Conductivity, TDS meter, model CO150, and DO meter Orion model 830 which has a sensitivity of 0.01 mg/l and calibrated with Winkler reagents A and B.
The samples sent to the laboratory were tested for COD, BOD, total suspended solids (TSS), total hydrocarbon content (THC), and heavy metals. The heavy metals were determined using Buck Model 210/211 AAS 220GF graphite Furnance and 220 AS autosampler. BOD content was determined by Colorimetric using ascorbic acid molybdate blue method with Colorimeter (model spectro 20D plus spectrophotometer). THC, TSS, and COD were determined by titrimetric method using the relevant reagents. All measured parameters followed standard analytical procedures recommended by DPR/FMEnv guidelines (Citation2002).
5. Results and discussion
and show results of heavy metals analysis of DCs and DM at different drilling depths. shows results of geochemical analysis of drilling waste pit in respect of some selected physical parameters and heavy metals while shows results of analysis on sample after TDU operation. The results were compared with guideline of DPR/FMEnv (Citation2002) to enable qualitative and quantitative assessment of the waste.
Table 2. Physiochemical analysis of drill cuttings at drilling point.
Table 3. Physiochemical analysis of drilling mud at drilling point.
Table 4. Physiochemical analysis of waste from waste pit.
Table 5. Results of analysis on sample after TDU operation.
5.1. Heavy metals analysis of DCs and DM at different drilled depths
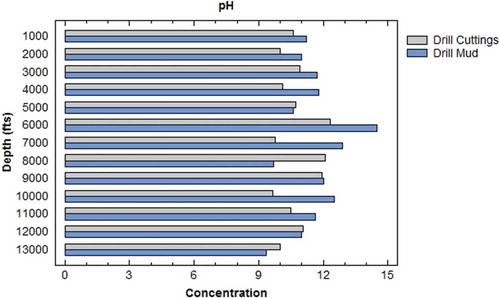
pH values ranged from 9.67 to 12.5 with an average of 10.74 in the DC and 9.35 to 12.9 in the DM as shown in . Sample at depths of 11,000 and 7000 ft in both DC and DM recorded the highest value of 12.5 and 12.9, respectively (). In addition, the results exceeded the standard acceptable levels of DRP/FMEnv. The elevated concentrations of pH in the DCs and DM are caused by the use of cement and caustic soda in the drilling mud.
Figure 7. pH concentration in the drill cuttings and mud.
Copper (Cu2+) showed different values between 6.58 and 20.79 (mg/l) with an average of 14.38 (mg/l) in the DCs whereas, 4.43–15.6 is observed in the DM as shown in ). Sample collected at depths of 3000 and 4000 ft in both DC and DM recorded the highest value of 20.79 (mg/l) and 15.6 (mg/l), respectively. In addition, the results exceeded the standard acceptable levels of DRP/FMEnv. The anomalous concentrations of Cu2+ in the DCs and DM are attributed to the drilling mud composition and its availability in the subsurface.
Figure 8. Copper, lead, and nickel concentrations in the drill cuttings and mud.
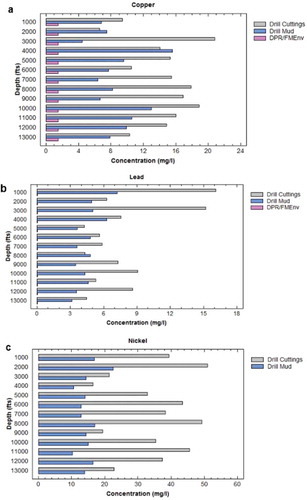
Lead (Pb+) in the drill cuttings analyzed ranged 4.29–16.1 mg/l with average of 7.69 mg/l and 3.14–7.22 mg/l in the DM with an average of 4.57 mg/l. Highest values of 16.1 and 7.22 mg/l were measured from both DCs and DM at depth of 1000 ft ()). The DRP/FMEnv guideline value for lead shows (0.05 mg/l) and this indicates that Pb has reached pollution level in the study area. High value of lead in the area is attributed to the drilling mud composition and its availability in the subsurface. Lead can also be from dissolution of iron or manganese oxides or from weathering of pyrite (iron sulfide).
Nickel (Ni+) concentration in DCs ranges from 16.5 to 50.9 mg/l with an average of 34.79 mg/l. In DM, Ni+ varies from 10.3 to 22.5 mg/l with an average of 14.70 mg/l ()). No guideline value is recommended for nickel by DPR/FMEnv.
Iron (Fe2+) values varied between 10.4 and 19.81 mg/l with an average 15.78 mg/l in the DCs. Sample analyzed at depth of 8000 ft recorded highest Fe2+ value of 19.81 mg/l in the DCs. In a similar manner, Fe2+ values ranged from 5.57 to 16.8 mg/l with an average of 11.45 mg/l in the DM. At depth of 5000 ft, elevated value of 16.8 mg/l was measured from the DM samples. The guideline value of Fe2+ is 1 mg/l. Results show that Cd exceeded DRP/FMEnv threshold value; hence, it is a potential health risk to environment.
Vanadium (V+) concentrations of DC samples ranged between minimum 13.89 mg/l at depth of 6000 ft and maximum 28.6 mg/l at depth of 4000 ft with an average of 20.39 whereas in DM, they ranged between minimum 10.1 mg/l at depth of 2000 ft and maximum 19.11 mg/l at depth of 10,000 ft with an average 14.83 mg/l. No guideline value is recommended for vanadium by DRP/FMEnv.
Barium (Ba) concentrations ranged from 20.35 to 101.3 mg/l with an average of 60.97 mg/l in the DC and 28.35 to 106.4 mg/l with an average of 54.11 mg/l in the DM. The highest value of barium in the DCs was recorded at depth of 4000 ft. On the other hand, the maximum concentration of barium in the DM was observed at depth of 1000 ft. These values generally exceed the normal level of DRP/FMEnv which is 100 mg/l.
Chromium (Cr) concentrations of the samples were fluctuated between minimum <0.5 mg/l at depth of 1000 and 4000 ft, respectively, and maximum 5.33 mg/l at depth of 6000 ft with an average of 3.48 mg/l in the DC, whereas in the DM, they were fluctuating between minimum <0.003 mg/l at depths between 11,000 and 13,000 ft, respectively, and maximum 6.68 mg/l at depth of 2000 ft with an average of 3.59 mg/l. However, these results are within the standard allowable limit of 5 mg/l stipulated by DRP/FMEnv except the sample measured at depth of 2000 ft in the DM.
5.2. Physico-chemical of drilling waste water
Temperature in the area ranges from 30.1 to 36°C, with an average of 32.98°C. The high temperature value recorded at sample 5 could be attributed to ambient temperature at which the sample was collected. The turbidity of the samples varies between 18 and 2076 (NTU), with an average of 630.92 (NTU). DRP/FMEnv established a guideline value of 15 NTU. Based on this value, turbidity level in the area has reached pollution level.
5.2.1. pH and electrical conductivity
As indicated in , pH value in the area ranges from 6.1 to 9.1, with an average of 6.86. This indicates slightly acidic and strong alkaline water, which is believed to be due to chemicals used during drilling that changed the strong acidic nature of the water to mildly acidic. DPR/FMEnv (Citation2002) established a guideline value of 6.5–8.5 for pH. The electrical conductivity (EC), which is the measurement of concentration of ionized substances in water, in the area ranges from 907 to 27200 μS/cm with an average of 6585.17 μS/cm. There is no standard value recommended for drilling waste EC by DPR/FMEnv (Citation2002).
5.2.2. TDS and dissolved oxygen
TDS concentration in the area falls between 368 and 14610 mg/l, with an average of 3360.42 mg/l. High values of TDS indicate high degree of dissolved metal constituents in the water. For instance, drilling waste samples from sample 1, 3, 4, 5, 8, and 10 have TDS values above 2000 mg/l stipulated by DPR/FMEnv (Citation2002). Dissolved oxygen (DO) measures the amount of gaseous oxygen dissolved in an aqueous solution. The occurrence of DO shows the ability of microorganisms to biodegrade the drilling fluid and its products. In the study area, DO values ranged from 0.37 to 3.95, with an average of 1.26 mg/l. There is no standard value recommended for drilling waste DO by DPR/FMEnv (Citation2002). The high concentration of DO in the study area may be attributed to waste lubricants.
5.2.3. Salinity and total suspended solid
Salinity is a problem of coastal aquifer systems of Nigeria (Nwankwoala & Ngah, Citation2014) and its distributions in the study area range from 240 to 8875 mg/l, with an average of 2072.33 mg/l. DPR/FMEnv (Citation2002) established a guideline value of 600 mg/l ()). It implies therefore that salinity level in the study area has reached pollution level. This implies that carbonate compounds constitute major environmental hazards in the study area. TSS are significant in perceiving the contamination of water bodies by drilling waste. The acceptable limit in water is 30 mg/l. The values of TSS measured range from 25 to 2845 mg/l ()), with an average of 640.45 mg/l which is well above the standard desirable limits prescribed by DPR/FMEnv (Citation2002).
Figure 9. THC, BOD, and COD concentrations of drilling waste pit samples.
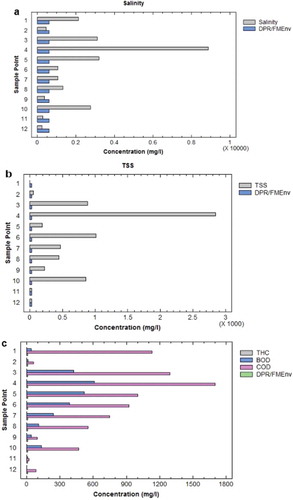
5.2.4. THC, biological oxygen demand, and chemical oxygen demand
The acceptable limit of THC in water is 10 mg/l DRP and FME. THC in the study area maintains the same concentration (0.9 mg/l) in all the measured samples, which is below the allowable limit prescribed by DPR/FMEnv (Citation2002).
Biological oxygen demand measures the amount of oxygen required by bacteria and other microorganisms to stabilize degradable matter. According to DRP and FME, drilling waste that have BOD more than 10 mg/l is environmental unfriendly. BOD values observed in sampling points were above the desirable limit. The high concentrations of BOD observed from the drilling waste pit samples explained probably that water-based mud in the decomposing pit were yet to attain stability. Chemical oxygen demand measures the amount organic matters that can be chemically oxidized. The concentrations of chemical oxygen demand in the study area varied between 23 and 1700 mg/l ()) with an average of 673.58 mg/l. The permissible limit of COD is 10 mg/l. The observed COD values in all the sample points measured are above the appropriate limit regulated by DPR/FMEnv (Citation2002). The high content of chemical oxygen demand in the samples may be due to decomposition of biodegradable wastes. Continuous dumping of waste into the waste pit will give rise to high concentrations of chemical oxygen demand.
5.2.5. Total iron and zinc
The Fe3+ content in the waste waters ranges from 0.26 to 2.73 mg/l, with an average of 1.17 mg/l. High Fe3+ values are related to formation solids and water-based muds. The level of Fe3+ recorded throughout the study area is generally higher compared to the 1 mg/l recommended by DPR/FMEnv (Citation2002). Therefore, Fe3+ in the area has reached pollution level. The zinc concentrations in water samples range from 0.22 to 0.58 mg/l with average of 0.45 mg/l. DPR/FMEnv (Citation2002) established a guideline value of 1 mg/l for Fe3+ and Zn, respectively. The Zn contents recorded for the studied samples varied from 0.22 to 0.61 mg/l with an average of 0.45 mg/l. Generally, occurrence of zinc in drilling waste is associated with water-based muds and mineral oil. Based on the guideline value, Zn concentration has not reached pollution level.
5.2.6. Lead and copper
Lead (Pb) concentration in the area falls between 0.009 and 0.66 mg/l, with an average of 0.14 mg/l. The amount of lead in the drilling waste samples depends on several factors including pH, temperature, formation solids, water-based muds, and mineral oil (Li, Lv, & Ma, Citation2011). The DPR and FME guideline value for lead shows 0.01 mg/l. Based on the guideline value, lead has reached pollution level. Copper concentrations in the drilling waste samples vary from very small to considerably large values. This ranges from 0.009 to 1.5 mg/l, with average of 1.02 mg/l. According to , Cu occurs highest in waste lubricants. The guideline value of Cu is 1.5 mg/l. Result of copper obtained is within the standard limit stipulated by DPR/FMEnv (Citation2002).
5.2.7. Arsenic, chromium, barium, and mercury
The amount of arsenic measured ranged between 0.009 and 0.66 mg/l with average of 0.3 mg/l. Occurrences of arsenic in drilling wastes are relatively associated with sources of oil-based muds cuttings. There is no standard value recommended for drilling waste arsenic by DPR/FMEnv. The guideline value of Cr regulated by DPR/FMEnv (Citation2002) is 0.003 mg/l. Chromium (Cr) concentration in the area ranged between 0.001 and 0.009 mg/l, with an average of 0.003 mg/l. Chromium is common in spent bulk chemicals such as bentonite and fluid loss reducers (Wang, Lin, & Zhang, Citation2017). DPR/FMEnv established a provisional guideline value of 0.03 mg/l; and based on this, Cr level in the study area has not reached pollution levels. Barium and mercury in the drilling waste samples may have originated from the lube oil and grease. Barium concentrations in the area fall between 0.46 and 2.5 mg/l, with an average of 1.83 mg/l. Mercury content in the study area maintains the same concentration (0.029 mg/l) in all the measured samples. There is no standard limit for barium and mercury recommended by DPR/FMEnv (Citation2002).
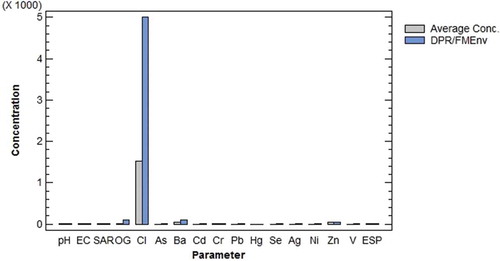
5.3. Results of analysis on sample after TDU operation
Drilling fluids (WBM) were subjected to dewatering operation (onsite) to take care of non-compliant parameters before discharge. reveals that the average analyzed samples subjected to the TDU show satisfactory compliance with DPR limits (see ).
Figure 10. Average values of analyzed parameters from X-Gas Field after TDU operations against DPR/FMEnv limit.
6. Statistical correlation analysis and distributions
Correlation analysis and distribution is used to assess the relationship between two different variables (Bahar & Reza, Citation2010). It shows how well one variable predicts the other as shown in and . Statistical correlation (r) of +1 shows that two variables are related indicating positive linear correlation, but r = −1 shows a negative linear correlation. If r = 0, it means that there is no existing relationship between two variables. Two variables having a positive correlation coefficient implies that they have a common source, whereas negative correlation coefficient indicates a different source.
and illustrate that EC, TSS, and Cr3+ show statistically high positive correlation at 95% confidence limit with turbidity, THC, BOD, COD, Zn2+, Cu2+, and Hg2+. These correlations indicate that the ions are derived from the same source. The high positive correlation between THC and BOD may represent influence of contaminated water-based mud. The high positive correlation between THC, BOD, COD, Zn2+, Cu2+, and Hg2+ may represent waste lubricant and spent bulk chemicals and the relation between Cr3+ − TSS and COD + Zn2+ may represent contributions from oil based mud cuttings.
Table 6. Correlation matrix between physico-chemical parameters.
Table 7. Correlation matrix between heavy metals.
7. Conclusion
An investigation into the chemical and heavy metal characteristics of the X-gas field drilling waste has been carried out. From the study, various drilling waste management techniques (waste minimization, dewatering, and TDU) were used to effectively manage drilling wastes generated from X-gas field. The physiochemical analysis is carried out to determine the degree of environmental friendliness of these drilling wastes when compared with regulatory limits. Attempts were also made to determine the possible causes and sources of non-compliance as well as possible contamination in the study area.
The study reveals that the water of the drilling waste is turbid; with TDS values are higher than 2000 mg/l stipulated by DPR/FMEnv. The results of DO and COD reflect the importance of the content of biodegradable wastes at the drilling waste pit which ranges from 0.37 to 3.95 and 23 to 1700 mg/l, respectively. The high values of BOD indicate the effectiveness of contaminated water-based muds of the waste waters. The analysis of total iron, zinc, lead, copper, arsenic, chromium, barium, and mercury indicate pollution from drilling wastes such as waste lubricant, spent bulk chemicals, contaminated water- and oil-based muds. The statistical correlation and distributions of the ions shows that EC, TSS and Cr3+, turbidity, THC, BOD, COD, Zn2+, Cu2+, and Hg2+ have positive correlation indicating that the ions are derived from the same source. The physiochemical and heavy metals of waste water qualities of the study area are far from the DPR/FMEnv guidelines values and are qualified to be potential pollutant that can cause environmental hazards in the study area.
Further treatment of the DCs and drilling mud using the thermal desorption technique addressed the non-compliant parameters and toxic level of drilling waste. This is confirmed by the results of physicochemical analysis of the ash from the TDU operation as they met with the required limits.
Acknowledgements
The authors hereby acknowledge the support and assistance from Research and Development Department of SPDC Nigeria for the opportunity to carry out this work.
Disclosure statement
No potential conflict of interest was reported by the authors.
References
- Adekomaya, S. O. (2014). Development of approximate waste management strategies for drilling waste-Niger Delta (Nigeria) experience. Journal Enviro Earth Scien, 4(7), 31–33.
- Aird, P. (2008). Drilling waste management technology descriptions. USDOE 2011. http://web.ead.anl.gov
- Akpokodje, E. G., (2005). Challenge of sustainable groundwater resources management in the Niger Delta. Paper presented at the National Stakeholders Workshop on joint management of shared West African Coastal Aquifer Resources, Organized by the Federal Ministry of Water Resources in collaboration with UNESCO/IHP-IAH, held at the Hotel Presidential, Port Harcourt. Nov. 21 – 22
- Akpokodje, E. G., Etu-Efeotor, J. O., Mbeledogu, I. U., & Ekejiuba, A. O. M. (1999). Modeling of re-injected produced water & contaminants fronts in non-freshwater aquifers in the coastal Eastern Niger Delta. In 23rd annu SPE (Nigeria Council) international technology conference held at Abuja Nigeria (pp. 29). Society of Petroleum Engineers.
- ANL. (2011). Drilling waste management information system. US: Argonne National Laboratory, US Department of Energy.
- Bahar, M. M., & Reza, M. S. (2010). Hydrochemical characteristics and quality assessment of shallow groundwater in a coastal area of southwest Bangladesh. Environment Earth Sciences, 61, 1065–1073.
- Bashat, H. (2002). Managing waste in exploration and production activities of the petroleum industry. Environmental Advisor, SENV. 1, 1–37
- Cordah. (1998). The Present status and effects of drill cuttings piles in the North Sea (Report No. Cordah/ODCP.004/1998). Aberdeen, UK: Cordah Environmental Consultants.
- Davies, J. M., & Kingston, P. F. (1992). Sources of environmental disturbance associated with offshore oil and gas developments. In W. J. Cairns (ed.), North sea oil and gasresource, environmental impacts and responses. Edinburgh, UK: Elsevier Science Publishers Ltd Essex.
- Department of Energy D.O.E. (1999). Environmental benefits of advanced oil and gas production technology, DOE-FE-0385. Washinton, DC: U.S. Department of Energy, Office of FossilEnergy. Retrieved from http://www.osti.gov/bridge/product.biblio.jsp?osti_id=771125.
- Department of Petroleum Resources. (2002). Environmental Guidelines and Standards for the Petroleum Industry in Nigeria (EGASPIN) (Revised ed.). Abuja, Nigeria: Author.
- Doust, H., & Omatsola, E. (1990). Niger delta. In J. D. Edwards & P. A. Santogrossi (ed.), Divergent/Passive Margin Basins (Vol. 48, pp. 201–238). Tulsa, USA: AAPG Memoir.
- Edet, A. E. (1993). Groundwater quality assessment in parts of Eastern Niger Delta. Nigeria Environmental Geology, 22(1), 41–46.
- Ekpo, A. E., & Uzegbu, M. L. (2004). The effect of the petroleum drilling mud additive (Chromelignosulphonate) on the microbiology and survival of periwinkle (Pachymelania spp. and Tympanotonus sp.). World Journal of Microbiology and Biotechnology, 20, 559–562.
- Enty., G. S., (2011). Estimation of Drilling Wastes – An Environmental Concern While Drilling Oil and Gas Wells (M.Sc Thesis). African University of Science and Technology, Abuja.
- Etu-Efeotor, J. O., & Akpokodje, E. G. (1990). Aquifer systems of the Niger Delta. Journal of Mining Geology, 26(2), 279–284.
- Furukawa, Y., Mukai, K., & Ohmura, K. (2017). Improved slant drilling well for in situ remediation of groundwater and soil at contaminated sites. Environmental Science and Pollution Research, 24, 6504–6511.
- Haack, R. C., Sundararaman, P., & Dahl, J., (1997). Niger delta petroleum system: Presented at the 1997 AAPG/ABGP Hedberg Research symposium, Rio de Janeiro, Brazil, extended abstracts
- Haut, R. C., Rogers, J. D., McDole, B. W., Burnett, D., & Olatubi, O., (2007). Minimizing Waste during Drilling Operations in Proc 2007 AADE National Technical Conference and Exhibition, Houston, Texas (pp. 10–12)
- Lawrence, S. R., Munday, S., & Bray, R. (2002). Regional geology and geophysics of the eastern Gulf of Guinea (Niger Delta to Rio Muni). The Leading Edge, 21, 1112–1117.
- Li, X. G., Lv, Y., & Ma, B. G. (2011). Influence of sintering temperature on the characteristics of shale brick containing oil well-derived drilling waste. Environental Science and Pollution Research, 18, 1617–1622.
- Morillon, A., Vidalie, J. F., Hamzah, U. S., Suripno, S., & Hadinoto, E. K. (2002). Drilling and waste management, SPE 73931. In Presented at the SPE international conference on health, safety, and the environment in oil and gas exploration and production, 2002, March 20–22.
- Nrior, R. R., Odokuma, L. O., & Tete, E. (2017a). Utimate biodegradation of Industrial detergent used in the upstream sector of the Nigeria Petroleum Industry in freshwater, Brackish and Marine water. International Journal of Ecotoxicology and Ecobiology, 2(4), 134–144.
- Nwankwoala, H. O., & Ngah, S. A. (2014). Groundwater resources of Niger Delta: Quality implications and management considerations. International Journal of Water Resources and Environmental Engineering, 6(5), 155–163.
- Offodile, M. E. (2002). Groundwater study and development in Nigeria (pp. 239 – 345). Jos, Nigeria: Mecon Engineering Services Ltd Jos Nigeria.
- Okpokwasili, G. C., & Nnubia, C. (1995). Effects of oil spill dispersants and drilling fluids on substrate specificity of marine bacteria. Waste. Manage., 7, 515–520.
- Onwukwe, S. I., & Nwakaudu, M. S. (2012). Drilling waste generation and management approach. International Journal of Environmental Science and Development, 3(3), 252–257.
- Page, P. W., Greaves, C., Lawson, R., Hayes, S., & Boyle, F. (2003). Options for the recycling of drill cuttings. In SPE 80583, SPE/EPA/DOE exploration and production environmental conference. San Antonio, TX. 2003, March 10–12.
- Patin, S. (2004). Environmental impact of the offshore oil and gas industry. New York, NY : EcoMonitorPublishing East Northport.
- Sharif, M. D., Nagalakshimi, N. V. R., Srigowri, R. S., Vasanth, G., & Sankar, K. (2017). Drilling waste management and control the effects. Journal Advance Chemical Engineers, 7, 1–9.
- Stacher, P. (1995). Present understanding of the Niger delta hydrocarbon habitat. In M. N. Oti & G. Postma (eds.), Geology of deltas (pp. 257–267). Rotterdam: A.A. Balkema.
- Thurber, N. E. (1992). Waste minimization for land-based drilling operation. Journal of Petroleum and Technology, 44, 542–547.
- Tuttle, L. W., Charpentier, R. R., & Brownfield, M. E., (1999). The Niger Delta Petroleum System: Niger Delta Province, Nigeria, Cameroon, and Equatorial Guinea, Africa: U.S. Geological Survey World Energy Project. Open-File Report, (pp 50–99).
- Veil, J. A. (2002). Drilling waste management past present and future. Proceedings of the SPE Annual Technical Conference and Exhibition, San Antonio, TX. (pp. 50–52). Richardson, TX: Society of Petroleum Engineers.
- Vincent-Akpu, I. F., & Sikoki, F. D. (2013). Toxicity of drilling fluid parateq on microbial load and survival of oreochromis niloticusFingerlings. Journal of Fisheries and Aquatic Science, 8, 218–222.
- Wang, C., Lin, X., & Zhang, C. (2017). Environmental security control of resource utilization of shale gas drilling cuttings containing heavy metals. Environmental Science and Pollution Research, 24, 21973–21983.
- Zhou, X., Guo, J., & Zhang, W. (2014). Occurrences and inventories of heavy metals and brominated flame retardents in waste from printed circuit board production. Environmental Science and Pollution Research, 21, 10294–10306.