
 ?Mathematical formulae have been encoded as MathML and are displayed in this HTML version using MathJax in order to improve their display. Uncheck the box to turn MathJax off. This feature requires Javascript. Click on a formula to zoom.
ABSTRACT
The study was conducted on cultivated land at College of Agricultural Engineering and Post Harvest Technology (CAEPHT campus), Ranipool, Gangtok, Sikkim, India. Twenty five points were identified at 10 m grid interval and field measurements were performed using double ring infiltrometer method. Result of soil analysis suggests sandy loam and loamy sand texture and the bulk density and particle density have varied from 1.412–1.716 g/cm3 and 2–3.03 g/cm3, respectively. The basic infiltration rate has varied from 0.3 cm/h to 6.8 cm/h. Result show that sand, particle density and organic carbon content have a positive correlation with infiltration rate by 0.75, 0.18 and 0.22, respectively, whereas silt, clay, bulk density and moisture content, have a negative correlation with infiltration rate by −0.41, −0.73, −0.33 and −0.22, respectively. The analysis performed for five classes considering the combination of soil properties and subjected to regression analysis. Result shows that in order to predict soil infiltration rate based on few properties of soil with seven independent variables, multi-linear regression model EIR = -30,578.81–305.56(sand%)-306.16(silt%)-0.306.33(clay%)-5.18(BD%)+.34(MC%)+4.18(PD)+16.85(OC%) with R2(0.80), mean RMSE (1.52) and standard error (2.39) is the best model for the estimation of infiltration rate and recommended for the study area.
1. Introduction
Soil and water are the vital natural resources used in the crop production system. Efficient management of water will be required a greater control of infiltration in the soil. Increased infiltration control would help to solve such wide ranging problems as upland flooding, pollution of surface and groundwaters, declining water tables, inefficient irrigation of agricultural lands, and wastage of useful water (Rashidi, Ahmadbeyki, & Hajiaghaei, Citation2014). Soil infiltration rate is the most essential process that affects the surface irrigation uniformity and efficiency because of its mechanism of transfer and distributes water from surface to soil profile (Rashidi et al., Citation2014). The measurement of infiltration of water into the soil is an important indication concerning the efficiency of irrigation and drainage, optimizing the availability of water for plants growth and metabolism, improving the yield of crops and minimizing erosion (Adeniji, Umara, Dibal, & Amali, Citation2013). Adequate knowledge of infiltration rate of a soil data is essential for reliable prediction and control of soil and water related environmental hazards. Prediction of cumulative infiltration is important for estimation of the amount of water entering and its distribution in the soil. Soil properties are one of the important parameter which governs the rate of infiltration. Design, operation, management, and hydraulic evaluation of on-farm water applications have also rely on the infiltration properties of the soil because infiltration behavior of the soil directly determines the essential variables such as inflow rate, length of run, application time, depth of percolation, and tail-water run-off in irrigation systems (Adeniji et al., Citation2013; Sarmadian and Taaghizadeh-Mehrjardi Citation2014). Martens and Frankenberger (Citation1992) have carried out the work on the modification of infiltration rates in an organic-amended irrigated soil. Soils have been amended using three loadings such as poultry manure, sewage sludge, barley straw (Hordeum vulgare L.), and alfalfa (Medicago sativa L.) to an Arlington soil (coarse loamy, mixed, thermic Haplic Durixeralf) for 2 years and found that water infiltration rates in the organic-amended soils have initially increased by stimulation of microbial activity, which has increased the stability of soil aggregates. Cerda (Citation1996) studied the infiltration rates for contrasting slope in south Spain using simulated rainfall and ponding method and suggested that the aspect, slope and vegetation cover governs the steady state infiltration rates, whereas, seasonal change plays an important role in varying infiltration rates. Fox, Bryan, and Price (Citation1997) studied influence of slope angle on final infiltration rate for inter-rill conditions. They found that infiltration rate decreased with increase in slope angle. Diamond and Shanley (Citation1998) measured the rate of infiltration using double-ring infiltrometer for freely drained, imperfectly drained and poorly drained sites of Irish during summer and winter seasons and reported that 3.5 times higher infiltration rate for summer compared to winter season. Chen-Wuing Liu, Cheng, Wen-Sheng, and Chen (Citation2003) studied the water infiltration rate in cracked paddy soil surfaces of paddy fields and found that a cracked paddy field has significantly increased rate of infiltration. Lake, Akbarzadeh, and Mehrjardi (Citation2009) developed the various pedo-transfer functions (PTFs) for Guilan Province of Iran to predict soil physico-chemical and hydrological characteristics using multi-layer perceptron (MLP), a feed forward artificial neural network (ANN) method. They found that ANN method was more accurate than multiple linear regression (MLR) method for the estimation of infiltration rate. Osuji, Okon, Chukwuma, and Nwarie (Citation2010) studied the infiltration characteristics of soil under various land use practices in Owerri, Southastern Nigeria. Joshi and Tambe (Citation2010) measured the effect of slope and grass-cover on infiltration rate, runoff and sediment yield under simulated rainfall condition in upper Pravara Basin in western India. They found the highest infiltration for grass covered area with gentle slope, and minimum for bare land surface with steep slope. They also reported that grass cover was the main factor that induced infiltration with minimum runoff, resulting to less sedimentation. Ahaneku (Citation2011) conducted study on infiltration rate under two major soils in North Central Nigeria using infiltrometer. Dagadu and Nimbalkar (Citation2012) carried out the infiltration studies of different soils under different soil conditions and compared the infiltration models with field data measured by double-ring infiltrometer. They reported that the Horton’s model, and Green-Ampt model were the best fitting to the observed field data to estimate infiltration rates at any given time with high degree of correlation coefficient and minimum degree of standard error. Hajiaghaei et al. (Citation2014) estimated the infiltration rate using double-ring infiltrometer and predicted soil infiltration rate based on silt and clay content of soil. They developed a relation between soil infiltration rate and soil properties (silt and clay content). Rashidi et al. (Citation2014) carried out a field experiments at the agricultural fields of Karaj (Iran) and developed a relation between soil infiltration rate and physical properties of soil. They predicted the infiltration rate using silt content and clay content, bulk density (BD), organic matter (OM), and moisture content (MC) of soil. Champatiray, Balmuri, Patra, and Sahoo (Citation2015) measured infiltration rate of soil using different size of single and double-ring infiltrometer. They found that double-ring infiltrometer was better than single ring infiltrometer. They also reported the infiltration rate was affected due to the cracks of plants root, movement of earth, and clay desiccation. Hence the knowledge about infiltration of water into soils is an important indication concerning the efficiency of irrigation and drainage, optimizing the availability of water for plants, improving the yield of crops, minimizing erosion, and wastage of water. A very often, double-ring infiltrometer test is used for the measurement of infiltration rate which is time consuming and laborious and practically difficult, particurally in the hilly terrain. This can be accomplished by through the development of models based on the easily measurable soil properties because soil properties influences the infiltration characteristics. In view of above, an attempt was made to predict the infiltration rate of an agricultural land located at the College of Agricultural Engineering & PHT (CAEPHT) using the PTF developed by the Multiple linear Regression Analysis (MLR) to determine the optimum soil infiltration rate model based on some physical properties of soil and to verify the model by comparing the predicted rate with the field measured rate of infiltration with the following objectives: (i) to measure the different soil properties and infiltration rate of a cultivated field; (ii) to develop the soil infiltration rate model based on soil properties and to verify the model by comparing the predicted and the field test infiltration results.
2. Materials and methods
2.1. Study area
Infiltration rates of an agricultural land located at the College of Agricultural Engineering & PHT (CAEPHT) were measured using double-ring infiltrometer test. The study area is located in CAEPHT campus, situated between 27°17.454ʹ to 27°17.508ʹ N latitude and 88°35.595ʹ to 88°35.635ʹ E longitude (). Study area is differentiated in two parts considering the elevation difference. One part of study area is located at an altitude ranging from 861 to 865 m above MSL and away from the Ranikhola river and other part is near to Ranikhola river at an altitude range of 842–848 m above MSL.The upper area is 400 m2 (40 x 10 m) and lower area is 1200 m2 (40 x 30 m). Double-ring infiltrometer tests were carried out at 20 locations within the study area. Location of each infiltration stations were marked using global positioning system (GPS) device. Details of each station such as latitude, longitude, and altitude were also recorded. The stations were marked in such a way that each station had distance of 10 m apart from each other. Location of 25 stations used in the field measurement of infiltration rate.
Figure 1. Study area map (marked).
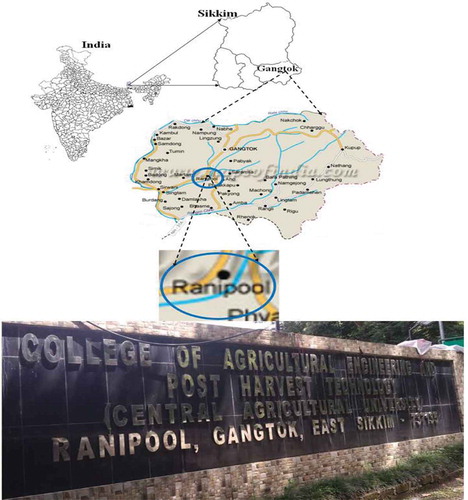
Table 1. Location of 25 stations used in the field measurement of infiltration rate.
2.2. In-situ and laboratory analysis
2.2.1 Measurement of infiltration and MC (Moisture content)
Infiltration rates were measured by using double-ring infiltrometer which consist of two concentric metal cylindrical ring, a metal rammer and measuring gauge. The diameter of inner and outer ring was 25 cm and 35 cm, respectively, and both have equal height of 25 cm each. Both the rings were placed concentric on the soil surface and was hammered into the soil uniformly using the rammer at the depth of 12 cm each.
A soil sample for estimating MC was collected nearby prior to infiltration from that station using hand screw auger at the depth of 30 cm and MC was determined using oven drying method, keeping soil samples at 150°C for 24 h. The MC was calculated by
where, MC: moisture content (%); M1: weight of dish (g); M2: weight of wet soil sample with dish (g); M3: weight of dried soil sample with dish (g).
2.2.2 Bulk density(BD)
BD of soil samples has been measured using a cylindrical core cutter of 10 cm diameter and 13 cm length. The volume and weight of core cutter was determined. Core cutter was hammered down into the soil with rammer. The weight of soil with core cutter was determined again. It was calculated by:
where, BD: bulk density (g/cm3); W₁: weight of core cutter (g); W₂: weight of core cutter and soil (g); V: volume of core cutter (cm3).
2.2.3. Particle density (PD)
PD of soil samples has been determined by using density bottle. The oven dried soil sample was screened through 200 µm sieve. Soil samples of 10 g were collected. It was determined by:
where, PD: particle density (g/cm3); M₁: weight of density bottle (g); M₂: weight of soil and density bottle (g); M₃: weight of water, soil, and density bottle (g); M₄: weight of water and density bottle (g); ρ: density of water (g/cm3).
2.2.4. Texture and organic carbon content
Texture of soil samples has been analyzed by hydrometer apparatus. Putting the hydrometer and temperature reading in the texture analysis work sheet, sand, silt, and clay percentage content was determined. The textural class of the soil sample was determined by using soil texture triangle (showing the 12 major textural classes and particle size scales as defined by the USDA).
The dried soil samples were screened through 200 µm sieve and 0.48 g was taken for further analysis. Organic carbon content of soil samples was determined by using STFR PUSA device.
3. Statistical analysis
3.1. Multiple linear regression (MLR) analysis
Regression analysis is a statistical tool of investigation of relationships between variables. When there are more than one independent variables then multiple regression analysis has been required to perform. In MLR analysis, dependent variable and independent variables are related linearly. The dependent variable is basic infiltration rate and the independent variables are Sand (SA), Silt (SI), and Sandy loam (SL), BD, PD, porosity, and organic carbon. Using all these parameters basic infiltration rate prediction model was developed using Microsoft Excel data analysis tool. The coefficient of determination was also determined to check reliability of the model.
3.1.1 Prediction model using MLR analysis
A typical multiple-variable linear regression model is expressed as follows:
Y = k + k1 × X1 + k2 × X2 + …+ kn × Xn,
where, Y = Dependent variable, for example soil infiltration rate (cm/h)
X = X1, …, Xn: Independent variables, for example sand content (%), silt content (%), clay content (%), BD (g/cm), organic content (%), and MC of soil (%); k = k1, k2, …, kn: Regression coefficients.
In order to predict soil infiltration rate, sand content, silt content, clay content, BD, porosity, OC, and MC of soil were suggested as independent variables and all the data were subjected to regression analysis using the Microsoft Excel 2010.
3.2. Root mean square error (RMSE)
The RMSE is frequently used to measure the difference between predicted value by a model or an estimator and the value actually observed. RMSE is a good measure of precision. These individual differences are called residuals, and the RMSE serves to aggregate them into a single measure of predictive power. RMSE was calculated as:
where, xi: measured value; yi: estimated value; n = number of values
3.3. Standard deviation (SD) and coefficient of variation (CV)
SD and CV are types of measures of dispersion. SD is an absolute measure and CV is a relative measure. SD and CV is calculated by:
where, xi: measured value; x’: mean of measured value; n: number of measured value.
4. Results and discusions
4.1. Soil physical properties
The soil properties were determined for each station marked at . These were considered as the independent variables which were used in the MLR for the prediction of infiltration rate and considered as the main key for analysis and development of the prediction model. The textural classes of the study area are sandy loam and loamy sand. Sandy loam texture was observed at 19 stations and loamy sand texture was observed at 6 stations.
Table 2. Physical properties collected soil samples.
presented descriptive statistics of measured soil properties. The percentage of sand, silt, and clay varies from 62.93 to 84, 7.36 to 20.25 and 5.33 to 19.07, respectively. The percent mean value of sand, silt, and clay is 74.33, 14.26, and 11.41, respectively. BD and PD varies from 1.412 to 1.716 g/cm3 and 2.0 to 3.03 g/cm3, respectively, with mean BD 1.57 g/cm3 and mean PD 2.57 g/cm3. The MC varies from 13.96% to 28.93% with mean value of 24.05%. The organic carbon content varies from 0.28% to 0.36% with mean value of 0.34%. The standard deviation for sand, silt, clay, BD, PD, MC, and organic carbon were 4.90, 3.37, 2.87, 0.08, 0.19, 3.55, and 0.018, respectively. The coefficient of variation for the sand, silt, clay, BD, PD, MC, and organic carbon are as follows: 6.60, 23.65, 25.14, 5.01, 7.55, 14.75, and 5.12, respectively. Franzluebbers (Citation2002) evaluated the water infiltration and soil structure relation to OM and its stratification with depth and found that short-term soil disturbance of previously stratified soil led to uniform distribution of soil organic carbon (SOC), reduced soil BD, and increased water retention. Haghnazari, Shahgholi, and Feizi (Citation2015) evaluated the different factors affecting the rate of infiltration of agricultural soils and reported that the infiltration rate is greatly reduced by the loss of organic content, compaction due to movement of heavy machine, and excessive grazing. They have also suggested some management strategies like increase in the amount of plant cover, especially of plants that have positive effects on infiltration, decrease the extent of compaction by avoiding intensive grazing and the use of machinery when the soils are wet, decrease the formation of physical crusts by maintaining or improving the cover of plants or litter and thus reducing the impact of raindrops. Adeniji et al. (Citation2013) estimated the soil infiltration rate using soil texture at the university of Maiduguri. Azuka, Mbagwu, and Oyerinde (Citation2013) evaluated the soil infiltration characteristics in South-Eastern Nigeria and prediction were done using the effect OM content, microporosity, BD, initial MC, coarse sand, silt, and clay contents of soil. They reported that these soil properties have great influence on the infiltration characteristics of the soils. It is reported that infiltration is influenced by soil OM, PD, BD, MC, sand, silt, clay, porosity, and specific gravity (Ayu, Soemarno, and Java Citation2013; Osuji et al., Citation2013). The degree of soil OM stratification with depth has been suggested as an indicator of soil quality, because surface OM is essential to control erosion, water infiltration, and conservation of nutrients (Franzluebbers, Citation2002). Inherent factors such as soil texture which cannot be changed also affects the soil infiltration.
Table 3. Descriptive statistics of measured soil properties.
4.2. Prediction model using MLR
For prediction of basic infiltration rate, the analysis was categorized into five classes. The first class has three independent variables such as sand, silt, and clay (soil texture). The second class has soil texture and BD as independent variables. The third class had soil texture, BD, and PD as independent variables. The fourth class had soil texture, BD, PD, and MC as independent variables. The fifth class had soil texture, BD, PD, MC, and organic content as an independent variable.
4.3. Analysis of first class
The infiltration rate was estimated using sand, silt, and clay, and the results of analysis are shown in and , respectively. It was observed that sand content varies from 62.93% to 84% with a mean value of 74.33%, silt content varies from 7.36% to 20.25% with a mean value of 14.26% and clay content varies from 5.33% to 19.07% with a mean of 11.41%. The developed prediction equation for the EIR is given below.
Table 4. RMSE values between observed IR and estimated IR based no number (n = 3, 4, 5, 6, 7) of parameters.
Figure 2. Measured infiltration rate versus estimated infiltration rate.
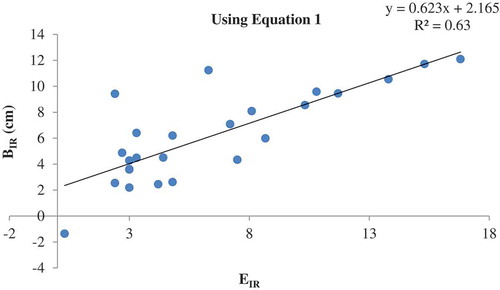
Prediction equation 1,
EIR = 14,195.35−141.75 (sand%) −142.10 (silt%) −142.56 (clay%)
From , it was found that the estimated infiltration rate varies from 1.35 to 12.09 cm/h with an average rate of 6.18 cm/h and measured average infiltration rate was 6.44 cm/h. The RMSE varied from 0.01 to 7.02 with an average value of 2.07. The RMSE was lowest at P8 station and highest at A4 station. The coefficient of determination (R2) was 0.63 and the coefficient of correlation, R was 0.79. The standard error (e) was 2.89.
4.4. Analysis of second class
The infiltration rate was estimated using sand, silt, clay, and BD. The results of analysis are presented in and , respectively. It was observed that BD varies from 1.412 to 1.716 g/cm3 with a mean value of 1.57 g/cm3. The developed prediction equation for the EIR is given below.
Figure 3. Measured infiltration rate versus estimated infiltration rate.
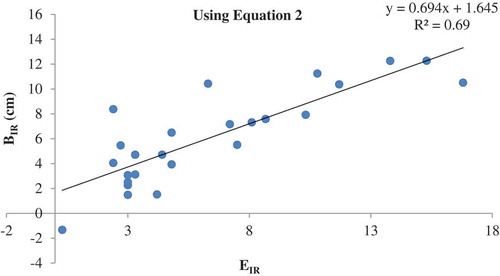
Prediction equation 2,
EIR = 22,041.03−220.01 (sand%)−220.38 (silt%)−220.77 (clay%)−12.71 (BD%)
Estimated infiltration rate varies from 1.33 to 12.27 cm/h with an average value of 6.12 cm/h. The RMSE varies from 0.03 to 6.29 with a mean value of 1.80. The RMSE was lowest for D2 station and found to be highest at station D1 (). The observed R2, R, and e were 0.70, 0.84, and 2.68, respectively. It is worth to mention that the predictability of the model improved with the consideration of BD, which is depicted by the increased R2 and R values compared to the previous analyzed first class.
4.5. Analysis of third class
The infiltration was estimated using sand, silt, clay, BD, and PD. The results of analysis are shown in and , respectively. It was found that PD varies from 2 to 3.03 g/cm3 with a mean value of 2.57 g/cm3. The developed prediction model is represented by equation 3.
Figure 4. Measured infiltration rate versus estimated infiltration rate.
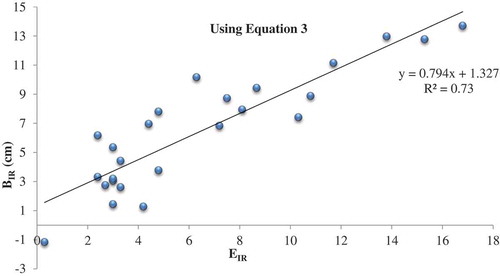
Prediction equation 3,
EIR = -26,642.18−266.11(sand%)−266.54(silt%)−266.84(clay%)−12.12(BD%)+3.46(PD%)
From , it was found that the estimated infiltration rate varies from 0.88 to 12.82 cm/h with an average rate of 6.57 cm/h which is bit higher than average measured infiltration rate (IR). The RMSE was varied from 0.02 to 7.32 with a mean value of 1.67. RMSE was lowest at station P10 and highest at station A4. The R2, R, and e values were 0.73, 0.86, and 2.6, respectively. It was observed that the predictability of the model improved compared to the previous developed models which can be seen from higher R2 and R.
4.6. Analysis of fourth class
The infiltration was estimated using sand, silt, clay, BD, PD, and MC. The results of analysis are shown in and , respectively. It was found that MC varies from 13.96% to 28.93% with a mean value of 24.05%. The developed prediction model is represented by equation 4.
Figure 5. Measured infiltration rate versus estimated infiltration rate using equation 4.
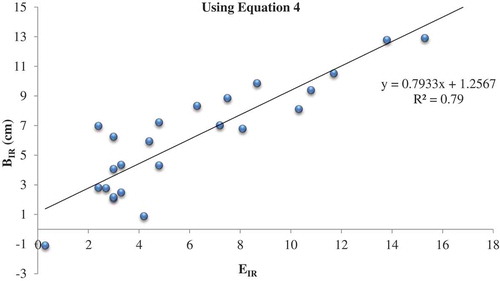
Prediction equation 4,
EIR = −34,344.80−343.17(sand%)−343.74(silt%)−343.96(clay%)−15.44(BD%)+0.31(MC%)+4.87(PD%)
From , it was found that the estimated infiltration rate varies from 0.78 to 15.08 cm/h with an average rate of 6.37 cm/h which is almost same as measured average infiltration rate (6.44 cm/h). The RMSE was varied from 0.01 to 5.11 with a mean value of 1.57. RMSE was lowest at station C2 and highest at station A4. The R2, R, and e values were 0.79, 0.89, and 2.34, respectively. It was also observed that the predictability of the model has greatly improved compared to the previous developed models which can be seen from higher R2 and R.
4.7. Analysis of fifth class
The infiltration was estimated using sand, silt, clay, BD, PD, MC, and organic carbon content (OC). The results of analysis are shown in and , respectively. It was found that OC varies from 0.28% to 0.36% with a mean value of 0.34%. The developed prediction model is represented by equation 5.
Figure 6. Measured infiltration rate versus estimated infiltration rate.
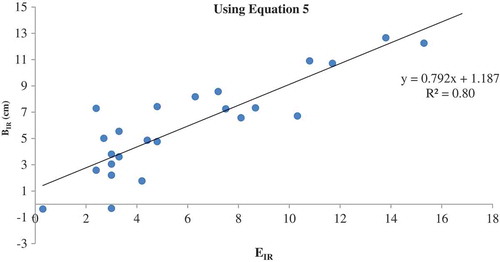
Prediction equation 5,
EIR = −30,578.81–305.56 (sand%)−306.16 (silt%)−0.306.33 (clay%)−15.18 (BD%)+0.34 (MC%)+4.18 (PD)+16.85 (OC%)
From , it was found that estimated infiltration rate varies from 0.37 to 15.04 cm/h with a mean value of 6.30 cm/h. The RMSE varies from 0.04 to 4.89 with a mean value of 1.52. Station D3 has the lowest RMSE and station A4 has the highest RMSE. The R2, R, and e values are 0.80, 0.89, and 2.39.
From all the analysis, it was observed that increase in independent variable increases the reliability of the prediction as R2 and R increases with increase in number of independent variables. The prediction equation 1 had lowest value of R2 and R and highest value of RMSE and standard error (e) whereas the prediction equation 5 had highest value of R2 and R and lowest value of RMSE and standard (e) error. This implies that equation 5 is the best amongst all of the equations.
4.8. Scatter plot of measured infiltration rate versus soil physical properties
The relationship between infiltration rate and each soil properties were analyzed and are shown in term of scatter plot. The scatter plot of percent sand versus infiltration rate, percent silt versus infiltration rate, percent clay against infiltration rate, BD against infiltration rate, percent MC against infiltration rate, and percent organic carbon (OC) against infiltration rate are shown in , , , , , , and , respectively. From these figures it is depicted that infiltration rate is either inversely or directly proportional to the measured soil properties.
Figure 7. Relation between sand and measured infiltration rate.
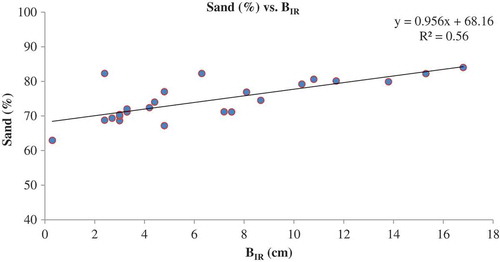
Figure 8. Relation between silt and measured infiltration rate.
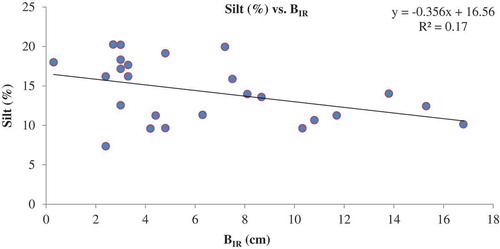
Figure 9. Relation between clay and measured infiltration rate.
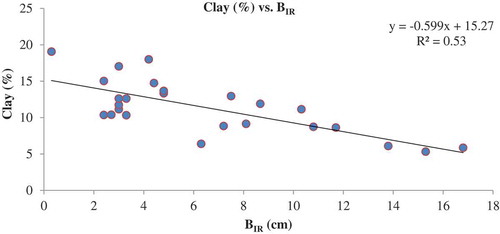
Figure 10. Relation between bulk density and measured infiltration rate.
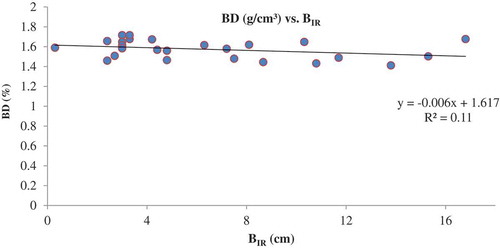
Figure 11. Relation between moisture content and measured infiltration rate.
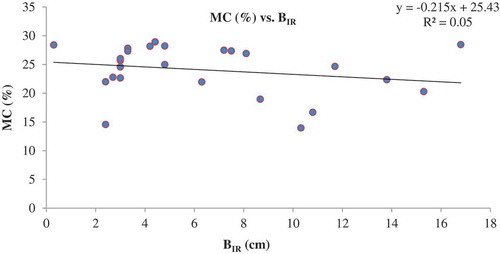
Figure 12. Relation between particle density and measured infiltration rate.
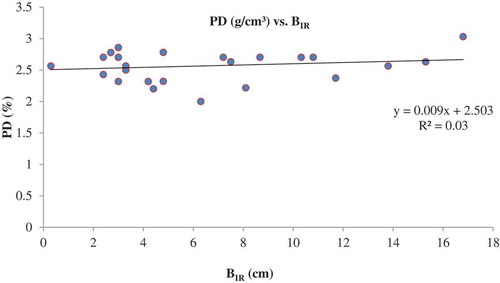
Figure 13. Relation between organic carbon and measured infiltration rate.
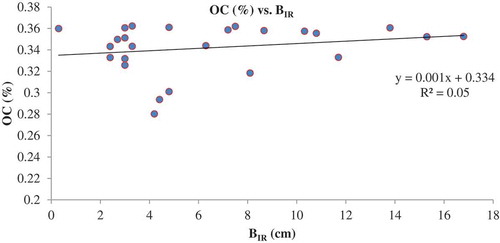
From the it is observed that sand content has strong positive relation with infiltration rate as R2 is 0.56 which means increasing in sand content in the soil will increase the infiltration rate significantly. Rashidi et al. (Citation2014) used the MLR analysis method for the prediction of soil infiltration rate based on sand content of soil in Iran. They developed a relation between soil infiltration rate and sand content of soil and suggested one linear regression model for the prediction of infiltration rate. From , it can be said that increase in silt content will decrease IR but with less significant as R2 is 0.16. From it can be seen that clay has a strong negative relationship with IR. Increase in clay will decrease IR significantly as R2 is 0.53. From it can be seen that BD has a negative relationship with infiltration rate. Increase in BD will decrease infiltration rate as R2 is 0.107. shows that MC has negative relation with infiltration rate. This means that higher the antecedent MC in the soil lesser will be the infiltration rate of soil. show PD has positive relation with infiltration rate which means higher the PD of soil higher will be the infiltration rate but with lesser significant effect as R2 is only 0.032. From the it is found that organic carbon has positive relation with infiltration rate but with minimum R2 is 0.048. But researcher like Franzluebbers (Citation2001) found that presence of higher SOC will reduce BD which intern improves the infiltration rate with greater significant value.
4.9. Correlation between dependent and independent variables
shows the correlation between measured infiltration rate and soil properties. This table shows that sand, PD, and organic content had positive correlation with observed infiltration rate by 0.75, 0.18, and 0.22, respectively, which means increase in sand, PD, and OC will increase the infiltration rate. Silt, clay, BD, and MC had a negative correlation with infiltration rate by −0.41, −0.73, −0.33, and −0.22, respectively. It means that increasing silt, clay, BD, and MC will decrease infiltration rate. Among all, the sand had the most positive correlation followed by clay as negative correlation which causes significant impact on infiltration rate of any soil type.
Genachte et al. (Citation1996) estimated infiltration parameters from basic soil properties in tropical rain forest of Guyana using Philip, Green-Ampt, Kostiakov, Horton, multiple regression, and principal components analysis techniques. They found pedotransfer functions with a R2 value ranging from 0.599 to 0.76 for the Ferralsol field plot and 0.38 to 0.68 for the Arenosol field plot.
4.10. Statistical performance evaluation
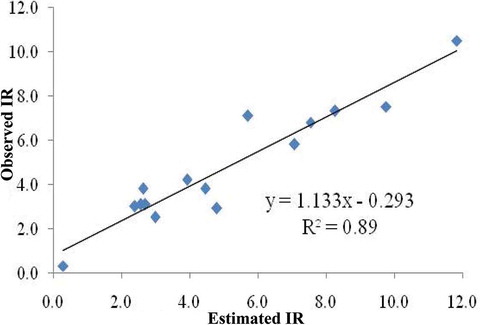
Results of infiltration rate estimation were statistically validated. The estimated infiltration rate results were compared with observed infiltration rate through seven parameters, R2 (0.89) shows singnifcant good correlation and it was also supported by other test RMSE = 1.103, R-RMSE = 0.244, MAE = 0.342, NRMSE = 0.231, MBE = − 0.342 (≈ 0, almost zero), MAPE = 0.477, d = 0.993 (~1), RMSE% = 1.538, NSE = 26.332, RSE = 0.419, IR = 1.072, PE% = 7.154, Sd2 = 1.136, P (at 95%) = 0.0995, and SD = 0.87), result have positive responses with respect to observed infiltration rate (). It can be used successfully for prediction of infiltration rate. The plot of observed vs. estimated infiltration rate shows good correlation (). present the statistical validation of observed versus estimated infiltration rate.
Table 5. Correlation between dependent and independent variables.
Table 6. The statistical validation of observed vs. estimated infiltration rate.
Figure 14. Plot of observed vs. estimated infiltration rate.
5. Conclusions
Infiltration rate plays very important role in concerning the efficiency of irrigation and drainage, optimizing the availability of water for plants, improving the yield of crops, minimizing erosion, and wastage of water. The soil physical properties, land use, vegetation coverage, and seasons also play a very important role in rate of infiltration. Infiltration models can be developed through PTFs using different soil properties and will be useful for the prediction of infiltration rate in the hilly region of Sikkim where the direct/field measurement of soil infiltration rate is very difficult due to one or more reasons. Therefore, the identified models will help in the estimation of infiltration rate just by using soil physical properties without much wastage of time and energy. The main objective of this study was to develop a model for the prediction of infiltration rate in absence of measured infiltration information for the study area. For this purpose different soil properties were estimated at 25 locations and used for the development of model using multiple linear regression method. The soil textural classes of study area are sandy loam (19 stations) and loamy sand (6 stations). The basic infiltration rate in the study area varies from 0.3 to 16.8 cm/h with a mean value of 6.444 cm/h. The basic infiltration rate was found to be higher in sandy loam soil with minimum value of 2.4 cm/h at station A4 and maximum value as 16.8 cm/h at station D1 compared to loamy sand soil which has minimum and maximum value as 0.30 and 13.80 cm/h, respectively. Sand, PD, and OC have a positive correlation with IR by 0.75, 0.18, and 0.22, respectively, whereas silt, clay, BD, and MC have a negative correlation with IR by −0.41, −0.73, −0.33, and −0.22, respectively. Among all sand has the highest correlation of −0.75 and R2 of 0.56 as a single soil property.Predicted model with all soil properties were best fitted model with highest R2 and R value and the lowest value of mean RMSE and standard error. The increase in independent variable increases R2 and R, which shows that more number of independent variable will give better result in prediction.
Supplemental Material
Download MS Word (476.5 KB)Acknowldegments
The authors are thankful to college of Agricultural Engineering and post Harvest Technology, Central Agricultural University, Gangtok, Sikkim, India for providing the facility and support for conducting the research work.
Disclosure statement
No potential conflict of interest was reported by the authors.
Supplementary material
Supplementary data for this article can be accessed here
Related Research Data
References
- Adeniji, F. A., Umara, B. G., Dibal, J. M., & Amali, A. A. (2013). Variation of infiltration rates with soil texture. A laboratory study. International Journal of Engineering and Innovative Technology, 3(2), 454–459.
- Ahaneku, I. E. (2011). Infiltration characteristics of two major agricultural soils in North Central Nigeria. Agricultural Science Research Journals, 1(7), 166–171.
- Ayu, I. W., Soemarno, S. P., & Java, I. I. (2013). Assessment of infiltration rate under different drylands types in unteriwes subdistrict Sumbawa Besar, Indonesia. Journal of Natural Sciences Research, 3(10), 71-76.
- Azuka, C. V., Mbagwu, J. S. C., & Oyerinde, G. T. (2013). Infiltration characteristics and their prediction on a toposequence at Nsukka, South Eastern Nigeria. International Journal of Science and Advanced Technology, 3, 1–7.
- Cerda, A. (1996). Seasonal variability of infiltration rate under contrasting slope conditions in South East Spain. Geoderma, 69, 217–232.
- Champatiray, A., Balmuri, V., Patra, K. C., & Sahoo, M. M. (2015). Standard Test for Determination of Infiltration Rate of Soil Using Double Ring Infiltrometer. In G. C. Mishra (Eds.), Innovative Trends in Applied Physical, Chemical, Mathematical Sciences and Emerging Energy Technology for Sustainable Development (pp. 9-13). New Delhi, India: EXCELLENT PUBLISHING HOUSE. ISBN: 978-93-83083-71-8 .
- Dagadu, J. S., & Nimbalkar, P. T. (2012). Infiltration studies of different soils under different soil conditions and comparison of infiltration models with field data. International Journal of Advanced Engineering Technology, 3(2), 154–157.
- Diamond, J., & Shanley, T. (1998). Infiltration rate assessment of some major soils. Proc. Agricultural research forum, Dublin: 001–013.
- Fox, D. M., Bryan, R. B., & Price, A. G. (1997). The influence of slope angle on final infiltration rate for interrill conditions. Geoderma, 80, 181–194.
- Franzluebbers, A. J. (2002). Water infiltration and soil structure related to organic matter and its stratification with depth. Soil and Tillage Research, 66(2), 197–205.
- Genachte, Van., De, G., Mallants, D., Ramos, J., Deckers, J. A., & Feyen, J. (1996). Estimating infiltration parameters from basic soil properties. Hydrological Processes, 10, 687–701.
- Haghnazari, F., Shahgholi, H., & Feizi, M. (2015). Factors affecting the infiltration of agricultural soils: Review. International Journal of Agronomy and Agricultural Research, 6(5), 21–35.
- Joshi, V. U., & Tambe, D. T. (2010). Estimation of infiltration rate, run-off and sediment yield under simulated rainfall experiments in upper Pravara Basin, India: Effect of slope angle and grass-cover. Journal of Earth System Science, 119(6), 763–773.
- Lake, H. R., Akbarzadeh, A., & Mehrjardi, R. T. (2009). Development of pedotransfer functions to predict soil physico-chemical and hydrological characteristics in Southern coastal zone of Caspian sea. Journal of Ecology and Natural Environment, 1(7), 160–172.
- Liu, C.-W., Cheng, S.-W., Wen-Sheng, Y., & Chen, S.-K. (2003). Water infiltration rate in cracked paddy soil. Geoderma, 117, 169–181.
- Martens, D. A., & Frankenberger, J. W. T. (1992). Modification of infiltration rates in an organic-amended irrigation soil. Agronomy Journal, 84(4), 707–717.
- Osuji, G. E., Okon, M. A., Chukwuma, M. C., & Nwarie, I. I. (2010). Infiltration characteristics of soil under selected land used practices in Owerri, South Eastern Nigeria. World Journal of Agricultural Science, 6(3), 322–326.
- Rashidi, M., Ahmadbeyki, A., & Hajiaghaei, A. (2014). Prediction of soil infiltration rate based on some physical properties of soil. American-Eurasian Journal of Agricultural and Environmental Science, 14(12), 1359–1367.
- Sarmadian, F., & Taaghizadeh-Mehrjardi, R. (2014). Estimation of infiltration rate and deep percolation water using feed-forward neural networks in Gorgan province. Eurasian Journal of Soil Science, 3(1), 1–6.