
ABSTRACT
The research associated the comparison of soil properties influencing organic carbon between forest of Chandaka Wildlife Sanctuary (CWS), Bhubaneswar and Bhitarkanika National Park (BNP), Rajnagar of Odisha. Soil samples were collected randomly from sampling plots (20 m × 50 m) and characterized by SEM and FT-IR, etc. The SEM micrographs analyze the aggregate-dominant fabric soil (Fine sand type) of CWS and matrix-dominated fabric soil (Clay loam type) of BNP. The FT-IR spectroscopy ensured the variant and prominent C-functional groups in both forest soils. The soil organic carbon of CWS (47.51 ± 2.16 Mg C/ha) and BNP (54.3 ± 3.0 Mg C/ha) directed through soil physico-chemical properties. The C/N ratio of CWS (51.3 ± 13.8) and BNP (21.6 ± 2.6) soil indicated the freshly added stable carbon compound availability at CWS. These results encourage study of soil organic carbon perspectives for sustainable forest conservation.
KEYWORDS:
Introduction
Worldwide, studying forest area soil carbon has gained momentum for its better management on global carbon storage. The process of land-use land change and deforestation has declined the forest carbon pool, and thus removal of plant biomass and decrease in the organic matter input in soil. Forest soil reserves much higher organic carbon including varying proportion of active organic carbon fractions and stable organic matter, referred to as humus in comparison to agriculture and other land use (Mandal et al., Citation2014). Transitions of degraded forest to regenerated forest enhance the carbon sequestration in vegetation and soil. However, forest soil can store carbon more than the combined amount present in living biomass and atmospheric CO2 (Jobbagy and Jackson, Citation2000). The tropical deciduous forests (33.19%) dominant over tropical semi-evergreen forests and coastal Mangrove forests (0.3%) are destroyed through the growing demand for cultivated land, development of industries and mining, urbanization and over grazing of pasture (FSI, Citation2013). The soil physical characteristics determine the adoptability, the level of biological activities and regulate the plant ecosystem. In part, soil characteristics depend on forest types rather directly affected through forest biodiversity (Myo, Thwin, & Khaing, Citation2016). The plant composition may alter the soil physical and chemical properties, which in turn disturbs land efficiency (Singh, Tripathi, & Singh, Citation2011). The soil textural variations are ranging from sandy loam to clay loam. The regenerating capacities of frequent growing species and water lodging make somewhat the soil acidic (Mishra et al., Citation2017). In context to global coastal zone mangrove forests have 25% of carbon burial, and hence a vital source of terrestrial and oceanic carbon cycling (Alongi, Citation2008; Liu et al., Citation2014). The net primary production of mangrove ecosystem was estimated to be 218 × 109 kg C per year, i.e., one of the most productive biome of the earth (Bouillon et al., Citation2008: Tue et al., Citation2012). The forests composed of marine alluvium soil rich in organic matter and alkaline in nature. The light-colored topsoil are porous and well aerated rather than the dark-colored topsoil. The soils obtained a complex system by the convoluted interaction among tides, physiography, activities of plant, and invertebrates that may even changes within short distance (Otero et al., Citation2009).
Figure 7. Column chart comparing the C/N ratio in terms of mean ± SEM.
India possesses 10th rank in the world by 76.87 million ha of forest and tree cover with a large variety of climatic and topographic regimes. About 75% of the total terrestrial carbon pool is soil carbon (Farquhar et al., Citation1989). Odisha state forests occupy approximately 32.33% of the total Indian forest cover (i.e., 21.23% of the total geographical area). The global soil organic carbon (SOC) is estimated about 3000 Pg, but huge variabilities remain in to the depth >1 m (Kochy, Hiederer, & Freibauer, Citation2015). Soil classification with their edaphic variables such as pH, conductance, and parent material, texture along with the chemical and physical composition of substrate, also regulate the soil organic matter and stock (Ganuza and Almendros, Citation2003). Thus, the demands for fundamental understanding of mechanisms of SOC stabilization and a systematic scientific work related to forestry, in India, started with the establishment of FRI (Forest Research Institute) in 1905 (Patra et al., Citation2015). However, there are relatively little data on SOC in connection to tropical and subtropical forest types of India.
The comparative characteristics of soil properties and SOC content covering two separate forests, i.e., Secondary mixed deciduous forest of Chandaka Wildlife Sanctuary (CWS) and mangrove forest of Bhitarkanika National Park (BNP) have been focused here. The objectives are (i) to assess and compare the physico-chemical properties of both forest soil and (ii) their correlation study to establish the significant effect of these parameters on SOC.
Materials and method
The sampling enclosed different forest sites of CWS and BNP: the former is the part of Eastern Ghats and later is the part of Coastal Plains of Odisha ().
CWS, Bhubaneswar
The area spread over the northwestern fringe of Bhubaneswar and a part of Khurdha uplands of “Eastern Ghats” biotic region influence by tropical weather and rich phytodiversity dominated by mostly angiosperms grow on lateritic soil (Biswal, Thatoi, & Sahu, Citation2005).
BNP, Rajnagar, Kendrapara
Evergreen Mangrove Forest of Mahanadi Delta, Rajnagar is situated on the gateway to Gahirmatha Marine Sanctuary and a forest part of Bhitarkanika National Park. This forest comprises alluvial silty soil with comparatively less phytodiversity dominated by gymnosperms (Chaudhuri et al., Citation2015).
Sample collection, preparation and analysis
Sampling plots were rectangular (20 m × 50 m) based on species area curve (Mueller-Dombois & Ellenberg, Citation1974). Ten spatial plots locations were tagged for its geographical positioning, i.e., latitude and longitude of each plot using a GRAMIN-global positioning system (GPS). The soil samples randomly collected by T-shaped iron auger (7 cm diameter) up to a depth of 30 cm. pH and electrical conductivity of soil samples were analyzed with pH and EC meter (Systronics 371). The soil samples were air dried and sieved (<0.2 mm) for its laboratory analysis. For moisture content (%), the soil samples were oven dried at 104.5° C for 24 h following gravimetric direct method (Gardner, Robinson, Blyth, & Copper, Citation2001). Bouyoucos Modified method was followed to determine soil texture (Beretta et al., Citation2014). SOC was estimated through partial oxidation method (Walkley & Black, Citation1934). Then the total SOC stock was calculated using bulk density and soil depth (VandenBygaart & Angers, Citation2006). The data on SOC were evaluated statically though SPSS software and the mean ± standard error of SOC are graphically represented.
For estimation of carbon, hydrogen and nitrogen percentages, homogenized fine powdered soil samples were analyzed through CS-Analyzer (model.no-EMIA920V2) and ONH-Analyzer (model.no.-EMGA-930), respectively. H2O2 treatment of soil had been conducted to remove the organic carbon from the bulk soil sample. The fine-powdered soil samples are compactly treated with KBr pellets and Fourier transform infrared (FT-IR) spectral scanning obtained at 4000–400 cm−1 to compare bulk soil and H2O2 (30%) treated soil. The data of FT-IR were graphically represented through Microsoft origin 9.0. The soil samples were homogenized using 2 mm sieve and sprinkled on double-sided carbon tape, the excess blown off with compressed air to characterize the sample through scanning electronic microscopy (SEM).
Results and discussions
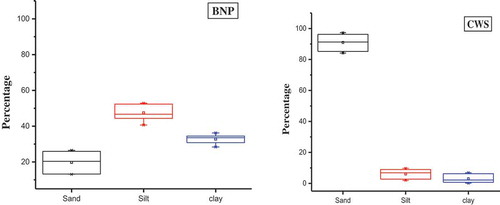
The experimental soil physio-chemical parameters are evaluated through average and standard error of mean. The comparative result of physico-chemical parameters characterized that CWS soil was acidic with lower electrical conductivity (EC) and soil moisture content percentages (). However, BNP forest soil was alkaline, with higher EC and soil moisture content percentages (Sukardjo, Citation1994). The Box and Whisker charts of soil texture () classify the variation in the soil types. The fine sand soil type of CWS have characterized 90.9% sand content, 6% silt content, and very low clay (3.0%) content supplying lower SOC i.e., 11 gm/kg. However, BNP soils were characterized by higher SOC (13 gm/kg), for silt (47%)content, clay(33%) content, and low sand (20%) content (Meersmans, De Ridder, Canters, DeBaets, & VanMolle, Citation2008). Likewise, BNP had the higher water content soil rather than CWS.
Table 1. Comparision of soil physico-chemical parameters of CWS and BNP.
Figure 1. Maps of study area.
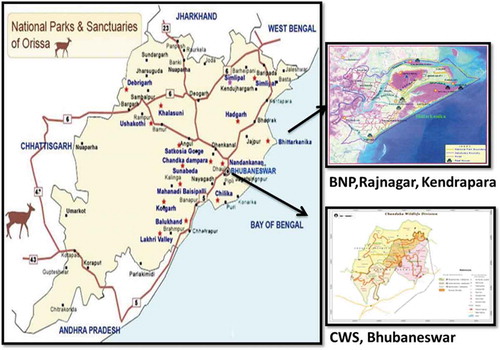
Figure 2. Box and Whisker charts of CWS and BNP soil texture.
SEM and FT-IR study
The SEM photographs of CWS and BNP soil samples displayed shape of sand varied rounded to rough and some places angular. The 10 and 5 µm magnification had done in both types interpreted different pattern of arrangement of soil granules (). The spectroscopical analysis done through FT-IR technique revealed sharp picks for CWS whereas BNP had more blunted picks ().
Figure 3. SEM micrographs of soil samples recorded at different magnifications: 5 µm and 10 µm.
Figure 4. FT-IR spectra of CWS and BNP soil samples.
SOC and C/N ratios
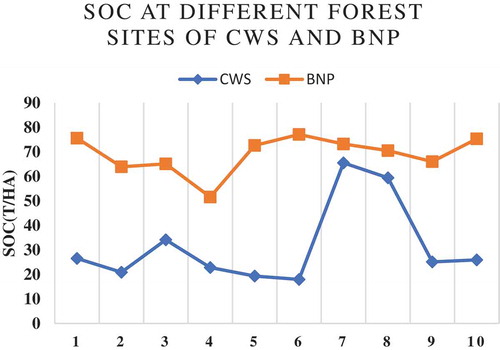
The average SOC () in CWS was calculated as 47.51 ± 2.16 t/ha and that of BNP was 57.6 ± 3.2 t/ha. This ratio is comparatively high in CWS, i.e., 51.3 ± 13.8 and that of BNP, is 21.6 ± 2.6. The error bar is more prominent at CWS than that of BNP ().
Figure 5. Comparative line – graph re-presenting FT-IR spectra of raw and H2O2-treated soil samples.
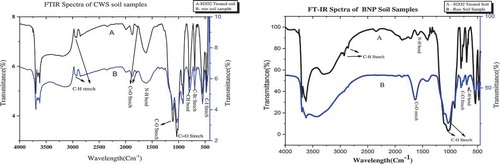
Figure 6. A line chart showing SOC variations at CWS and BNP.
Correlation co-efficient study
The Pearson’s correlation coefficient had been verified on SOC with several physico-chemical parameters like pH, EC, and moisture content (). The r-values of sand and clay fraction (CWS soil samples) were positive but for the silt particle had negative significant correlation. But positive r-values were estimated in the case of clay content of BNP soil (i.e., r = 0.23) which was 95% significant. The SOC of CWS was estimated to be positively correlated (r = 0.151) with SOC of BNP.
Table 2. Pearson’s correlation matrix among soil physicochemical parameters of CWS, BNP.
This extensive study compares the particulate soil associated with organic carbon of two distinguished forest area of Odisha. The clay particles in soil maintain about 50–75% and the silt retain 20–40% of the SOM. The fine sand soil type of CWS obtained 11 gm/kg SOC.The higher water holding capacity affected the SOC (13 gm/kg.) of BNP (Rawls, Pachepsky, Ritchie, Sobecki, & Bloodworth, Citation2003). The estimated SOC stock of both forest were lower than earlier studies ().
Table 3. SOC of different deciduous and mangrove forest areas of world.
The study on SEM micrographs of CWS specified large dispersion of particles at a high magnification due to less clay and more sand particles that varied rounded to rough and some places angular (Sergeyev et al., Citation1980). The spacing in the same crystal confirmed the presence of interstratified clay particles. The less transition between the sand and clay particle indicate less binding of SOC (Kaiser & Guggenberger, Citation2004). Soil sample consists of granular arrangement with spherical shape of randomly split elementary particles seen at 10-µm magnification. Furthermore, augment up to 5 µm illustrates clean silt granules with few connecters. The BNP soil sample at 10 µm and 5 µm magnification confirms highly dense clay matrices with large inter-assemblage pore space and few intra-assemblage pore spaces which dominate the fabric. However, the aggregate structure of BNP soil sample has a strong influence on soil strength. This demonstrated the compactness of dry side induces aggregate-dominated fabric of CWS and the wet side causes matrix-dominated fabric of BNP without apparent aggregates of soil particles (Marathe, Citation2012; Nenadovic et al., Citation2010).
FT-IR analysis and soil organic carbon
The FT-IR spectroscopy prescribes a wide range of both aliphatic and aromatic carbon compound in the two forest soils. FT-IR graph of CWS () point out the sharp band value 3623 cm−1 confirms –OH axial deformation of Kaolinite and gibbsite and a band of 2914 cm−1 show –CH asymmetric axial deformation in methyl and ethylene. The discrete band at 796 cm−1 and 700 cm−1 indicating the plane folding of aromatic =CH bonds. Likewise, band at 475 cm−1 indicates Si–O deformation of Kaolinite in the soil sample of CWS. The broad intense band of about 3411 cm−1 of BNP indicates the stretching variation of bound and unbound –OH group. The band at 1370 cm−1 attributed O-H deformation of phenolic and aliphatic groups. The sharp discrete band 1049 cm−1 specified the presence of polysaccharides and additionally assigned to Si–O of clay minerals. Bands like 690 cm−1 and 540 cm−1 are due to inorganic materials. Furthermore, 540 cm−1 in BNP, show O-H angular deformation of kaolinite and gibbsite. The common bands of 1600 cm−1 in both CWS and BNP consigns aromatic C=C stretching or asymmetric –C=O stretch in COO- may characterizes about the lignin and other aromatic or aliphatic carboxylates vibrations (Cocozza, D’Orazio, Miano, & Shotyk, Citation2003). The bands between 1080 and 1030 cm−1 direct the combination of C=O stretching and –OH deformations. In both the soil sample, kaolinite and gibbsite were concluded from –OH axial deformation at the sharp band 3623 cm−1 in CWS and –OH angular deformation at 540 cm−1 in BNP (Haider, Citation2016). FT-IR of Hydrogen peroxide (H2O2) treated soil samples of CWS described less variation and presence organic compounds in rigid form (). However BNP soil inferred the presence of inorganic carbon with some variation to that of raw soil sample due to fresh addition of the organic materials (Ellerbrock et al., Citation1999; Margenot, Calderon, & Parikh, Citation2016).
SOC depends upon the organic matter present in the soil (Rawls et al., Citation2003; Lutzo et al., Citation2006). The changes of carbon stock in soil influenced by the quantity and quality of litter fall and particle stabilization by binding with the clay particles (Fontaine et al., Citation2007; Beare et al., Citation2014). Organic carbon has significant correlation with moisture content of clay particles of both forest soil (Chaudhari, Ahire, Chkravarty, & Maity, Citation2013). The SOC in mangrove soil varies greatly because of influenced tidal gradient, forest age, biomass productivity, species composition and sedimentation of suspended matter (Ceron-Breton et al., Citation2011). Hence, the BNP soil compile varied amount of organic carbon percentage at different areas but in more stabilized form because of more clay content. The heterogeneity vegetation types, plant growth conditions at a different area of CWS affect the SOC percentage (Grigal and Ohman, Citation1992). In our study, the SOC% in 0–30 cm. depth showed a positive relation with the soil properties, the amount of fine soil mineral particles and above ground vegetation. However, the soil topography moisture contents, pH, and conductivity showed less variation in the different zone of both forest types in relation to their vegetation (Aizat, Mohamad-Roslan, Sulaiman, & Karam, Citation2014).
The C/N ratio of soil samples provides information relating nutrient storage as well as their recycle and an index of organic matter quality (Igwe, Citation2001). The higher C/N ratio in CWS indicates the recent addition of above ground, and below ground plant residues in soil, poor in carbonate content and humification (Freixo et al., Citation2002; Sabiene, Kusliene, & Zaleckas, Citation2010). However, the lower C/N ratio indicated more carbonate content and well humification of BNP soil and high release of CO2(Simson, Citation2005).
Conclusion
The comparison revealed the influence of environmental factors like pH, conductance, and soil moisture on carbon content of soil with their mineral associated C-content and clay fractions. The resulted higher SOC value in BNP may due to dense vegetation and carbon stored in clay fractions in comparison to CWS. However, the soil physico-chemical parameters may establish little variation in different zone of both forest types in relation to their vegetation. The comparative results were analyzed and disrupt the recovery percentage of carbon in soil. Thus, various carbon functional groups and soil structural impact on binding carbon need detail characterization through FT-IR and SEM. Both the ecosystems obtained significant level of SOC which are priority areas for restoration and conservation, and will enhance carbon stock for future climate change mitigation programs.
Acknowledgments
The authors are grateful to Prof. B.K. Mishra, former Director, CSIR-IMMT, Bhubaneswar for laboratory facilities and DFOs of CWS and BNP as well as forest department Govt. of Odisha for financial support.
Disclosure statement
The authors reported no potential conflict of interest.
References
- Aizat, M., Mohamad-Roslan, A. M. K., Sulaiman, W. N. A., & Karam, D. S. (2014). The relationship between soil pH & selected soil properties in 48 years logged-over forest. International Journal of Environmental Sciences, 4(6), 1129–1140.
- Alongi, D. M. (2008). Mangrove forests: Resilience, protection from tsunamis, and responses to global climate change. Estuarine, Coastal and Shelf Science, 76(1), 1–13.
- Alongi, D. M., Clough, B. F., Dixon, P., & Tirendi, F. (2003). Nutrient partitioning and storage in arid-zone forests of the mangroves Rhizophora stylosa and Avicennia marina. Trees, 17, 51–60.
- Beare, M. H., McNeill, S. J., Curtin, D., Parfitt, R. L., Jones, H. S., Dodd, M. B., & Sharp, J. (2014). Estimating the organic carbon stabilisation capacity and saturation deficit of soils: A New Zealand case study. Biogeochemistry, 120, 71–87.
- Beretta, A. N., Silbermann, A. V., Paladino, L., Torres, D., Bassahun, D., Musselli, R., & García-Lamohte, A. (2014). Soil texture analyses using a hydrometer: Modification of the Bouyoucos method. Ciencia Investigacion Agraria, 41(2), 263–271.
- Biswal, A. K., Thatoi, H. N., & Sahu, D. (2005). Floral diversity in Chandaka Wildlife Sanctuary, Orissa. Journal of Economic and Taxonomic Botany, 29(2), 385–401.
- Bouillon, S., Borges, A. V., Castañeda-Moya, E., Diele, K., Dittmar, T., Duke, N. C., … Twilley, R. R. (2008). Mangrove production and carbon sinks: A revision of global budget estimates. Global Biogeochemical Cycles, 22, GB2013.
- Ceron-Breton, J. G., Ceron-Breton, R. M., Rangel-Marron, M., Murielgarcia, M., Cordova-Quiroz, A. V., & Estrella-Cahuich, A. (2011). Determination of carbon sequestration rate in soil of a mangrove forest in Campeche, Mexico. WSEAS Transactions on Environment and Development, 7(2), 55–64.
- Chaudhari, P. R., Ahire, D. V., Chkravarty, M., & Maity, S. (2013). Soil bulk density as related to soil texture, organic matter content & available total nutrients of Coimbatore soil. International Journal of Scientific & Research Publications, 3(2), 1–8.
- Chaudhuri, P., Ghosh, S., Bakshi, M., Bhattacharyya, S., & Nath, B. (2015). A review of threats and vulnerabilities to mangrove habitats: With special emphasis on east coast of India. Journal of Earth Science & Climatic Change, 6(4), 1–9.
- Chhabra, A., Palria, S., & Dadhwal, V. K. (2003). Soil organic carbon pool in Indian forests. Forest Ecology and Management, 173, 187–199.
- Cocozza, C., D’Orazio, V., Miano, T. M., & Shotyk, W. (2003). Characterization of solid and aqueous phases of a peat bog profile using molecular fluorescence spectroscopy, ESR and FT-IR, and comparison with physical properties. Organic Geochemistry, 34(1), 49–60.
- Eid, E. M., & Shaltout, K. H. (2016). Distribution of soil organic carbon in the mangrove Avicennia marina (Forssk.) Vierh. along the Egyptian Red Sea Coast. Regional Studies in Marine Science, 3, 76–82.
- Ellerbrock, R. H., Hohn, A., & Gerke, H. H. (1999). Characterization of soil organic matter from a sandy soil in relation to management practice using FT-IR spectroscopy. Plant Soil, 213, 55–61.
- Farquhar, G. D., Ehleringer, J. R., & Hubick, K. T. (1989). Carbon isotope discrimination and photosynthesis. Annual Review of Plant Physiology and Plant Molecular Biology, 40(1), 503–537.
- Fontaine, S., Barot, S., Barre, P., Bdioui, N., Mary, B., & Rumpel., C. (2007). Stability of organic carbon in deep soil layers controlled by fresh carbon supply. Nature, 450, 277–280.
- Freixo, A. A., de A Machado, P. L. O., Dos Santos, H. P., Silva, C. A., & de S Fadigas, F. (2002). Soil organic carbon and fractions of a Rhodic Ferralsol under the influence of tillage and crop rotation systems in southern Brazil. Soil and Tillage Research, 64(3–4), 221–230.
- FSI. (2013). India state of forest report page 252. ( M. O. E. A. F. Forest Survey of India, Ed.). Dehradun, India: Government of India.
- Gandhi, D. S., & Sundarapandian, S. (2017). Large-scale carbon stock assessment of woody vegetation in tropical dry deciduous forest of sathanur reserve forest, Eastern Ghats, India. Environmental Monitoring and Assessment, 189(4), 187. doi:10.1007/s10661-017-5899-1
- Ganuza, A., & Almendros, G. (2003). Organic carbon storage in soils of the Basque Country (Spain): The effect of climate, vegetation type and edaphic variables. Biology and Fertility of Soils, 37(3), 154–162.
- Gardner, C. M. K., Robinson, D., Blyth, K., & Copper, J. D. (2001). Soil water content. In K. A. Smith & C. E. Mullins (Eds.), Soil and environmental analysis: Physical methods (pp. 1–64). New York: Marcel Dekker.
- Grigal, D. F., & Ohmann, L. F. (1992). Carbon storage in upland forests of the lake states. Soil Science Society of America Journal, 56, 935–943.
- Haider, S. W. (2016). Sediments analysis of eastern makran coast line area of Pakistan by X-ray diffraction. Journal of Biodiversity & Environmental Sciences, 9(1), 11–19.
- Igwe, C. A. (2001). Clay dispersion of selected aeolian soils of Northern Nigeria in relation to sodicity & organic carbon content. Arid Land Research and Management, 15(2), 147–155.
- Iqbal, S., & Tiwari, S. C. (2016). Soil organic carbon pool under different land uses in Achanakmar, Amarkantak biosphere reserve of Chhattisgarh, India. Current Science, 110(5), 771–773.
- Jobbágy, E. G., & Jackson, R. B. (2000). The vertical distribution of soil organic carbon and its relation to climate and vegetation. Ecological Applications, 10(2), 423–436.
- Kaiser, K., & Guggenberger, G. (2004). Mineral surfaces & soil organic matter. European Journal of Soil Science, 54, 219–236.
- Kauffman, J. B., Heider, C., Cole, T. G., Dwire, K. A., & Donato, D. C. (2011). Ecosystem carbon stocks of Micronesian mangrove forests. Wetlands, 31, 343–352.
- Kochy, M., Hiederer, R., & Freibauer, A. (2015). Global distribution of soil organic carbon – Part 1: Masses & frequency distributions of SOC stocks for the tropics, permafrost regions, wetlands, & the world. Soil, 1, 351–365.
- Liu, H., Ren, H., Hui, D., Wang, W., Liao, B., & Cao, Q. (2014). Carbon stocks and potential carbon storage in the mangrove forests of China. Journal of Environmental Management, 133, 86–93.
- Lunstrum, A., & Chen, L. (2014). Soil carbon stocks and accumulation in young mangrove forests. Soil Biology and Biochemistry, 75, 223–232.
- Lutzow, M. V., Kogel-Knabner, I., Ekschmitt, K., Matzner, E., Guggenberger, G., Marschner, B., & Flessa, H. (2006). Stabilization of organic matter in temperate soils: Mechanisms and their relevance under different soil conditions - a review. European Journal of Soil Science, 57, 426–445.
- Mandal, U. K., Venkanna, K., Raju, A. J. S., Sharma, K. L., Adake, R. V., Pushpanjali, R. B. S., … Babu, B. P. (2014). Carbon stocks in major soil types & land-use systems in semiarid tropical region of southern India. Current Science, 106(4), 604–611.
- Marathe, R. B. (2012). XRD & SEM analysis of Tapti River sediment: a case study. Archives of Applied Science Research, 4(1), 78–84.
- Margenot, A. J., Calderón, F. J., & Parikh, S. J. (2016). Limitations and potential of spectral subtractions in Fourier-transform infrared spectroscopy of soil samples. Soil Science Society of America Journal, 80(1), 10–26.
- Meersmans, J., De Ridder, F., Canters, F., DeBaets, S., & VanMolle, M. (2008). A multiple regression approach to assess the spatial distribution of Soil Organic Carbon (SOC) at the regional scale (Flanders, Belgium). Geoderma, 143(1–2), 1–13.
- Mishra, A. K., Singh, K., Behera, S. K., Chaudhary, L. B., Singh, B., & Mishra, R. M. (2017). Soil properties in response to different plant community structures in tropical moist deciduous forest from Northern India. Climate Change and Environmental Sustainability, 5(1), 66–74.
- Mueller-Dombois, D., & Ellenberg, H. (1974). Aims & methods of vegetation ecology (pp. 45–66). New York: John Wiley & Sons.
- Myo, K. K., Thwin, S., & Khaing, N. (2016). Floristic composition, structure and soil properties of mixed deciduous forest and deciduous dipterocarp forest: Case study in Madan Watershed, Myanmar. American Journal of Plant Sciences, 7, 279–287.
- Nenadovic, S., Nenadovic, M., Kljajevic, L., Pavlovic, V., Djordjevic, A., & Matovic, B. (2010). Structure & composition of soils. Processing and Application of Ceramics, 4(4), 259–263.
- Otero, X. L., Ferreira, T. O., Huerta-Díaz, M. A., Partiti, C. S. M., Souza, V., Vidal-Torrado, P., & Macías, F. (2009). Geochemistry of iron and manganese in soils and sediments of a mangrove system, Island of Pai Matos (Cananeia—SP, Brazil). Geoderma, 148, 318–335.
- Patra, B., Dey, S. K., & Das, M. T. (2015). Forest management practices for conservation of biodiversity: An Indian perspective. International Journal of Environmental Biology, 5(4), 93–98.
- Paz, C. P., Goosem, M., Bird, M., Preece, N., Goosem, S., Fensham, R., & Laurance, S. (2016). Soil types influence predictions of soil carbon stock recovery in tropical secondary forests. Forest Ecology and Management, 376, 74–83.
- Rawls, W. J., Pachepsky, Y. A., Ritchie, J. C., Sobecki, T. M., & Bloodworth, H. (2003). Effect of soil organic carbon on soil water retention. Geoderma, 116(1–2), 61–76.
- Sabiene, N., Kusliene, G., & Zaleckas, E. (2010). The influence of land use on soil organic & nitrogen content redox potential. Agriculture, 97(3), 15–24.
- Sahu, S. C., Kumar, M., & Ravindranath, N. H. (2016). Carbon stocks in natural and planted mangrove forests of Mahanadi mangrove wetland, East coast of India. Current Science, 110, 12. doi:10.18520/cs/v110/i12/2253-2260
- Santos, L. T. D., Marra, D. M., Trumbore, S., Camargo, P. B., Chambers, J. Q., Negron-Juarez, R. I., … Higuchi, N. (2015). Wind throws increase soil carbon stocks in a Central Amazon forest. Biogeosciences Discussions, 12, 19351–19372.
- Sergeyev, Y. M., Grabowska-Olszewska, B., Osipov, V. I., Sokolov, V. N., & Kolomens, Y. N. (1980). The classification of microstructures of clay soils. Journal of Microscopy, 120, 237–260.
- Simson, T. (2005). Aliphatic compounds, organic C & N & microbial biomass & its activity in long-term field experiment. Plant Soil Environment, 51(6), 276–282.
- Singh, B., Tripathi, K. P., & Singh, K. (2011). Community structure, diversity, biomass and net production in a rehabilitated subtropical forest in North India. Open Journal of Forestry, 1, 11–26.
- Sukardjo, S. (1994). Soils in the Mangrove Forests of the Apar Nature Reserve, Tanah Grogot, East Kalimantan, Indonesia. Southeast Asian Studies, 32(3), 385–398.
- Toriyama, J., Ohta, S., Ohnuki, Y., Ito, E., Kanzaki, M., Araki, M., … Kiyono, Y. (2011). Soil carbon stock in Cambodian monsoon forests. Japan Agricultural Research Quarterly: JARQ, 45(3), 309–316.
- Tue, N. T., Ngoc, N. T., Quy, T. D., Hamaoka, H., Nhuan, M. T., & Omori, K. (2012). A cross-system analysis of sedimentary organic carbon in the mangrove ecosystems of Xuan Thuy National Park, Vietnam. Journal of Sea Research, 67, 69–76.
- VandenBygaart, A. J., & Angers, D. A. (2006). Towards accurate measurements of soil organic carbon stock change in agroecosystems. Canadian Journal of Soil Science, 86(3), 465–471.
- Velmurugan, A., Kumar, S., Dadhwal, V. K., & Gupta, M. K. (2014). Soil organic status of Indian forests. Indian Forester, 140(5), 468–477.
- Walkley, A., & Black, I. A. (1934). AN examination of the Degtjareff method for determining soil organic matter, and a proposed modification of the chromic acid titration method. Soil Science, 37, 29–38.