
ABSTRACT
Multivariate statistical techniques have emerged as one of the most effective tools in hydrochemical characterization and the identification of pollution sources in groundwater. Hydrogeochemical data of the 36 wells in the Lower Bhavani River basin in Tamil Nadu are used in this study. Hierarchical cluster analysis(HCA) derived three major clusters, in which cluster 1 has high concentration of Ions (n = 14; avg TDS = 1259 mg/L), followed by cluster 2 (n = 13; avg TDS = 775 mg/L) and cluster 3 (n = 8; avg TDS = 357mg/L). The hydrochemical facies also agree with the cluster hydrochemistry with Na-Cl type (cluster 1), Ca-Mg-Cl (cluster 2), and Ca-HCO3 (cluster 3) showing the influences of anthropogenic and the natural (rock–water interaction related) geochemical patterns. Aqueous Speciation Modeling suggests that the undersaturated Halite (Na-Cl), Gypsum, and Anhydrate minerals in all three clusters, Indicating the possibility for the dissolution of Na, Ca, SO4, and Cl. As in HCA, Principle Component Analysis (PCA) also delivered three major components showing the impact of textile industries and agricultural fertilizers, leakage of sewages and the natural interaction of water with fluorite rich minerals. It is observed that both natural and anthropogenic processes are controlling the variations in the hydrochemical parameters and correlated with land use patterns.
Introduction
Groundwater is the primary and most trusted source of drinking water in many arid and semi-arid regions of the world. The chemical composition of groundwater is an indicator of its suitability as a source of water for human and animal consumption, irrigation, and for industrial and other purposes. The definition of water quality is therefore not objective, but socially defined depending on the desired use of the water (Babiker, Mohamed, & Hiyama, Citation2007).
Groundwater pollution is common in both the developing and developed world. Contamination of groundwater can result in poor drinking water quality, loss of water supply, high clean-up costs, high costs for alternative water supplies, and/or potential health problems (Balakrishnan, Saleem, & Mallikarjun, Citation2011). In general, the increase in the ionic constituents in groundwater beyond the permissible level is termed as pollution. There are natural and anthropogenic processes that regulate the chemistry and quality of groundwater (Merchán, Auqué, Acero, Gimeno, & Causapé, Citation2015; Sajil Kumar, Citation2014). The most important subsurface processes that regulate groundwater chemistry are precipitation, recharge and discharge, ion exchange, redox processes, precipitation-dissolution processes, residence time, etc. (Reghunath, Murthy, & Raghavan, Citation2002; Sajil Kumar & James, Citation2016; Subramani, Rajmohan, & Elango, Citation2010). Leaching of fertilizers from agricultural fields, industrial effluents, and accidental spillages can also affect groundwater quality (Abu El Ella, Elnaze, & Salman, Citation2017).
India has been facing severe water scarcity in several parts of the country, especially in arid and semi-arid regions. Overdependence on groundwater to meet the ever-increasing demands of domestic, agriculture, and industry sectors has resulted in the overexploitation of groundwater resources and deteriorated the quality in many states of India (Machiwal, Jha, & Mal, Citation2011). Several studies were conducted in different parts of the country by a large number of researchers to evaluate the groundwater quality and its suitability for various purposes, spatial distribution, chemical composition, saline intrusions, groundwater-surface water interactions and groundwater vulnerability (Elango, Kannan, & Senthil Kumar, Citation2003; Subramani, Citation2005; Srinivasamoorthy et al., Citation2011; Vasanthavigar et al., Citation2010; Dar et al., Citation2011; Kumari, Singh, Verma, & Yaduvanshi, Citation2014; Gulgundi & Shetty, Citation2018). Identification of the factors affecting groundwater quality needs to be done using suitable evaluation methods. Multivariate analytical statistical methods were repeatedly used in literature to characterize the hydro-geochemistry (Guler, Thyne, McCray, & Turner, Citation2002; Kazakis, Mattas, Pavlou, Patrikaki, & Voudouris, Citation2017; Liu, Lin, & Kuo, Citation2003; Singh et al., Citation2017; Singh, Shashtri, & Mukherjee, Citation2010; Yidana & Yidana, Citation2010). Geographical Information Systems (GIS) are widely used in all fields of science. It is particularly useful in giving an overall idea about the system, without much physical fieldwork (El-Fadel, Tomaszkiewicz, Adra, Sadek, & Najm, Citation2014; Pourtaghi & Pourghasemi, Citation2012; Venkatesan & Senthil, Citation2018; Venkatramanan et al., Citation2015). It can be used as a tool in representing the special features and properties with better visuals.
In this study, we have used multivariate statistical analysis in combination with geostatistical and geochemical modeling to assess the source evaluation of geochemical parameters for the Lower Bhavani River basin in Tamil Nadu, India.
Study area
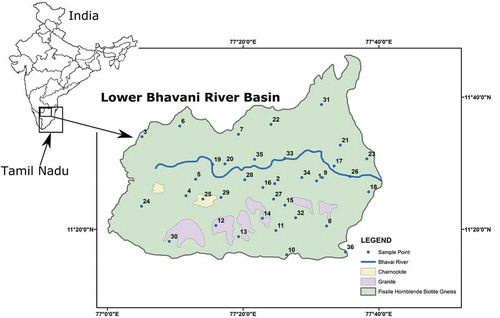
The river Bhavani originates from the western Ghats, flowing through Silent Valley in Kerala, draining western parts of Tami Nadu by covering 217Km and finally ending in Cauvery (). The whole basin covers 0.62 million hectors (www.rainwaterharvesting.org) with 11° 15ʹ N and 11° 45ʹ N latitudes and 77° 00ʹ E and 77° 40ʹ E longitudes. This part of the country is semi-arid with an annual average rainfall 618 mm. Monsoons are the biggest contributors of the water to groundwater recharge, with the largest one being the NE monsoon occurring in the months of October and November (Sajil Kumar and James, Citation2016). Temperature rises up to 40°C in the summer season and sinks down to 13°C in the winter season. The hottest month is May. Potential yearly evapotranspiration (ET) is 1,600 mm in the lower Bhavani Basin. The drainage pattern of the basin in mostly dendritic, which is an indication of the uniform resistance of rocks, a typical characteristic of hard rock terrain. Major rock types in Bhavani basin are fissile hornblende-biotite gneiss, charnockite, granites, hornblende-biotite gneiss. In addition, there is pyroxene granulite, ferruginous quartzite, tremolite schist, amphibolite, gabbro/anorthosite, pink migmatite, dolerite dykes, and granite intrusions (GSI, Citation1995; Sajil Kumar, Citation2017). Groundwater occurrence and dynamics are largely controlled by the geology of the region. Important soil formations are red calcareous soil, red non-calcareous soil, black soil, alluvial and colluvial soil, brown soil, and forest soil. However, red calcareous soils are the dominant soils, mostly sandy to loamy. Geomorphology suggests structural hills, Inselberg, ridges, valley fill, and pediments. Shallow pediments are the major geomorphological unit (CGWB, Citation2008). Land use shows that most of the area is used for agricultural purposes, mostly paddy, banana, groundnut, and sugarcane crops.
Figure 1. Location map of Lower Bhavani River Basin showing sampling location and geology.
Materials and methods
Groundwater sampling and analysis
Groundwater samples from 36 wells in the Lower Bhavani River basin were collected in 2011 as part of this study. The wells were located based on availability, spatial distribution, accessibility for further studies, representation of the hydrogeology, etc. All the selected wells were marked with latitude, longitude, and elevation using a handheld GPS (Garmin). Before the samples, wells were pumped out till the in-situ parameters were stabilized in order to get representative samples of the subsurface hydrology. Samples were collected in pre-cleaned polythene bottles of 1 L capacity and kept at 4°C until analyzed for chemical parameters. Chemical analysis was performed as per the standard methods suggested by APHA (Citation1998). Potable digital meters were used for the in-situ measurement of pH and EC. Ions such as Ca, Mg, Na, K, CO3, HCO3, Cl, and SO4 were analyzed. Carbonate and bicarbonate were assessed by acidic titration, Cl with Arganometric Titration with AgNO3. Sulfate was analyzed using an UV visible spectrophotometer. Nitrate and fluoride were assessed using Ion Chromatography. Sodium and potassium were analyzed using a flame photometer. Calcium and magnesium were determined by titration with EDTA. Ion balance error was calculated based on the anion and cation values and observed to be within the standard limit of ± 5%
Hierarchical cluster analysis (HCA)
Cluster analysis is a statistical technique that groups the samples based on the inherent structure and the underlying similarities within the data set. This method does not need any prior assumptions, and the clustering is done only by their nearness or similarity (Vega et al., Citation1998). In this method, a squared Euclidean distance is used to identify the multivariate resemblances in the hydrochemcial data (Kamble & Vijay, Citation2011; Ward, Citation1963). The most commonly used one is the Wards method, which uses the analysis of variance approach (ANOVA) to evaluate the distances between clusters (Singh, Malik, Mohan, & Sinha, Citation2004). Several studies have used this method as an efficient data analysis method when there a large data set of different characteristics be analysis.
Factor analysis
Factor analysis is a multivariate statistical technique in which the large number of data set is reduced to a small number without losing the information. In this method, correlation matrix is computed for the entire data and identify the interconnection between parameters. The derived parameters will express the characteristics of the complete data set. The eigenvalues and factor loadings for the correlation matrix were determined and scree plot was drawn. The extraction factors were based on the variances and covariances of the variables. The factors with eigenvalues greater than one are considering as the significant variables. Finally, by the process of rotation, the loading of each variable on one of the extracted factors is maximized and the loadings of all the other factors are minimized. This study considered pH, EC, TDS, TH, Na, K Ca, Mg, Cl, HCO3, and SO4 as water quality parameters. The software package SPSS 16 was used for the statistical analysis.
Geochemical and geostatistical modeling
Aqueous speciation modeling was carried out on different groundwater groups (from cluster analysis) using the PHREEQC code in the Aquachem 4.0 (Parkhurst & Appelo, Citation1999). The saturation indices of minerals were calculated based on the equation SI = log (IAP/Ksp); where SI: saturation Indices; IAP: Ion activity product; Kt: solubility product. The spatial variation maps where created using the Geostatistical mapping tool in the ArcGIS 10.1. We have used the inverse distance weighting method.
Results and discussion
Chemical characteristics of groundwater
Groundwater samples were analyzed to study the water quality variables, and the results are given in . Groundwater was generally alkaline in nature and ranged from 8 to 9. Electrical conductivity (EC) showed a wide range of 260–3100 µS/cm. TDS was calculated from EC and it was in the range of 125–1786 mg/L. Twelve groundwater samples exceeded the permissible drinking water limit of 1000 mg/L (World Health Organization [WHO], Citation2011). Calcium and magnesium concentration was in the rage of 16–168 mg/L, avg = 52 mg/L and 9–117 mg/L, avg = 58 mg/L, respectively. Eight samples exceeded the permissible the 75 mg/L (WHO, Citation2011). Na concentration ranged from 10 to 460 mg/L, with an average of 140 mg/L. Four groundwater samples exceeded the permissible limit 200 mg/L (WHO, Citation2011). Concentration of K+ in the study area is 4–375 mg/L, with an average of 42 mg/L. Cations in the study area were dominated in the order of Na>Mg>Ca>K. In the major anions, Chloride dominated the others and was in the range of 14–752 mg/L, with an average of 190 mg/L. A total of 12 samples exceeded the permissible limit of 250 mg/L (WHO, Citation2011). Bicarbonate concentration ranged between 52 and 526 mg/L (avg = 263 mg/L). Three groundwater samples showed an excess concentration of NO3 (>50 mg/L) and F (1.5 mg/L), which were in the range of 2–60 mg/L and 0.18–1.56 mg/L, respectively. The order of the dominance of anions was HCO3>Cl>SO4>NO3>F.
Table 1. Groundwater quality data in Lower Bhavani Basin and its comparison to WHO standards.
Hierarchical cluster analysis(HCA) of hydrochemical data
Groundwater quality data from the Lower Bhavani basin was initially subjected to hierarchical cluster analysis for better understanding the geochemical characteristics. HCA was performed on 12 hydrochemical variables using the Ward’s method and Euclidean distance as a measure of dissimilarity in the region (Helstrup, Jørgensen, & Banoeng-Yakubo, Citation2007; Teng et al., Citation2018). Results presented in a dendrogram () show that the groundwater can be classified into three distinct clusters, namely Cluster 1, 2, and 3. A statistical summary of the physicochemical parameters of the clusters is presented in .
Figure 2. Dendrogram showing the groundwater clusters.
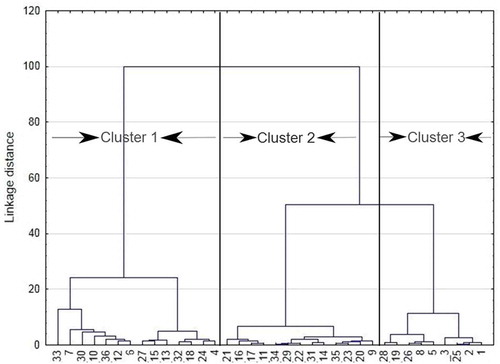
Table 2. Statistical summary of groundwater within the clusters.
Cluster 1 includes samples 4, 6, 7, 10, 12, 13, 15, 18, 24, 27, 32, 30, 33, and 36 (n = 14). This group has the highest dissolved solids avg = 1259 mg/L exceeding the permissible limit for drinking water of 1000 mg/L (WHO, Citation2011). As TDS, other major ions such as Na, K, Ca, Mg, Cl, SO4 HCO3, and NO3showed their highest concentration in Cluster 1 compared to the other clusters. In the piper trilinear diagram See ) most of the samples from this cluster are plotted in Na-Cl type of water. In Cluster 2, samples 9, 11, 14, 16, 17, 20, 21, 22, 23, 29, 31, 34, and 35 (n = 13) were grouped and the average TDS value was 775 mg/L. Most of the parameters fall within the limit of drinking water guideline values. The representing water type of this group is Ca-Mg-Cl. Cluster 3 samples were mostly unaffected by any kind of contamination (avg TDS = 357 mg/L). The samples grouped in this cluster are 1, 2, 3, 5, 8, 19, 26, and 28 (n = 8). These samples were represented by the hydrochemical facies CaHCO3, which also indicate the freshness of these water samples.
Figure 3. Piper trilinear diagram showing hydrochemical facies in the lower Bhavani river basin.
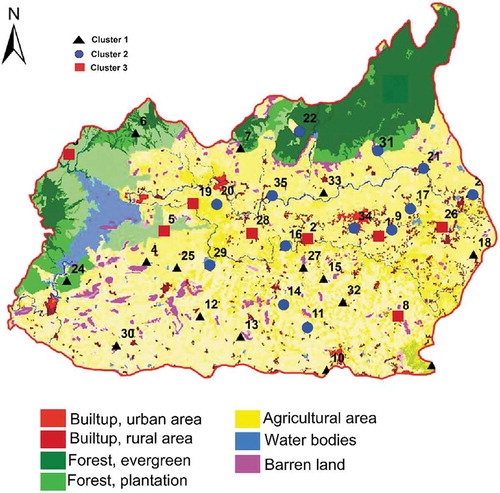
Spatial distribution of groundwater clusters in the study area was plotted and compared with the land use map (). The modification of the land for different purposes are often changing the natural conditions of soil, water, and environment. The chemical quality of water is showing an improvement from cluster 1 to 3. It must be noted that majority of the Cluster 1 samples were plotted in agricultural areas and in the industrial areas with more human settlements. This is the reason for the higher concentration of Na, Cl, NO3, SO4 in the groundwater and reported their highest concentrations in this area (see ). This shows that the groundwater chemistry of this group may be controlled by irrigation return flow, anthropogenic activities like industrial pollution, and domestic and urban sewages. Cluster 2 samples were showing the transition stage from recharge to discharge areas. The average TDS value in this cluster is 775 mg/L, obviously less than the permissible limit 1000 mg/L (WHO, Citation2011). Additionally, the Ca-Mg-Cl type of water also supports this argument. Cluster 3 samples were scattered all over the study region, mostly represents the water which is unaffected by the anthropogenic activities.
Figure 4. Landuse map of Lower Bhavani River Basin and distribution of samples from three different clusters.
Geochemical modeling of groundwater clusters
Saturation indices (SI) values were calculated for the three different clusters and are presented in . When the SI is below zero, the water is undersaturated with respect to the mineral under consideration. The SI value zero means that the water is in equilibrium with the mineral, whereas an SI greater than zero means a supersaturated solution with respect to the mineral in consideration.
Results show that in Cluster 1, groundwater is undersaturated with carbonate minerals in combination with SO4, i.e., anhydrite (SI = −1.89) and gypsum (SI = −1.65). This means that groundwater can dissolve more solutes from these minerals and thus can increase the concentration of the same. Additionally, high SO4 input from textile waste can increase its concentration in groundwater and the available Ca in groundwater may not be enough to meet the equilibrium. Thus, the resultant deficiency is indicated as negative SI values. However, in terms of dolomite (SI = 1.69), aragonite (SI = 0.54), and calcite (SI = 0.69), the groundwater is saturated and further dissolution may result in the precipitation of these minerals.
As in Cluster 1, samples in Cluster 2 and 3 also show a similar trend but anhydrite and gypsum become more undersaturated. Whereas dolomite, aragonite, and calcite reduce its saturation level by reducing the SI values, remaining saturated except aragonite in Cluster 3, which was drastically changed to undersaturation (see ). Halite was also undersaturated in all three clusters, becoming more and more undersaturated from Cluster 1 to 3, i.e., SIHalite ranged from −5.8 to −7.38. This may be due to the additional input of Na from mineral weathering other than the NaCl sourced from textile wastes. The other possible explanation will be the reduction of Na content in groundwater compared to Cl, due to the ion exchange reactions. The conservative nature of Cl in groundwater is also supporting this argument.
Table 3. Results of Aqueous speciation modeling with PHREEQC of three different clusters.
Source appointment of the ions controlling the hydrogeochemistry
Geochemical mechanisms occurring in the subsurface are invisible and complex. Thus, understanding these processes is possible only with certain techniques, assumptions, and inferences from already proven results. Factor analysis is one of the most important statistical data analysis techniques, which allow us to differentiate the various processes that control the solute concentrations in groundwater. In the first step, a correlation coefficient is calculated for the 11 parameters and presented in .
Table 4. Correlation matrix of the hydrochemical parameters in the study area.
Electrical conductivity showed a strong positive correlation with Mg (r2 = 0.77), Na (r2 = 0.84), Cl (r2 = 0.91), SO4 (r2 = 0.63), HCO3(r2 = 0.69), and NO3(r2 = 0.71). This shows that the groundwater chemistry of the study is primarily controlled by the processes related to these ions. Mg showed a positive correlation with Ca (r2 = 0.54) as well, and thus indicates a common origin of these ions in many samples. Cl has a positive correlation with Na (r2 = 0.74), showing the effect of salinity (Na-Cl) originating from the untreated effluents from the textile industry. SO4 has a positive correlation with K (r2 = 0.51) and Cl (r2 = 0.56) indicating anthropogenic influence. HCO3 has a positive correlation with Mg (r2 = 0.58) and Na (r2 = 0.60), indicating the effect of silicate weathering on groundwater chemistry. Nitrate is always considered as an indicator of anthropogenic pollution, having a positive correlation with Mg, Na, and Cl (Ahamad, Madhav, Singh, Pandey, & Khan, Citation2018; Zahn & Grimm, Citation1993). Fluoride does not show much correlation with the other parameters. The results of the correlation analysis suggest both natural and anthropogenic influences on hydrochemistry. The significance of these processes on groundwater chemistry can be differentiated by the factor analysis in the below section.
Principle component analysis was carried out on the entire data set and factor loadings were generated (). Based on the eigenvalues (>1), three factors evolved and explained 80% of the total variance in the data set.
Table 5. Factor loadings and communality of the variables after Varimax rotation.
Factor 1 is responsible for more than 46% of the variance, with very high factor loadings for EC, TDS, Ca, Mg, Na, Cl, HCO3, and NO3. It is well known that the Bhavani basin is famous for textile industries. The processing of textiles requires enormous amounts of salts and other coloring agents. After the treatment, the effluents rich in common salts (NaCl), MgCl2.6H2O, FeSO4.7H2O are discharged. It was found that there are no proper treatment plants for many companies in the study area; thus, these contaminants can reach the surface and the groundwater. Very high factor loadings for the ions such as Na, Mg, Cl, and also TDS indicate that Factor 1 represents the anthropogenic contaminants. In addition to these Ions, NO3 was also found in Factor 1. A natural origin (lithogenic and atmospheric deposition) for Nitrate is not considered as a major source in groundwater. Thus, considering the land use, the majority of the study area is used for agricultural activities and the high use of fertilizers will be the primary source of nitrate in the groundwater. Moreover, very high values of Cl in Cluster 1 suggest other pollution sources such as industrial effluents and fertilizers from agricultural fields.
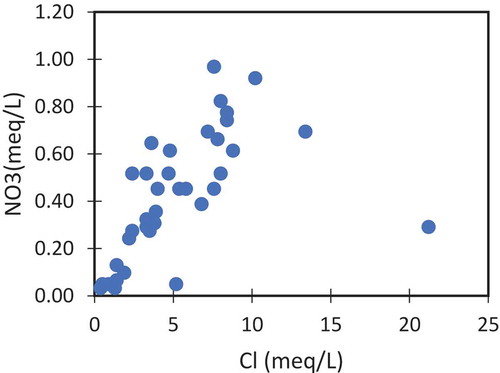
Ionic cross plots were plotted drawn to confirm the results. shows the relation of EC with Na and Cl. These ions vary positively with increasing conductivity values. The origin of Na and Cl will be a common origin if the concentration of one is varying proportionally to the other. shows that in most of the samples Na and Cl varying proportionally, suggesting the origin from high saline textile wastewater. Additionally, the anthropogenic influences were further proved by the plot between Cl and NO3 (). Both these ions are not found in the groundwater naturally and their higher concentration indicating the man-made origins. In this study Cl concentration varying positively with NO3. These arguments support the anthropogenic origins of these ions explained in the earlier sections ().
Figure 5. Relationship between (a) EC and Na (b) EC and Cl.
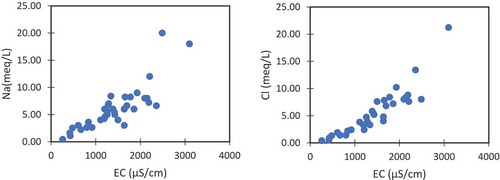
Figure 6. Relationship between Na and Cl.
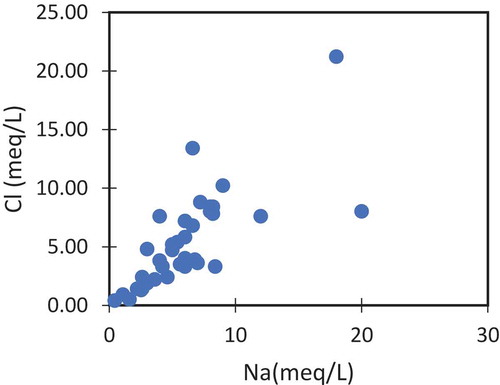
Figure 7. Relationship between Cl and NO3.
Factor 2 is responsible for 21.23% of the total variance in the data set. Very high factor loadings were observed for pH, K, SO4 and weak but positive loadings for TDS. High concentration of potassium and sulfate can be from the weathering of minerals such as potassium feldspars and calcium sulfate minerals such as Gypsum and Anhydrate (Subramani et al., Citation2010). However, the natural origins of these ions cannot exceed certain limits. Very high concentration of these ions shows anthropogenic activities like refuse dumping. A positive correlation of potassium with sulfate and a weak correlation with HCO3 agree with the observation of anthropogenic influences like sewage leakages into the groundwater. In addition, if fertilizers were the major reason for high potassium content, a much stronger correlation than r2 = 0.35 would be present with Nitrate.
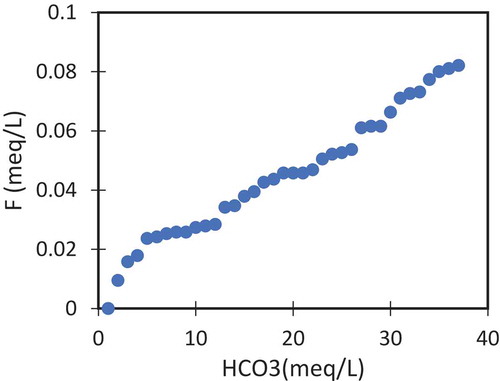
Factor 3 has a major factor loading F¯ which are responsible for 12.45% of the total variance in the data. Fluoride is geogenic in origin by the weathering of carbonate rocks such as carbonate and aragonite and fluoride-rich minerals such as fluorite, apatite, amphiboles, and micas. The concentration of F¯ in groundwater is increased with alkaline pH, increasing concentration of Na, and HCO3. and reduce with the increasing Ca2+ concentration. This negative relation of Ca2+ with F¯ is due to the precipitation of calcium as CaCO3 and the mobilization of fluoride ion from the fluorite minerals will take place under alkaline conditions. Most of the F3 values were in the NW regions where almost no anthropogenic activities are practiced. Thus, F3 is a clear representation of the natural groundwater. These ionic relationships were plotted in bivariate plots to demonstrate the results. The relation between fluoride with pH () and with HCO3 () shows that these parameters providing a positive influence on the fluoride concentration in the groundwater. Majority of the samples were in the positive trend for these ions.
Figure 8. Relation between F¯ and pH.
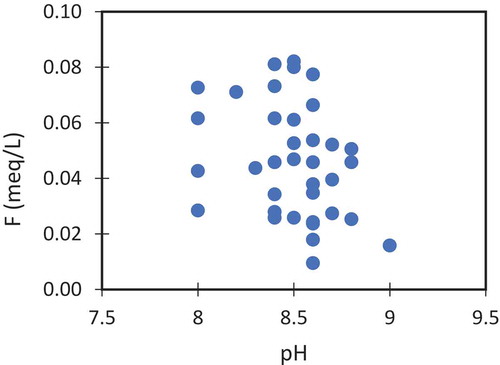
Figure 9. Relation between F¯ and HCO3.
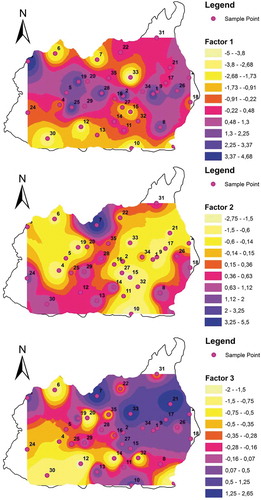
The factor scores of individual water samples were calculated and plotted as a spatial variation map for all the three factors (see ). Spatial mapping is a very useful tool in understanding and visualizing the data and moreover providing options to compare with the other factors like land use, geology, etc., Map of F1 showing the occurrence of higher factor scores in the agricultural and Industrial areas is evident from its comparison with land use map. The higher values ¯are observed in the NW, Eastern and Central part of the study area. Again, it is also supporting the results of cluster analysis. In this way, the F2 score map shows that the higher loading showed by the Northern, SW, and edges of SW boundary of the study area. These regions are mainly forest lands and human settlements. F3 scores are mostly higher in the NW regions and found in patches all over the study area. The important factor is F¯, which is a completely natural component in the groundwater. Dissolution of the fluoride minerals under favorable conditions increase the mobility of this ion. Overall, the cross caparison of the different maps provides refined results.
Figure 10. Spatial distribution of the significant factors scores, F1, F2, and F2, respectively.
Conclusions
Hydrogeochemical investigations in the Lower Bhavani River basin were conducted and the results analyzed using geochemical modeling and statistical techniques. The whole data set was grouped into three different clusters using Hierarchical Cluster Analysis (HCA) and these groups were further analyzed geochemically. The order of dominance of the major cations and anions were Na>Mg>Ca>K and HCO3>Cl>SO4>NO3>F, respectively. A Piper diagram revealed three different hydrochemical facies ranging from CaHCO3(fresh) to Ca-Mg-Cl (mixed) and then finally to NaCl (saline) types. Geochemical modeling of the clusters showed that undersaturation of halite, anhydrate, and gypsum in the groundwater. This shows the possible increase in the concentration of ions like Na, Ca and Cl, SO4. For the source Identification of the contaminants, principal component analysis (PCA) has been performed on the entire data set. Three major components were derived, and which explained more than 80% of the variation in the entire data set. Factor 1 was dominating with high positive factor loadings for TDS, Mg, Na, Cl, HCO3, and NO3. This suggested the influence of high saline textile effluents (Na,Cl), natural geogenic sources (Mg, HCO3) and the presence of NO3 in this group indicating agricultural sources. Factor 1 is showing the mixed influence of natural and anthropogenic sources. Factor 2 was dominated with SO4 and K, these factors were affected by the leakage of sewage. In Factor 3, higher factor loadings were found for Ca and F. Both these ions represent the geogenic contamination and fluoride dynamics in groundwater are largely controlled by the co-occurrence of Calcium. The comparative analysis of the spatial variation maps of each factor with the land use map gives supportive evidence for the origin of contamination from the sources suggested by principal components. Overall groundwater quality has been influenced by natural and anthropogenic sources. For future management of the groundwater ions listed in Cluster 1 need more attention.
Disclosure statement
No potential conflict of interest was reported by the author.
References
- Abu El Ella, E. M., Elnaze, A. A., & Salman, S. A. (2017). The effect of human activities on the pollution of water in southwest Giza area, Egypt. Water Science and Technology: Water Supply, 17, 1368–1376.
- Ahamad, A., Madhav, S., Singh, P., Pandey, J., & Khan, A. H. (2018). Assessment of groundwater quality with special emphasis on nitrate contamination in parts of Varanasi City, Uttar Pradesh, India. Applied Water Science, 8, 115.
- APHA. (1998). Standard methods for the examination of water and wastewater (20th ed.). Washington, DC: American Public Health Association.
- Babiker, I. S., Mohamed, A. M., & Hiyama, T. (2007). Assessing groundwater quality using GIS. Water Resources Management, 21(4), 699–715.
- Balakrishnan, P., Saleem, A., & Mallikarjun, N. D. (2011). Groundwater quality mapping using geographic information system (GIS): A case study of Gulbarga City, Karnataka, India. African Journal of Environmental Science and Technology, 5, 1069–1084.
- CGWB. (2008). District groundwater brochure Erode district, Tamil Nadu (Technical Report series). Chennai, India: Central Groundwater Board, South Eastern Coastal Region.
- Dar, I. A., Sankar, K., & Dar, M. A. (2011). Spatial assessment of groundwater quality in Mamundiyar basin, Tamil Nadu, India. Environmental Monitoring and Assessment, 17 17 178, 437–447. doi:10.1007/s10661-010-1702-2
- Elango, L., Kannan, R., & Senthil Kumar, M. (2003). Major ion chemistry and identification of hydrogeochemical processes of groundwater in a part of Kancheepuram district, Tamil Nadu, India. Journal of Environmental Geoscience, 10, 157–166.
- El-Fadel, M., Tomaszkiewicz, M., Adra, Y., Sadek, S., & Najm, M. A. (2014). GIS-based assessment for the development of a groundwater quality index towards sustainable aquifer management. Water Resources Management, 28, 3471–3487.
- GSI. (1995). Geological and mineral map of Tamil Nadu and Pondicherry (Published in 1: 500,000 scale by the Director General, Geological Survey of India). Kolkatta, India: Geological survey of India.
- Guler, C., Thyne, D. G., McCray, J. E., & Turner, A. K. (2002). Evaluation of graphical and multivariate statistical methods for classification of water chemistry data. Hydrogéologie, 10, 455–474.
- Gulgundi, M. S., & Shetty, A. (2018). Groundwater quality assessment of urban Bengaluru using multivariate statistical techniques. Applied Water Science, 8, 43.
- Helstrup, T., Jørgensen, N. O., & Banoeng-Yakubo, B. (2007). Investigation of hydrochemical characteristics of groundwater from the Cretaceous-Eocene limestone aquifer in southern Ghana and southern Togo using hierarchical cluster analysis. Hydrogeology Journal, 15, 977–989.
- Kamble, S. R., & Vijay, R. (2011). Assessment of water quality using cluster analysis in coastal region of Mumbai, India. Environmental Monitoring and Assessment, 178, 321–332.
- Kazakis, N., Mattas, C., Pavlou, A., Patrikaki, O., & Voudouris, K. (2017). Multivariate statistical analysis for the assessment of groundwater quality under different hydrogeological regimes. Environmental Earth Sciences, 76, 349.
- Kumari, S., Singh, A. K., Verma, A. K., & Yaduvanshi, N. P. (2014). Assessment and spatial distribution of groundwater quality in industrial areas of Ghaziabad, India. Environmental Monitoring and Assessment, 186, 501–514.
- Liu, C. W., Lin, K. H., & Kuo, Y. M. (2003). Application of factor analysis in the assessment of groundwater quality in black foot disease in Taiwan. The Science of the Total Environment, 313, 77–89.
- Machiwal, D., Jha, M. K., & Mal, B. C. (2011). Assessment of groundwater potential in a semi-arid region of India using remote sensing, GIS and MCDM techniques. Water Resources. Management, 25(3), 1359–1386.
- Merchán, D., Auqué, L. F., Acero, P., Gimeno, M. J., & Causapé, J. (2015). Geochemical processes controlling water salinization in an irrigated basin in Spain: Identification of natural and anthropogenic influence. Science of the Total Environment, 502, 330–343.
- Parkhurst, D. L., & Appelo, C. A. J. (1999). User’s guide to PHREEQC (Version 2) – A computer program for speciation, batch-reaction, one-dimensional transport, and inverse geochemical calculations (Water Resources Investigations Report 99–4259) (pp. 326). Washington, DC: US Geological Survey.
- Pourtaghi, Z. S., & Pourghasemi, H. R. (2012). GIS-based groundwater spring potential assessment and mapping in the Birjand Township, southern Khorasan Province, Iran. Hydrogeology Journal, 22, 643–662.
- Reghunath, R., Murthy, T. R. S., & Raghavan, B. R. (2002). The utility of multivariate statistical techniques in hydrogeochemical studies: An example from Karnataka, India. Water Research, 36, 2437–2442.
- Sajil Kumar, P. J. (2014). Evolution of groundwater chemistry in and around Vaniyambadi industrial area: Differentiating the natural and anthropogenic sources of contamination. Chemie der Erde - Geochemistry, 74, 641–651.
- Sajil Kumar, P. J. (2017). Model Geostatistical modeling of fluoride enrichment and nitrate contamination in the groundwater of Lower Bhavani Basin in Tamil Nadu, India. Modeling Earth Systems and Environment, 3, 1.
- Sajil Kumar, P. J., & James, E. J. (2016). Identification of hydrogeochemical processes in the Coimbatore district, Tamil Nadu, India. Hydrological Sciences Journal, 61, 19–731.
- Singh, C. K., Kumar, A., Shashtri, S., Kumar, A., Kumar, P., & Mallick, J. (2017). Multivariate statistical analysis and geochemical modeling for geochemical assessment of groundwater of Delhi, India. Journal of Geochemical Exploration, 175, 59–71.
- Singh, C. K., Shashtri, S., & Mukherjee, S. (2010). Integrating multivariate statistical analysis with remote sensing and GIS for geochemical assessment of groundwater quality: A case study of Rupnagar district in Shiwaliks of Punjab. India. Environmental Earth Sciences, 62(7), 1387–1405.
- Singh, K. P., Malik, A., Mohan, D., & Sinha, S. (2004). Multivariate statistical techniques for the evaluation of spatial and temporal variations in water quality of Gomti River (India): A case study. Water Research, 38, 3980–3992.
- Srinivasamoorthy, K., Nanthakumar, C., Vasanthavigar, M., Vijayaraghavan, K., Rajivgandhi, R., Chidambaram, S., … Vasudevan, S. (2011). Groundwater quality assessment from a hard rock terrain, Salem district of Tamilnadu, India. Arabian Journal of Geosciences, 4(1), 91–102.
- Subramani, T. (2005). Hydrogeology and identification of geochemical processes in Chithar River Basin, Tamil Nadu, India ( Ph.D. Thesis). Anna University, Chennai, India.
- Subramani, T., Rajmohan, N., & Elango, L. (2010). Groundwater geochemistry and identification of hydrogeochemical processes in a hard rock region Southern India. Environmental Monitoring and Assessment, 162, 123–137.
- Teng, Y., Hu, B., Zheng, J., Wang, J., Zhai, Y., & Zhu, C. (2018). Water quality responses to the interaction between surface water and groundwater along the Songhua River, NE China. Hydrogeology Journal. doi:10.1007/s10040-018-1738-x
- Vasanthavigar, M., Srinivasamoorthy, K., Vijayaragavan, K., Ganthi, R. R., Chidambaram, S., Anandhan, P., … Vasudevan, S. (2010). Application of water quality index for groundwater quality assessment: Thirumanimuttar sub-basin, Tamilnadu, India. Environmental Monitoring and Assessment, 171, 595–609.
- Vega, M., Pardo, R., Barrado, E., & Debán, L. (1998). Assessment of seasonal and polluting effects on the quality of river water by exploratory data analysis. Water Research, 32, 3581–3592. doi:10.1016/S0043-1354(98)00138-9
- Venkatesan, G., & Senthil, M. S. (2018). Groundwater quality mapping using geographic information system in Trichy district, Tamil Nadu, India. Water Science and Technology: Water Supply. doi:10.2166/ws.2018.041
- Venkatramanan, S., Chung, S. Y., Ramkumar, T., Gnanachandrasamy, G., Vasudevan, S., & Lee, S. Y. (2015). Application of GIS and hydrogeochemistry of groundwater pollution status of Nagapattinam district of Tamil Nadu, India. Environmental Earth Sciences, 73, 4429–4442.
- Ward, J. H. (1963). Ward’s method. Journal of American Statistical Association, 58, 236–246.
- World Health Organization. (2011). Guidelines for drinking-water quality (4th ed.). Geneva, Switzerland: Author.
- Yidana, S. M., & Yidana, A. (2010). Assessing water quality using water quality index and multivariate analysis. Environmental Earth Sciences, 59, 1461–1473.
- Zahn, M. T., & Grimm, W. D. (1993). Nitrate and chloride loadings as anthropogenic indicators Nitrate and chloride loading as anthropogenic indicators. Water, Air, and Soil Pollution, 68, 469–483.