
 ?Mathematical formulae have been encoded as MathML and are displayed in this HTML version using MathJax in order to improve their display. Uncheck the box to turn MathJax off. This feature requires Javascript. Click on a formula to zoom.
ABSTRACT
Protected area water yield calculation and mapping are of great importance to the conservation planning and resource management. A water yield model based on InVEST was employed to estimate water yield in Periyar Tiger Reserve, a representative in the Southern Western Ghats, Kerala, India. The analysis included land use/land cover, average annual precipitation and potential evapotranspiration, soil depth at various elevation, and plants available water content. The estimated water yield of PTR was 2.33E+09 m3 y-1 with 67% from Periyar river watershed and 33% from Pamba river watershed. A comparison of water-yielding capacity to the forest ecosystems with different vegetations indicates that there is a decreasing trend from evergreen forest, semi-evergreen forest, to grassland-savanna, moist deciduous forest and plantations. It is estimated 37% of evergreen and 24% of semi-evergreen share the major portion of the total water yield, 63.5% of PTR. This study reveals the significance of ecosystem services of the protected area and the importance to conserve and required efficient management.
1. Introduction
Ecosystem services are dominantly used to assess the potential impacts of global change in societal and economic terms and to provide a rationale for environmental management (Tallis, Kareiva, Marvier, & Chang, Citation2008). In order to conserve or manage the environment, there is a requirement for accurate mapping and measurement of ecosystem services (Malinga, Gordon, Jewitt, & Lindborg, Citation2015). Mapping approaches are therefore useful to recognize and implement ecosystem services in decision-making and land management strategies (Maes, Crossman, & Burkhard, Citation2016). Compared with complex models, mapping approaches that use to link vegetation classification and landscape properties with ecosystem services are relatively efficient and easier to ensure timely update of management strategies and policies (Malherbe, Pauleit, & Lorz, Citation2019).
Conventional management practices of Protected Areas (PAs) across the globe are primarily based on the concept of habitat preservation with the least external interference for nature to sustain itself (Karanth, Citation2007; Terborgh, Citation2000). The establishment of tiger reserves in India meant to protect landscape-level features and all life forms for biodiversity conservation with genetic, species and ecosystem diversity (Jhala, Qureshi, & Gopal, Citation2010). These PAs conserve a wide range of ecosystem services and they provide social, economic and cultural benefits. Ecosystem service estimation from a tiger reserve can help in making conservation more significant and thereby it can be evident to the decision-makers and national policy builders (Verma et al., Citation2017).
Water services are one of the prime ecosystem services (ES) benefits of forests, and that could be seen as more important for their impacts to local communities, as vital resources for command area users, and even as large-scale regulators of regional climates through transpiration and cloud formation (Ellison et al., Citation2017; Netzer, Sidman, Pearson, Walker, & Srinivasan, Citation2019). Water yield ecosystem services have a key role in agriculture, aquaculture, industry, and energy generation, healthy life for humans and ecological balance (Burkhard, Kroll, Nedkov, & Müller, Citation2012). Quantity and quality of water access is a basis for the sustainable development and is critical for socio-economic development, healthy ecosystems and for human survival itself (Yu et al., Citation2015). Conserving natural forests and developing capacity to measure and monitor biodiversity and ecosystems for their provisioning services is thus an essential step towards better management of our natural capital (Daily, Citation1997). Water yield valuation is increasingly being used as a tool to communicate the values emanating from natural ecosystems to the policy-makers and thus help in prioritizing conservation and proclaim the free service of the nature to the society (TEEB, Citation2010b).
The Integrated Valuation of Ecosystem Services and Tradeoffs (InVEST) model has been developed to enable decision-makers to assess trade-offs among ecosystem services and to estimate changes in biodiversity under different demographic, land-use, and climate scenarios (Sharp et al., Citation2014; Tallis et al., Citation2010). InVEST was developed as part of the Natural Capital Project (www.naturalcapitalproject.org), the aim being an alignment of economic forces with conservation objectives and mainstreaming the approaches. Evaluation through InVEST water yield model estimates the relative contributions of water produce from different parts of the PA, offering insight into how different vegetations affect annual surface water yield and its spatial distribution (Sharp et al., Citation2014).
Present study the model has been used to assess the water provisioning service being rendered by the watersheds of Periyar Tiger Reserve (PTR). The focus on water services implies a focus on decisions related to PA management, thus requiring spatially explicit descriptions of the landscape and associated hydrologic parameters (Guswa et al., Citation2014; Meisch, Schirpke, Huber, Rüdisser, & Tappeiner, Citation2019).
The national and international scenario requires the quantification of ecosystem services, so they can be included in policy and decision-making regarding forest conservation and management (Olander et al., Citation2018). However, due to the lack of environmental information available in the Sothern Western Ghats area where there are limited or no studies were conducted, greater precision is still needed to understand the water benefits generated by the tiger reserve ecosystem. It is, therefore, necessary to obtain a more robust spatial distribution and its contribution by different vegetations for the water in the PTR watershed using advanced modeling study for understanding ecosystem services.
The aim of this study was to assess annual water yield ecosystem services for the different land-use patterns in the Periyar Tiger Reserve, Southern Western Ghats, India. The analysis was based on forest classification, soil properties, meteorological and biophysical data on InVEST water yield model. The specific objectives of this study were to: (1) quantify surface annual water yield provision of different vegetations in PTR and (2) develop a classification framework among these land-use patterns and their spatial distribution.
2. Study area
Western Ghats (WG) form a mountain range that extends along the coast of Arabian Sea from south of the Tapti River and ending at Kanyakumari at the southern tip of India. This part is classified and considered as one of the world’s richest biodiversity hotspots. The area selected for the study is the Periyar Tiger Reserve in the Periyar-Agsthyamalai landscape. The catchment of Periyar and Pamba rivers gives livelihoods for many rural and urban communities. The protected area is listed in the UNESCO World Natural Heritage Sites in India (Myers, Mittermeier, Mittermeier, Da Fonseca, & Kent, Citation2000).
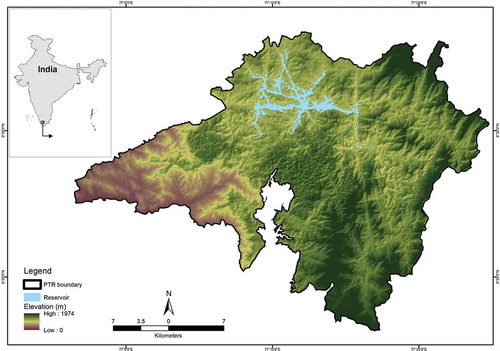
PTR is situated in the Western Ghat Hills and specifically Cardamom and Pandalam Hills of the Southern Western Ghats between latitudes 9° 17ʹ 56.04” and 9° 37ʹ 10.2” N and longitudes 76° 56ʹ 12.12” and 77° 25ʹ 5.52” E (). PTR covers 925 km2 of highly undulating terrain and its elevation ranges from 81 m above MSL (lowest) to 2016 m (highest) with an average elevation of 1200 m. The climate is cool and humid with an average annual rainfall of 2500 mm. The temperature ranges from 15°C to 31°C and the hottest months are April and May, and the coolest months are December and January. The forest vegetation ranges from montane evergreen forests at higher elevations to all other major tropical vegetation types along the lower reaches (Satis, Citation1991).
Figure 1. Location map of Periyar Tiger Reserve
3. Materials and methodology
In this study InVEST (version 3.3.3) is used with input data which include gridded maps of vegetation, soil properties, climate, and some biophysical coefficients. The following sections provide the description of the model and the input data preparation.
3.1. The InVEST water yield model
Water yield in InVEST is defined as the amount of water that runs off the catchment, and it calculates the sum and averages of the water yield based on the principle of water balance at the sub-watershed level.
The water yield model is based on the Budyko curve (Budyko, Citation1974) and the annual average precipitation. The model estimates the total annual water yield (Y) for each grid square (x) of the study catchment as follows:
where AET (x) is the annual actual evapotranspiration for pixel x and P(x) is the annual precipitation on pixel x.
The model assumes that, on an annual time step, all water falling as rainfall over a catchment area, minus that, which is evapotranspired, and leaves the catchment. No distinction is made between the surface and sub-surface water flow.
Practically, the estimation of the catchment and scale measurement of annual actual evapotranspiration is extremely difficult. Even plot scale evaluation requires highly sophisticated equipment, and plot and field scale methods to determine actual evapotranspiration are challenging to apply at the landscape scale (Evans et al., Citation2012).
The evapotranspiration portion of the water balance, for vegetated land use is calculated (Zhang et al., Citation2004) in a spatially explicit way on pixel x by
Potential evapotranspiration PET (x) is defined as:
where ET0(x) is the reference evapotranspiration from pixel x and Kc(lx) is the plant (vegetation) evapotranspiration coefficient associated with the land-use lx on pixel x. ETO(x) reflects local climatic conditions, based on the evapotranspiration of a reference vegetation at that location.
ω(x) is related to the plant available water content (AWC), precipitation and the constant Z which captures the local precipitation pattern and additional hydrogeological characteristics (Equationequation 4(4)
(4) ) (Donohue, Roderick, & McVicar, Citation2012; Sharp et al., Citation2014).
AWC(x) defines the soil texture and effective rooting depth, which establishes the amount of water that can be held and released in the soil for use by a plant. Z is an empirical constant, which captures the local precipitation pattern and additional hydrogeological characteristics. It is positively correlated with N, the number of rain events per year. The constant, 1.25, in EquationEquation (4)(4)
(4) is the minimum value of ω(x) corresponding to bare soil, following Donohue et al. (Citation2012). The water yield model generates the outputs as the total and average water yield at a subwatershed level.
3.2. Data preparation
InVEST Water yield model requires average annual reference evapotranspiration, plant available water content, soil depth, land use/land cover, precipitation, watersheds, and sub-watersheds as well as a biophysical table containing data on biophysical coefficients. All the input data were resampled at a spatial resolution of 30 m and projected using the World Geodetic System 84 (WGS84).
3.2.1. Average annual reference evapotranspiration
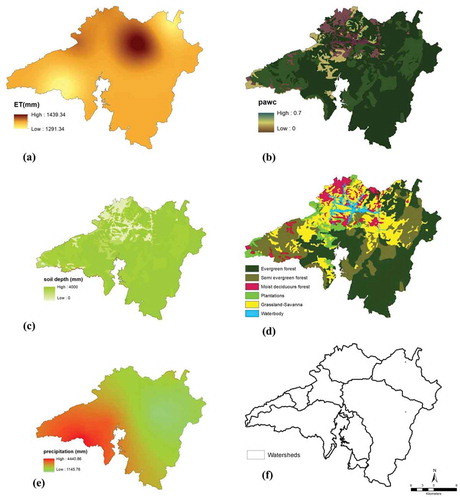
PTR has 10 weather stations and daily mean, maximum and minimum temperature data from the 2007 to 2010 period was collected and used for the analysis. Annual reference evapotranspiration was obtained using the Hargreaves equation (Citation1985). The raster format of average annual reference evapotranspiration generated through the Kriging interpolation ()). Northern region experienced the highest average annual reference evapotranspiration.
Figure 2. (a) Average annual potential evapotranspiration; (b) plant available water content; (c) soil depth; (d) land use and land cover; (e) average annual precipitation; and (f) watershed and sub-watersheds
3.2.2. Plant available water content
Plant available water content (PAWC) is defined as the fraction of water that can be stored in the soil profile that is available for plants use (Zhou, Liu, Pan, & Feng, Citation2005). PAWC was calculated using data from the Soil Survey of India and SPAW Hydrology and Water Budgeting software downloaded from the United States Department of Agriculture and shown in ).
3.2.3. Soil depth
A GIS raster dataset with an average soil depth value for each cell was generated based on the Soil Survey of India datasets. The main soil types of the study area are laterite and alluvial soil and depth values varying from 1 to 5 m (Sekhar, Devkota, & Jetten, Citation2009) and given in ).
3.2.4. Land use/Land cover
Land use/land cover statistics were derived from the forest maps of South India on the scale of 1:250,000 with vegetation classifications published by the French Institute of Pondicherry (FIP), 1992. The whole park had been under a strict conservation regime during the map generation and the duration of 20–25 years can be considered as a short period of time for the natural systems to change. Based on the knowledge of the land cover and ground truth information, six different land cover classes were identified ()) and described in .
Table 1. Land cover statistics and their classification in PTR
3.2.5. Precipitation
The annual precipitation data from 2007 to 2010 of 10 weather stations located in PTR were used for the analysis. The annual mean precipitation raster value in millimeters was generated using the Kriging interpolation method ()). The average annual precipitation was 2777 mm for the period of 2007 to 2010. The higher rainfall experiences in the north-east part of the study area and lower rainfall in the southwest part.
3.2.6. Watersheds and sub-watersheds
Based on the digital elevation model (DEM), the watersheds and sub-watersheds were generated using ArcGIS. Each watershed and sub-watershed is given a unique identification number which is named as ws_id and subws_id. There are nine watersheds and 20 sub-watersheds in PTR. The watersheds layer is presented in ).
3.2.7. Biophysical table
Biophysical table labels land use/land cover classes containing data on biophysical coefficients. These data are attributes of each land use/land cover classes and these parameters are determined with reference to FAO (Allen, Pereira, Raes, & Smith, Citation1998) as shown in .
Table 2. Biophysical details for PTR
3.2.8. Seasonality factor (Z)
Z is an empirical constant that captures the local precipitation pattern and hydrogeological characteristics (Donohue et al., Citation2012). It was estimated as 0.2*N, where N is the average number of rain days (>1 mm) per year over the study period (Hamel & Guswa, Citation2015). Thus, the Z value of PTR is calculated as 30.
4. Result
The estimated water yield of PTR is approximately 2.33E+09 m3 y-1 and its spatial distribution map is given in . Two major rivers in Kerala, namely Periyar and Pamba, originate from the PTR landscape and their watersheds share 67% and 33% of average annual water yield, respectively. Water yield ratio of different forest ecosystems in PTR are depicted in .
Figure 3. Water yield map of PTR
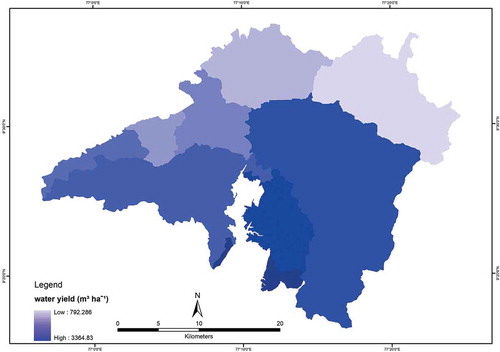
Figure 4. Water yield ratio of different forest ecosystems in PTR
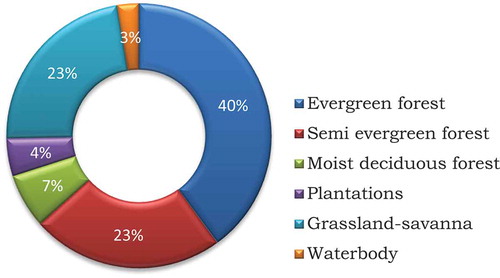
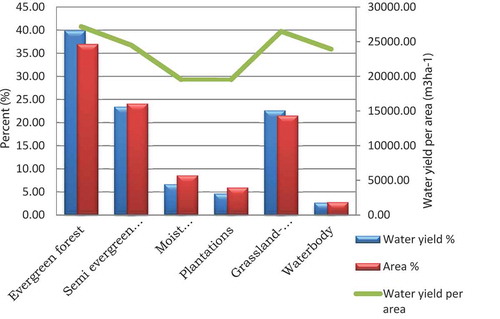
The evergreen and semi-evergreen forest ecosystems contribute 9.29E+08 m3Y-1 (40%) and 5.46E+08 m3Y-1 (23.5%), respectively. Thirty-seven percent of evergreen and 24% of semi-evergreen share the major portion of the total water yield, 63.5% of the PA. Other ecosystems of the moist deciduous forest have 1.55E+08 m3Y-1 (6.5%), grassland-Savanna 5.27E+08 m3Y-1 (22.7%), plantations 1.07E+08 m3Y-1 (4.6%) and waterbody 6.2E+07 m3Y-1 (2.7%) for the total water yield of the study area. The water yield contribution of these different forest ecosystems are shown in . Area and water yield percentage of different ecosystems in PTR is depicted in
Table 3. Area and water yield percentage of different ecosystems in PTR
Figure 5. Water yield of different forest ecosystems in PTR
Periyar river watershed contributes 1.56E+09 m3Y-1 and that of Pamba 7.67E+08m3Y−1 for the average annual water yield of PTR. Out of the nine major watersheds of the study area Periyar and Pamba rivers consist of 4 and 5 nos, respectively. Periyar and Pamba rivers' ratio of different ecosystems are listed in . Periyar has a reservoir that consists of 26 sq.km area and stores the water yield of the Periyar river watershed area.
Table 4. Periyar and Pamba rivers' ratio of different ecosystems
5. Discussion
This study revealed that the water yield ecosystem services of PTR, a natural forest, using the InVEST model and mapped its spatial distribution patterns. The accurate assessments of water yield are important for examining the current distribution and impact of climate change on forest and associated ecosystem services including, water quality in terms of nutrients and sediment, drinking water, crop production and hydropower generation (Redhead et al., Citation2016). With this model we are identifying areas of high water yield in PTR, concentrated efforts can be made by the park management in sustaining the areas with high water yield and also improve upon areas facing degradation.
These studies are useful in terms of their ability to respond to global patterns of precipitation and provide the information necessary for users to assess the water yield at a national or regional scale (Martínez-Harms & Balvanera, Citation2012). This modeling gives the appropriate scale at which the majority of ecosystem service mapping exercises is performed and the most strategic water resource planning takes place (Watts et al., Citation2015). InVEST model-based studies have had the primary aim of quantifying spatial variation and predicted changes in water yield and found to be a good predictor of measured water yield (Bai, Zheng, Ouyang, Zhuang, & Jiang, Citation2013; Boithias et al., Citation2014; Terrado, Acuña, Ennaanay, Tallis, & Sabater, Citation2014; Xiao, Xiao, Ouyang, & Maomao, Citation2015).
6. Conclusions
Water yield calculation and mapping is of a great importance to PA management and conservation planning. The provision of freshwater ecosystem services that contribute to the welfare of society is necessary for the survival of both flora and fauna. Ecosystem service models such as InVEST are the potential tool to provide a crucial underpinning to decision and policy making for national parks. This paper assessed annual water yield ecosystem services for the different land-use patterns in the PTR and quantified the surface annual water yield also their spatial distribution.
The study provides a range of possibilities to inform the general public and the policymakers, a major evidence to state the positive impacts of PAs on human wellbeing. The result shows that the evergreen forest with 40% water yield has a major contribution over PTR annual water yield and then semi-evergreen with 23.5%. It shows the significance of conserving the forest to retain its evergreen nature by its very specialized plant community structure in the Southern Western Ghats region for the water yield ecosystem services. Water yield spatial distribution map of PTR provides an effective tool for conservation prioritization of land use and also a framework for the sub-watershed level appropriate conservation measures.
Biodiversity and ecosystem services in the tiger reserves are natural assets with a key role to play in future sustainable development strategies seeking to combat climate change and find prosperity in India. This study provides a useful initial exploration into the research of ecosystem services at regional scales in a mountainous landscape.
Compliance with Ethical Standards
I confirm that the research paper is complied with all the Ethical standards prescribed by the Human Ecology, An Interdisciplinary Journal.
Ethical Approval
I confirm that this work is original and has not been published elsewhere nor is it currently under consideration for publication elsewhere.
Informed Consent
I confirm the consent to submit the research paper in the Human Ecology, An Interdisciplinary Journal.
Acknowledgments
The authors sincerely thank officers and staff of Periyar Tiger Reserve, Periyar Tiger Conservation Foundation and Kerala Forests & Wildlife Department for their encouragement and support.
Disclosure statement
No potential conflict of interest was reported by the authors.
Additional information
Funding
References
- Allen, R. G., Pereira, L. S., Raes, D., & Smith, M. (1998). Crop evapotranspiration- Guidelines for computing crop water requirements (FAO Irrigation and Drainage Paper 56). Rome: FAO-Food and Agriculture Organization of the United Nations.
- Bai, Y., Zheng, H., Ouyang, Z., Zhuang, C., & Jiang, B. (2013). Modeling hydrological ecosystem services and tradeoffs: A case study in Baiyangdian watershed, China. Environmental Earth Sciences, 70, 709–718.
- Boithias, L., Acuña, V., Vergoñós, L., Ziv, G., Marcé, R., & Sabater, S. (2014). Assessment of the water supply: Demand ratios in a Mediterranean basin under different global change scenarios and mitigation alternatives. Science of the Total Environment, 470–471, 567–577.
- Budyko, M. I. (1974). Climate and life. New York: Academic Press.
- Burkhard, B., Kroll, F., Nedkov, S., & Müller, F. (2012). Mapping ecosystem service supply, demand and budgets. Ecological Indicators, 21, 17–29.
- Daily, G. (Ed.). (1997). Nature’s services: Societal dependence on natural ecosystems. Washington, DC: Island Press.
- Donohue, R. J., Roderick, M. L., & McVicar, T. R. (2012). Roots, storms and soil pores, Incorporating key ecohydrological processes into Budyko’s hydrological model. Journal of Hydrology, 436–437, 35–50.
- Ellison, D., Morris, C. E., Locatelli, B., Sheil, D., Cohen, J., Murdiyarso, D., … Pokorny, J. (2017). Trees, forests and water: Cool insights for a hot world. Global Environmental Change, 43, 51–61.
- Evans, J., McNeil, D., Finch, J., Murray, T., Harding, R., Ward, H., & Verhoef, A. (2012). Determination of turbulent heat fluxes using a large aperture scintillometer over undulating mixed agricultural terrain. Agricultural and Forest Meteorology, 166, 221–233.
- Guswa, A., Brauman, K. A., Brown, C., Hamel, P., Keeler, B. L., & Sayre, S. S. (2014). Ecosystem services: Challenges and opportunities for hydrologic modeling to support decision making. Water Resources Research, 50, 4535–4544.
- Hamel, P., & Guswa, A. J. (2015). Uncertainty analysis of a spatially explicit annual water-balance model: Case study of the Cape Fear basin, North Carolina. Hydrology and Earth System Sciences, 19, 839–853.
- Hargreaves, G. H., & Samani, Z. A. (1985). Reference crop evapotranspiration from temperature. Applied Engineering in Agriculture, 1(2), 96–99.
- Jhala, Y. V., Qureshi, Q., & Gopal, R. S. (2010). Status of the tigers co-predators and prey in India (No. TR 2011/003). New Delhi and Dehradun: National Tiger Conservation Authority and Wildlife Institute of India.
- Karanth, K. K. (2007). Making resettlement work: The case of India’s Bhadra wildlife sanctuary. Biological Conservation, 139(3–4), 315–324.
- Maes, J., Crossman, N. D., & Burkhard, B. (2016). Mapping ecosystem services. In P. Potschin, R. Haines-Young, R. Fish, & R. K. Turner (Eds.), Routledge Handbook of ecosystem services (pp. 188–204). London, UK: Routledge.
- Malherbe, H., Pauleit, S., & Lorz, C. (2019). Mapping the loss of ecosystem services in a region under intensive land use along the Southern coast of South Africa. Land, 8, 51.
- Malinga, R., Gordon, L. J., Jewitt, G., & Lindborg, R. (2015). Mapping ecosystem services across scales and continents – A review. Ecosystem Services, 13, 57–63.
- Martínez-Harms, M. J., & Balvanera, P. (2012). Methods for mapping ecosystem service supply: A review. International Journal of Biodiversity Science, Ecosystem Services & Management, 8, 17–25.
- Meisch, C., Schirpke, U., Huber, L., Rüdisser, J., & Tappeiner, U. (2019). Assessing freshwater provision and consumption in the alpine space applying the ecosystem service concept. Sustainability, 11, 1131.
- Myers, N., Mittermeier, R., Mittermeier, C., Da Fonseca, G., & Kent, J. (2000). Biodiversity hot-spots for conservation priorities. Nature, 403, 853–858.
- Netzer, M. S., Sidman, G., Pearson, T. R., Walker, S. M., & Srinivasan, R. (2019). Combining global remote sensing products with hydrological modeling to measure the impact of tropical forest loss on water-based ecosystem services. Forests, 10, 413.
- Olander, L. P., Johnston, R. J., Tallis, H., Kagan, J., Maguire, L. A., Polasky, S., … Palmer, M. (2018). Benefit relevant indicators: Ecosystem services measures that link ecological and social outcomes. Ecological Indicators, 85, 1262–1272.
- Redhead, J. W., Stratford, C., Sharps, K., Jones, L., Ziv, G., Clarke, D., … Bullock, J. M. (2016). Empirical validation of the InVEST water yield ecosystem service model at a national scale. Science of the Total Environment, 569–570, 1418–1426.
- Satis, C. N. (1991). The Southern Western Ghats – A biodiversity conservation plan. INTACH, New Delhi, India.
- Sekhar, L. K., Devkota, S., & Jetten, V. G. (2009). Prediction of soil depth using environmental variables in an anthropogenic landscape, a case study in the Western Ghats of Kerala, India. Catena, 79(1), 27–38.
- Sharp, R., Tallis, H., Ricketts, T., Guerry, A., Wood, S., Chaplin-Kramer, R., … Olwero, N. (2014). InVEST user’s guide. Stanford: The Natural Capital Project.
- Tallis, H., Kareiva, P., Marvier, M., & Chang, A. (2008). An ecosystem services framework to support both practical conservation and economic development. Proceedings of the National Academy of Sciences, 105, 9457–9464.
- Tallis, H. T., Ricketts, T., Nelson, E., Ennaanay, D., Wolny, S., Olwero, N., … Kennedy, C. (2010). InVEST 1.004 beta user’s guide. The Natural Capital Project. Stanford University, California, USA.
- TEEB. (2010b). Mainstreaming the economics of nature: A synthesis of the approach. Conclusions and recommendations of TEEB. London and New York: Earthscan.
- Terborgh, J. (2000). The fate of tropical forests: A matter of stewardship. Conservation Biology, 14(5), 1358–1361.
- Terrado, M., Acuña, V., Ennaanay, D., Tallis, H., & Sabater, S. (2014). Impact of climate extremes on hydrological ecosystem services in a heavily humanized Mediterranean basin. Ecological Indicators, 37, 199–209.
- Verma, M., Negandhi, D., Khanna, C., Edgaonkar, A., David, A., Kadekodi, G., … Sanjay, K. (2017). Making the hidden visible: Economic valuation of tiger reserves in India. Ecosystem Services, 26, 236–244.
- Watts, G., Battarbee, R. W., Bloomfield, J. P., Crossman, J., Daccache, A., Durance, I., … Hannah, D. M. (2015). Climate change and water in the UK–Past changes and future prospects. Progress in Physical Geography, 39, 6–28.
- Xiao, Y., Xiao, Q., Ouyang, Z., & Maomao, Q. (2015). Assessing changes in water flow regulation in Chongqing region, China. Environmental Monitoring and Assessment, 187, 1–13.
- Yu, J., Yuan, Y., Nie, Y., Ma, E., Li, H., & Xiaoli, G. (2015). The temporal and spatial evolution of water yield in Dali county. Sustainability, 7, 6069–6085.
- Zhang, L., Hickel, K., Dawes, W. R., Chiew, F. H. S., Western, A. W., & Briggs, P. R. (2004). A rational function approach for estimating mean annual evapotranspiration. Water Resources Research, 40, W02502.
- Zhou, W., Liu, G., Pan, J., & Feng, X. (2005). Distribution of available soil water capacity in China. Journal of Geographical Sciences, 15(1), 3–12.