
 ?Mathematical formulae have been encoded as MathML and are displayed in this HTML version using MathJax in order to improve their display. Uncheck the box to turn MathJax off. This feature requires Javascript. Click on a formula to zoom.
ABSTRACT
Rapid urbanization in Addis Ababa and the surrounding area resulted in the rapid land use/land cover (LULC) change that affected landscape structures and ecological functions. This study aimed at quantifying and mapping the spatial patterns of landscape structure for a sustainable city region landscape conservation planning and management. GIS and statistical tools were used to compute important landscape metrics. Pearson Correlation and factor analysis were also applied to reduce redundant indices and identify underlining factor of the landscape structure by network of hexagonal area. The analysis depicted four landscape and four class-level underlined metrics. Accordingly, as the region overall landscape was characterized by patch size and density, shape and texture (interspersion) index, the forest class also attributed by patch size and density, and shape metrics. The result shows that the region landscape planning and management schemes must emphasize on the level of patch fragmentation and landscape complexity to maintain the natural land cover habitat functioning, the amount of ecological process and extent of human intervention. This research will help scientific base decision-making in conservation planning and management of the tropical highland urban landscape in general, and the study area in particular.
1. Introduction
Urban areas, nowadays, are growing at an alarming rate and becoming more complex. Urban built-up, agriculture and other anthropogenic uses take over areas which are previously covered by natural vegetation, particularly forest and other green spaces (Yared, Heyaw, Pauleit, & Mengistie, Citation2019). Such a degradation of the city regions’ vegetation and the rate of their ecosystem functions caused by uncontrolled urban growth and other anthropogenic activities have not yet given much emphasis. Researches also have shown the danger of ignoring the city region (metropolitan area) vegetation. For example, Davies, Hernebring, Svensson, and Gustafsson (Citation2008) presented urbanization and the changing climate as the main factor for more frequent and severe flooding, heat and air pollution. In fact, the notion of the sustainable city brought the relationship of the social and biophysical environment by highlighting the enormous benefits of the urban vegetation and the challenge of its governance and management (Brown et al., Citation2013). The idea of urban green infrastructure thus appears in relation to urban forestry considering the landscape structure planning of cities and city regions to provide an acceptable quality of life for their residents (Simson, Citation2017). Concurrently, studies were dealing more on the identification and quantification of the ecosystem services and goods generated from the city region’s vegetation. For instance, Livesley, McPherson, and Calfapietra (Citation2016) review different researches about the urban forest impact on the urban heat island effect, human thermal comfort, soil and water pollution, urban catchment hydrology and air pollution. Likewise, Nowak et al. (Citation2008) measure urban forest contribution to pollution removal and carbon storage and sequestration. Dobbs, Escobedo, and Zipperer (Citation2011) also indicated soil PH and organic matter as the most influential ecosystem services and goods generated from urban trees.
A mix of remotely sensed data, GIS and the conceptual basis of landscape ecology is helpful to assess and monitor the large-scale ecology (Herold, Scepan, & Clarke, Citation2002; Lausch & Herzog, Citation2002; Mengistie, Schneider, Döllerer, Teketay, & Knoke, Citation2018). The concept of Landscape ecology is an interdisciplinary subject concerned with the interaction between the spatial pattern and ecological process (Li, Ling, Cheng, & Xiao, Citation2001), and it is also an important method to measure the status of the city regions’ LULC configuration and related ecosystem functions. At the same time, the advancement of remotely sensed data and GIS technology gives rise to the concerned experts’ ability to measure the LULC pattern and to have better knowledge about its spatial configuration and landscape structure (Mengistie, Schneider, Teketay, & Knoke, Citation2013). Currently, various landscape metrics that measure both the structural and functional characteristics of the landscape were recognized (Malinowska & Szumacher, Citation2013). Different researches depicted a wide range of its application. Walz (Citation2011) utilized the metrics to investigate, evaluate and measure the relationship between landscape structure and biodiversity. Also, Kim and Stephan (Citation2005) used it to show the level of species richness, patterns of species dispersal and the extent of ecological stability of the different landscapes and Jones, Swanson, Wemple, and Snyder (Citation2000) analyze the ability of landscape metrics to predict nutrient and sediment yield to streams. Therefore, having a clear knowledge and understanding of the structure of the city regions landscape pattern is an important requirement for management decisions on its conservation and development.
The Ethiopian vegetation covers suffered from a wide range of deforestation and some small forest patches remained in inaccessible and marginal areas (Simonian et al., Citation2010; Fikirte, Kumelachew, Mengistie, & Thomas, Citation2017; Habtamu et al., Citation2013, Temesgen, Cruz, Kindu, Turrión, & Gonzalo, Citation2014). At the same time, the deforestation and degradation contribute high for the depletion of the area vegetal cover ecosystem regulating service (Temesgen et al., Citation2018). Terefe, Feyera, and Moges (Citation2016) have shown that the decline of overall ecosystem services by 68%, mainly because of deforestation in the study conducted in the central highlands of Ethiopia. Therefore, the protection of these valuable vegetation covers has a significant impact on the extent of ecosystem functions provided by the system. Wolde (Citation2013) for example, has shown the wide difference between a closure and communal grazing land ecosystem functioning in terms of carbon, total soil nitrogen stock and the availability of phosphorus stock particularly in northern highland areas of Ethiopia.
Specifically, in the study area, Addis Ababa and the surrounding Oromiya region, the problem is more conspicuous. The city and the overall city region vegetation and its ecosystem service’s degradation are mainly caused by the huge dependence of urban and rural areas demand of their product particularly for their fuel wood consumption. For example, Solomon (Citation1985) relates the continuation of Addis Ababa as the capital of the country with the introduction of Eucalyptus tree after long years of wandering on the surrounding hilltops for their fuel wood need. The implication of the cities’ physical expansion also beyond its population size as they have a large ecological footprint which could be even more than their immediate hinterlands. In order to cater to the urban immediate economic need, a huge amount of energy and construction material resources was extracted and utilized. This is also responsible for the degradation of the natural support system and irreversible damage and loss of critical ecosystem functions (Tadesse, Citation2010). On the other hand, Mpofu (Citation2013) showed the sub-Saharan African context, uncontrolled expansion of cities is followed by the degradation of the ecosystem services like sinking or recycling of polluted substances. This deterioration is mainly due to the complexity of managing and regulating the system as it tends to lay across administrative boundaries. Similarly, the study area, Addis Ababa and the surrounding Oromiya Special Zone peri-urban vegetation covers and its landscape functions are suffering with such critical problem.
Studies were conducted on the landscape patterns quantification and mapping, but the urban landscapes of the Afro-mountain region are not well discussed. Some planning document in Ethiopia has lately brought up the notion of landscape in relation to the green infrastructure development (Ministry of Urban Development and Housing) (MUDHo, Citation2016). Mesfin (Citation2009) also made other attempts in measuring the landscape metrics for built-up class of Addis Ababa city only. This research, however, takes into account the comprehensive city region (metropolitan area), and involves the landscape-level and class-level landscape metrics of ecologically valuable land covers such as forest. Such quantification and mapping of the urban landscape pattern therefore have enormous importance in the ecosystem conservation process of the city region. As the case study of Afro-mountain region landscape, Addis Ababa and the surrounding area characterized by rapid built-up growth and deteriorating ecosystem conditions, thus the landscape analysis enables to design the framework for sustainable environmental planning and management. The main objectives of this study are to (1) analyze the study area landscape and class-level metrics and map zonal characteristics of the landscape structure, (2) describe the underlined landscape structure showing Addis Ababa and the surrounding area overall landscape and forest class-level structure, and (3) identify the landscape planning and management schemes for sustainable landscape functioning.
2. Materials and methods
2.1. Study area
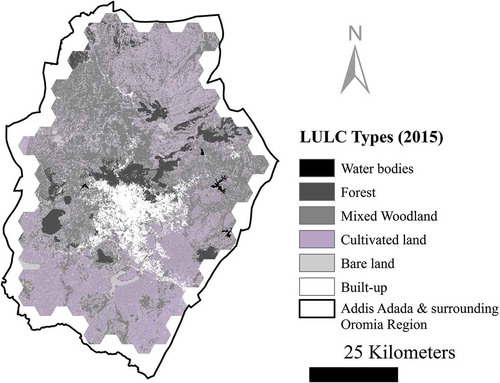
The selected study area encompasses the biophysical environment found within the administrative boundaries of Addis Ababa and the surrounding districts of Oromiya that covers about 4400 sq.km area. In fact, the total area of the regions is 5400 sq.km while the study was conducted on an area of 4400 sq.km, where the proposed hexagonal zones fully overlay on. This area encompasses the major forest patches and other ecologically valuable LULC at the center of the country. It is geographically located between to
latitude and
to
longitude (). The major source and potentials of Addis Ababa green spaces and other ecological functions are from the forest patches found in the peri-urban part of the city and the surrounding Oromiya districts.
Figure 1. Study area map of Addis Ababa and the surrounding Oromiya
2.2. Data used and LULC classification
During the last decade, the study of landscape metrics has been used different types of remotely sensed data (Kirstein & Netzband, Citation2001). A number of landscape structure studies were conducted using Landsat images (Bruce et al., Citation2001; Lu & Qihao, Citation2004; Seto & Michail, Citation2005). We generated the LULC map of the study area through GIS and remote sensing techniques. The main data source to classify the LULC map of this study was Landsat-8 OLI, which scanned on 23rd of December 2015 with a row 168 and path 54.
The LULC classification was made by a supervised classification technique through a maximum likelihood algorithm. For training samples about 60 sample sites of LULC type were chosen. To sharpen the signature selection further, normalized difference vegetation index (NDVI) based unsupervised classification was also used. Then, six end members (LULC types) were selected; these are water bodies, forest, mixed woodland land, cultivated land, bare land, and built-ups. Water bodies mainly include reservoirs and dams. Forest LULC type is essentially forested patches and mixed woodland comprises shrubs and woody grassland. Cultivated land also is a land use with crops and harvested land. Besides, bare land is an area that includes soils, quarries, and exposed rocks, and built-up cover mainly represents roads, parking lots and buildings. Accordingly, this research applied a confusion matrix technique to assess the accuracy of the classification. The producer, user, overall accuracy, and the Kappa coefficients were calculated to check the image classification and signature selection dependability.
2.3. Hexagonal area delineation and zonal landscape metrics statistical computation
The landscape metrics evaluation was undertaken based on the prepared LULC map. To measure the zonal landscape metrics, the overplaying hexagonal area map was prepared as it was more suitable for analyzing the ecological modeling chosen by various studies (Adamczyk & Tiede, Citation2017; Birch, Oom, & Beecham, Citation2007; Schindler, Poirazidis, & Wrbka, Citation2008). This research, therefore, used Arc GIS patch analyst spatial statistics by region tool that enables users to main class and landscape-level analysis on a raster layer for individual polygon regions like the overlying hexagonal zones. This function also permits the analysis of the relationship between the structural characteristics of the landscape and some identified functions or values (Rempel, Kaukinen, & Carr, Citation2012). Of the total area of 54,000 sq.km, 178 full hexagonal zones were taken to support the equal area representation of the selected zones statistical analysis. The network of the hexagon has 25 sq.km and this size designated as an optimal representation of the necessary details and the viability of the data. Thus, the entire 178 hexagonal zones were applied for landscape-level analysis and 66 of them used for class-level forest landscape metrics. In fact, as Adamczyk and Tiede (Citation2017) have shown, the entire landscape metrics may not calculate well in such zonal level evaluation since the specific conditions for calculating landscape metrics within statistical zones that considered as a small subset of the landscape. Therefore, out of the 42 landscape metrics, 31 of them applied for forest class and 35 of them applied for landscape-level measurement.
After the patch analyst landscape metrics computation, the output further evaluated statistically. Some of a highly correlated metrics having the coefficient of greater than or equal to 90%, thus excluded from further analysis to remove redundancy (Griffith, Martinko, & Price, Citation2000). As a result, 17 class-level forest landscape metrics and 16 landscape-level metrics were depicted for further analysis. The statistical treatment of the data hase performed the normality tested to get information about relationship behavior between landscape metrics factor analysis using varimax normalized rotation through Shapiro-Wilk normality test. To identify the number of components first the principal component analysis (PCA) was evaluated. Though different criteria were suggested, in this case, the number of components determined by taking the engine-value greater than one as criteria used by Kevin, Robert, and Tait (Citation1986). Based on the calculated number of components factor analysis was executed. Factor analysis as a data reduction technique applied for a long list of landscape metrics evaluation (Herzog et al., Citation2001; Lausch & Herzog, Citation2002; Schindler et al., Citation2008). Thus, the highest loading of each factor was taken as a representative metric (Herzog et al., Citation2001; Schindler et al., Citation2008). In general, for the LULC and landscape metrics computation, Arc GIS tools were applied, and for statistical measurement, R studio programing language was used.
2.4. Major landscape metrics categories
Although many landscape metrics have been calculated, some of the main metrics computed for this study area have been highlighted. Accordingly, the patch density and size are the important factors that influence a number of basic ecological processes in a landscape. Generally, large patches provide large benefits and small patches have small supplemental benefits (Cook, Citation2002). In addition, large patches of natural vegetation are an important measure of the landscape’s ecological integrity as they protect aquifers and interconnected stream networks. They also enable to bear viable populations of particular species in interior habitats, which provide core habitats and permit near-natural disturbance regimes (Kim & Stephan, Citation2005). The variation of the patch size and density as represented in this study by TLA, MPS, PSSD and PSCov, measuring the level of fragmentation and fractal of a certain LULC type in each zone of the categorical map (Shi et al., Citation2008; Wu et al., Citation2000). For instance, mean patch size (MPS) is a function of the total area of the landscape and the patch number and it is an indicator of grain. Smaller values the index showed a higher fragmentation of the landscape (Kirstein & Netzband, Citation2001).
The grid shape of the LULC arrangement reflects an anthropogenic intervention. However, the shape landscape metrics mainly measure how irregular a certain LULC is, and as the habitats shape becomes more irregular it can also comprise more plant species. Walz (2011) thus indicated how the shape affected the number of species. Therefore, the shape complexity used to asses LULC data as an index for species richness. MPFD, MSI, and AWMSI as a measure of landscape shape showed the level of LULC type irregularity and complexity in this research. For example, MSI calculates to mean patch shape complexity and when all patches are square and increase without limit as patch shape becomes more irregular. In fact, it is the simplest and most straightforward measure of overall shape (McGarigal et al., Citation2002). However, it appears more meaningful when it is related to patch density and size measures like MPS. Since the patch area and perimeter length were used to produce the shape indices. Concurrently, AWMSI calculates the complexity of the patches in the landscape according to their size. Circular patches have an AWMSI value close to one and it increases with patch shape irregularity (Olivier, Rolo, & van Aarde, Citation2017). Larger patches enter more strongly in the calculation than smaller ones do, thus greater values index is the indicator for a higher form variety of the surfaces (Kirstein & Netzband, Citation2001).
Diversity interspersion or configuration metrics are another essential measures. It is basically a spatial characteristic that reflects the spatial distribution of a certain LULC type (Farina, Citation2000). The analysis highly dependent on the resolution of the data and the size of the study area. IJI is an example of a configuration or interspersion measure, calculated from the relationship between the length of edge type and a total edge of the landscape, divided by the number of land-use type. As a result, when the value close to 0, the distribution of adjacencies among patch types becomes increasingly uneven, and when the value equals to 100 means all patch types are equally adjacent to all other patch types (Herzog et al., Citation2001).
In addition, the edge metrics reflect the level of human interference or it eventually measures how the natural state of the environment is (Chmielewski, Kułak, & Malwina, Citation2014). Edge metrics again considered as a representation of landscape configuration. TE is an absolute measure of the total edge length of a particular patch type at the class level or of all patch types at the landscape level (Hakan & Nil, Citation2014). Since this study computes the metrics based on the hexagonal region, it introduced an artificial edge of each hexagonal area and the analysis was executed by cutting the layer with the statistical unit. The main landscape metrics considered in this study are shown in .
Table 1. The Landscape metrics selected for detailed landscape- and class-level analysis
3. Results
3.1. The LULC classification and statistical analysis of landscape metrics
A total of six LULC types were extracted with an overall accuracy of 89% with a kappa coefficient of 0.87 (). From the extracted 4400 sq.km area, depicts that 0.35% occupied by water, 7% of the area is forest, 38% of the area is mixed woodland, 26% of the area is cultivated land, 20% of the area is bare land, and the remaining 8% of the area covered by built-up.
Table 2. Accuracy assessment result by study period
Figure 2. The Land use-land use/land cover map of the study area
The 39 landscape metrics summary statistics are shown in , and it shows the mean, standard division and coefficient of variation for the hexagonal area. The summary gives the general pictures of the quantitative result of the landscape metrics at forest class level and, the overall landscape-level analysis. In this section, the study tries to see at least some of the representative measures of the broader landscape metrics categories (Area, Patch Size and Density, Edge, Shape, Diversity and Interspersion, and Core Area), although the measures are not applied at the landscape level, an average total landscape area of forest- and landscape-level metrics is equal to 2500 hectare, as it is considered the equal-sized hexagonal area. Also, the percentage of landscape area of forest was about 19% with average coefficient of variation (90%). The average number of patches of landscape-level analysis is 1336 and for forest class-level analysis was about 34. The average edge density is relative to an area, and the average edge density of the landscape-level measures was about 198 meter/hectare and average edge density was the forest class was about 22 meter/hectare and. Concerning, shape index the average landscape shape index (LSI) of the landscape level was about 25 and it became about 4 for forest class-level evaluation. Interspersion Juxtaposition Index (IJI), on the other hand, measures how even the patch adjacencies is, thus, in the landscape level analysis it became more even, which is about 76, where as in the forest class level analysis, it was at the middle level evenness and it is about 53. The total size of the computed core patches evaluation showed different values for landscape and forest class-level analysis. The average total core area of landscape-level measures was about 1038 hectare and it appears about 373 hectare for forest class analysis.
Table 3. Summary statistics of 39 computed metrics for hexagonal regions at landscape and class levels
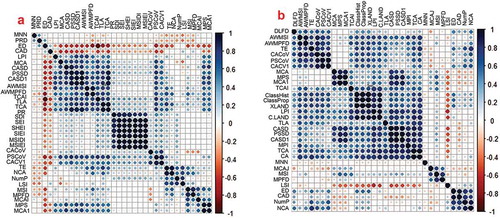
Some of these landscape metrics depicted the redundancy of a certain dimensions, thus the correlation matrix helps to remove such repetitive measurement. The analysis correlates the metrics and the landscape level using 35 metrics with 595 correlation pairs and forest class-level measures using 30 metrics with 435 correlation pairs and. The correlation coefficient matrix of the forest class- and landscape-level metrics portrayed by that showed the relationship between the computed landscape metrics. To make the data suitable for factor analysis and useable for further interpretation it removes some of highly correlated metrics that have the correlation coefficient greater than or equal to 0. 9.
Figure 3. Correlation coefficient of all computed landscape metrics (a) landscape-level correlation matrix and (b) forest class-level correlation matrix
In addition, the factor analysis result depicted that the level of the relationship of the component factors with each landscape metrics. The first four components of the overall landscape and forest class metrics were identified. The factor loading of each metric corresponded with the components, and the orthogonally rotated component matrix has shown in . Regarding the landscape-level analysis, while the first-factor component was highly correlated with PSSD, MPS, Nump and TE, the second component factor has a high correlation with AWMSI and PSCoV. The third component factor also was correlated with MSI and MPFD and the fourth factor was correlated highly with IJI. The first four highest factor loading of orthogonally rotated landscape-level metrics again depicted in the component matrix and the first axis depicted PSSD, the second axis identified AWMSI, the third one picked MPFD and the fourth axis took IJI. Of these, two of them were from shape landscape metrics category (AWMSI and MPFD), one from patch size and density (PSSD) and the other one is from diversity interspersion or texture category (IJI).
Table 4. Factor varimax rotated matrix for the selected class- and landscape-level metrics
Accordingly in the forest class-level metrics, the first component axis has a high relationship with MPS, TCA and MP and the second factor highly correlated with PSSD and AWMSI. Likewise, the third factor has a high correlation with only MPFD and the fourth also factor highly correlated with MSI and Nump. Consequently, the highest component loading is considered to depict one representative metrics, and the analysis helps to select MPS, PSSD, MPFD and MSI representing the first, second, third and the fourth component axis, respectively. Addis Ababa and the surrounding area forest landscape, thus, are highly characterized by shape and patch size and density class-level metrics. Of these four chosen metrics two of them are from the shape (MPFD and MSI) and the other two are from patch size and density (MPS and PSSD) category of the landscape metrics.
Furthermore, the factor analysis data reduction technique helps to identify the underlined landscape structure of the study area and depicted the surrogate metrics to give a special emphasis on the landscape monitoring and conservation planning. Therefore, the landscape-level factor analysis identified PSSD, AWMSI, MPFD and IJI as they contributed the highest loading on the four component axis, and the forest class-level computation depicted MPS, PSSD, MPFD and MSI contributing the highest loadings on the four components. As a result, these eight landscape metrics were representing best as the underlined dimension of the landscape structure and holds majority of other metrics information.
3.2. The pattern of the underlining landscape metrics
The result of the factor analysis is helpful to show the spatial pattern of the representative underlining metrics that configure the comprehensive picture of the area landscape structure. The landscape-level spatial structure reflects a mosaic of the overall LULC types. The most important dimension of the study area landscape structure pattern explained by PSSD, AWMSI, MSI and IJI. The patch size at the landscape-level metrics score highly variable at the center of the region where an area mainly covered by an urban built up and comprise divers LULC type. PSSD, as a measure of patch size deviations, is getting higher in this center and somehow in the northwestern part of the study area. The two shape metrics do not have the same pattern, and a very high value of AWMSI found in the southwestern part and some dispersed spots of high score was seen in the southeast peripheral pat. However, the simple MSI high value mainly found in the northeast and northwest part of the study area were relatively less affected natural environment. The low value of MSI and AWMSI, conversely, was concentrated at the center of the study region that is an area in which high urban built up is dominated. A high IJI also observed at the southwest and south-central part of the region shows that seams all patch types are equally adjacent to all other patch types. Most of the other part appears increasingly uneven ().
Figure 4. Landscape-level landscape metrics pattern
is the map showing the pattern of the landscape metrics based on the factor loading scores of the selected forest class-level landscape metrics. The first two are from patch size and density landscape metrics (MPS and PSSD) that have an almost similar pattern, a high value of the score was dominantly visible around the southwestern and north-central part of the study area, and it extends from south-west to north-eastern side continuously at a different scale. The third and fourth represent the shape category of landscape metrics represented by MPFD and MSI. Though these metrics high score area have the same pattern and extends southwest to northeast direction, and a very high score value of these metrics are dispersed different part of the region with a varying level of gray tone spots. However, this high gray ton spots are mainly visible in the west central, central, northeast central and northern part of the region.
Figure 5. Forest class-level landscape metrics pattern
4. Discussion
Although a number of landscape metrics were identified it is very important to understand the theoretical and the empirical essence of them. For instance, Cushman, McGarigal, and Neel (Citation2008) indicate that most of these landscape metrics are theoretically related and many others are empirically associated due to the consistent integration of different aspects of structure in real landscapes. In fact, few representative metrics could be adequate to capture the landscape pattern. Griffith et al. (Citation2000), for instance, analyze the Kansas area landscape structure by using different data reduction and quantification techniques, Schindler et al. (Citation2008), Herzog et al. (Citation2001) and Lausch and Herzog (Citation2002) also used factor analysis. The correlation analysis in this study showed that the mere relationships of the metrics in describing the Addis Ababa and the surrounding city region’s landscape at class level (forest) and the overall landscape level. The correlation also helps to reduce highly associated metrics and make the data suitable for factor analysis, which enables to choose the underlining landscape metrics for monitoring landscape situation in terms of land-use pattern and structure. When compared with studies conducted in other ecosystems (Schindler et al., Citation2008) it has a similar amount of the overall variance explained by the first four factors of landscape-level analysis. However, other studies (Griffith et al., Citation2000) that contain greater than four-factor component had explained the very little variance. Sufficient research works were not made in quantifying the landscape structure and patterns in Ethiopia and most of the African tropical landscape. Nonetheless, various assessment methods and results produced in other parts of the world can help significantly to refer particularly for a warm and cool temperate highland landscape of the tropics like the study area Addis Ababa and the surrounding.
The landscape-level landscape structure analysis of the study area mainly characterized by patch density, shape and interspersion categories of landscape metrics which are represented by PSSD, AWMSI, MSI, and IJI. The size and patch density metrics help to evaluate the various attributes of patches within the ecosystem. As Cook, Yao, Foster, Holt, and Patrick (Citation2005) indicated that large patches have a large benefit and small patches have small supplementary benefit. The study area landscape mainly characterized by shape indices of AWMSI and MSI. Patch size and shape influence a number of basic ecological processes in a landscape in a particular decrease with increasing human land use (Kim & Stephan, Citation2005). The AWMSI calculates the complexity of the patches in the landscape according to their size and it is a good predictor of birds and species richness pattern (Schindler, von Wehrden, Poirazidis, Wrbka, & Kati, Citation2013). IJI also measures the distribution of adjacencies among different patch types or configuration. Shape with the arrangement of patches of different land-use and cover types is used together with areal statistics-to quantify the landscape structure and composition.
The forest class-level landscape structure of Addis Ababa and the surrounding city region is highly characterized by patch size and density and shape landscape metrics. The analysis depicted MPS and PSSD as the main representative of patch size and density category. Shi et al. (Citation2008) describe the MPS as an indicator of the level of landscape fragmentation or grain, as it gets lower with increased disturbance and human intrusion. Lausch and Herzog (Citation2002) also discussed MPS as an important element of forest patches that determine habitat functioning, particularly if it is combined with core area and neighborhood indices. Likewise, the shape metrics help to examine the most important dimension of the spatial structure of the landscape in many previous studies (Griffith et al., Citation2000; Schindler et al., Citation2008). This study identified the shape metrics of MSI and MPFD that determined the landscape shape complexity and the patch fractal dimension. Therefore, it is a vital dimension to predict birds and plant species richness pattern (Olivier et al., Citation2017). The landscape pattern map of the area again helps to prioritize the specific zone or locality and monitor the functions for proper conservation planning and management that helps to maintain the stated benefits of the landscape analysis.
Generally, landscape metrics are a useful tool for incorporating ecological knowledge in planning and management. One of the most important concepts is that landscape pattern strongly influences the ecological process and characteristics. Moreover, it describes how the spatial structure influences the most fundamental ecological process, and how landscape planning and management intern influences the landscape structure.
As discussed above, four class levels and four landscape-level metrics were distinguished pertaining to the area landscape structure based on their factor loading. The metrics were the best representative of a large information generated by other metrics and form a core set of the structural characteristics of landscape monitoring, and they are then helpful to address the main requirements to apply to the landscape structure analysis.
The conservation planning, management schemes thus focusing on the forest LULC and the overall landscape mosaic. As this city region hosts some of the indispensable mountain forest and other green spaces that support the main landscape services and goods needs, particularly through nutrient up taking and biodiversity maintenance entails the special emphasis in this research. Therefore, any changes in composition and configuration of the landscape demand analysis of a different evaluation technique. At the same time, the knowledge generated in this analysis also is useful to confront the challenge through different intervention technique. The mountain forest and other green spaces in the city region have to be maintained, and efforts of land-use management should be supported by the landscape structure analysis, and this analysis also helps to measure the improvements due to the attempts of conservation not only in this study area but also the highland area of the tropical city region’s landscape.
5. Conclusions
Landsat and other similar remotely sensed satellite imageries offer valuable information helps to map the landscape configurations that raised the interests of environmental planners and managers. Alongside, the digital mapping and statistical quantification packages brought the LULC maps with a wide range of landscape metrics that gives-rise to a new conception and techniques of processing in the field of landscape ecology and remote sensing. The rapid development in these technologies, thus, enable to measure the sophisticated levels of landscape structure, ecological functioning and attempts were also made to monitor or manage a very large, multi-jurisdictional landscapes more often now. The landscape pattern mapping and quantification, currently, appears one of the important urban landscape planning and management instrument that helps to measure the extent of fragmentation, networking, species richness and other functions of the given ecosystem or LULC types. The potential of landscape metrics yields information on landscape pattern to develop the environmental LULC indicators for different parts of the earth.
Ethiopian highlands were one of the important examples to study Afro-mountain urban landscape structures. This study thus has a significant role in the Addis Ababa and the surrounding area’s landscape ecology to provide comprehensive knowledge for the city region decision-making organ. The analysis mainly used Arc GIS patch analyst, statistical tools to compute 39 metrics for 178 hexagonal zones of landscape-level and 66 hexagonal zones of forest class metrics. Out of which the correlation matrix computes 35 landscape-level and 30 forest class-level metrics scoring 0.9, and the above coefficient of variation was omitted to remove repetition. The multivariate factor analysis measured 17 class- and 16 landscape-level metrics and the analysis, then identified 4 forest class- and 4 landscape-level metric that has a higher component loading. Accordingly, it depicted PSSD, AWMSI, MPFD and IJI for landscape-level, and MPS, PSSD, MPFD and MSI for forest class-level analysis that have to be given special emphasis for any landscape monitoring scheme. Therefore, the landscape conservation planning and monitoring endeavors should focus on the level of patch fragmentation that determines the habitat functioning level on natural land covers like forest, the growth of dispersed built-up and sprawling in urban areas. In addition, it also concerned on maintaining the natural landscape complexity that determines the number of ecological processes and the extent of human intervention. The maps showing the pattern of the underlining landscape metrics also portrayed the level of priority of space that has to be given for a set of conservation mechanism and monitoring scheme.
On the whole, the Addis Ababa and the surrounding city-region landscape structure analysis and mapping of its spatial pattern are helpful to maintain the region’s landscape ecology as they have a valuable role in biodiversity conservation and maintaining species richness, increasing nutrient up taking capacity and ecosystem connectivity, etc. In a nutshell, the spatial landscape structure metrics have a vital role to analyze, monitor and providing a comprehensive understanding of a given landscape pattern. This study also explored the underlined landscape structure metrics and their implication on the sustainable ecological conservation planning and management of the tropical highland urban landscape in general and the study area in particular.
Some of the important concerns of future studies in the area could be stated as follows. Using a very-high spatial resolution satellite imageries less than the 30 m helps to identify a comprehensive urban land uses. Urban areas typically exhibit spatially heterogamous LULC. This study considers the whole urban built-up as one class, however these very high-resolution images enable to group further with other classes like residential, commercial and industrial. It is also possible to classify the vegetation cover in different types and this may again strengthen the interpretation more exhaustively and to measure the class-level metrics of each LULC classes specifically. In addition, this study mainly analyzes the spatial configuration of the landscape structure by taking a given time. While the temporal dynamics of this landscape is another weak-spot of the study, essentially, urban landscape is rapidly altered through time, thus it is necessary to deal on this aspect.
Acknowledgments
We gratefully acknowledge the financial support from Addis Ababa University Office of the Director of Research under the thematic research title “Resource efficiency, environmental quality and sustainability of urban areas in Ethiopia”, Grant no. TR/11/2013.
Disclosure statement
No potential conflict of interest was reported by the authors.
References
- Adamczyk, J., & Tiede, D. (2017). ZonalMetrics – A python toolbox for zonal landscape structure analysis. Computers and Geosciences, 99, 91–99.
- Birch, C. P. D., Oom, S. P., & Beecham, J. A. (2007). Rectangular and hexagonal grids used for observation, experiment and simulation in ecology. Ecological Modelling, 206(3–4), 347–359.
- Brown, D., Band, L. E., Green, K. O., Irwin, E. G., Jain, A., Lambin, E. F., ... & Verburg, P. H. (2013). Advancing Land Change Modeling: Opportunities and Research Requirements. Washington, D.C.: The National Academies Press.
- Bruce, J. K., Neale, A. C., Nash, M. S., Van Remortel, R. D., Wickham, J. D., Riitters, K. H., & O’Neill, R. V. (2001). Predicting nutrient and sediment loadings to streams from landscape metrics: A multiple watershed study from the United States Mid-Atlantic region. Landscape Ecology, 16(4), 301–312.
- Chmielewski, T. J., Kułak, A. A., & Malwina, M.-Ś. (2014). How to evaluate and forecast changes in landscape image: The case of a Small River Valley in Poland. Landscape Research, 40(4), 466–475.
- Cook, E. A. (2002). Landscape structure indices for assessing urban ecological networks. Landscape and Urban Planning, 58, 269–280.
- Cook, W. M., Yao, J., Foster, B. L., Holt, R. D., & Patrick, L. B. (2005). Secondary succession in an experimentally fragmented landscape : Community patterns across space and time. Ecology, 86(5), 1267–1279. Retrieved from https://pdfs.semanticscholar.org/f241/2b450567d7abdec72932ce5dec2b744a6800.pdf
- Cushman, S. A., McGarigal, K., & Neel, M. C. (2008). Parsimony in landscape metrics: Strength, universality, and consistency. Ecological Indicators, 8(5), 691–703.
- Davies, S. A., Hernebring, C., Svensson, G., & Gustafsson, L. G. (2008). The impacts of climate change and urbanisation on drainage in Helsingborg, Sweden: Combined sewer system. Journal of Hydrology, 350, 100–113.
- Dobbs, C., Escobedo, F. J., & Zipperer, W. C. (2011). A framework for developing urban forest ecosystem services and goods indicators. Landscape and Urban Planning, 99, 196–206.
- Farina, A. (2000). Landscape ecology in action (1st ed ed.). Venice, Italy: Kluwer Academic Publishers, Springer Science+Business Media Dordrecht.
- Fikirte, D., Kumelachew, Y., Mengistie, K., & Thomas, S. (2017). Land use/land cover changes and their causes in libokemkem district of South Gonder, Ethiopia. Remote Sensing Applications: Society and Environment, 8(April), 224–230.
- Griffith, J. A., Martinko, E. A., & Price, K. P. (2000). Landscape structure analysis of Kansas at three scales. Landscape and Urban Planning, 52, 45–61.
- Habtamu, T., Nyssen, J., Zenebe, A., Haregeweyn, N., Kindu, M., Lemenih, M., & Haile, M. (2013). Ecological succession and land use changes in a lake retreat area (Main Ethiopian Rift Valley). Journal of Arid Environments, 91, 53–60.
- Hakan, A., & Nil, Ç. (2014). Mapping spatial variations of land cover in a coastal landscape using pattern metrics. Procedia - Social and Behavioral Sciences, 120, 23–30.
- Herold, M., Scepan, J., & Clarke, K. C. (2002). The use of remote sensing and landscape metrics to describe structures and changes in urban land uses. Environment and Planning A, 34(8), 1443–1458.
- Herzog, F., Lausch, A., Müller, E., Thulke, -H.-H., Steinhardt, U., & Lehmann, S. (2001). Landscape metrics for assessment of landscape destruction and rehabilitation. Environmental Management, 27(1), 91–107.
- Jones, J. A., Swanson, F. J., Wemple, B. C., & Snyder, K. A. I. U. (2000). Effects of roads on hydrology, geomorphology, and disturbance patches in stream networks. Conservation Biology, 14(1), 76–85.
- Kevin, F. J., Robert, C. M., & Tait, M. (1986). The application of exploratory factor analysis in applied psychology: A critical review and analysis. Personnel Psychology, 39(2), 291–314.
- Kim, K. H., & Stephan, P. (2005). Landscape metrics to assess the ecological conditions of city regions: Application to Kwangju City, South Korea. International Journal of Sustainable Development and World Ecology, 12(3), 227–244.
- Kirstein, W., & Netzband, M. (2001). Landscape Metrics as a Tool for the Comparison of Different Urban Regions. Remote Sensing of Urban Areas/Fernerkundung in urbanen Räumen. Regensburger Geographische Schriften, (35).
- Lausch, A., & Herzog, F. (2002). Applicability of landscape metrics for the monitoring of landscape change: Issues of scale, resolution and interpretability. Ecological Indicators, 2(1–2), 3–15.
- Li, X., Ling, L., Cheng, G., & Xiao, H. (2001). Quantifying landscape structure of the heihe River Basin, North-West China using FRAGSTATS. Journal of Arid Environments, 48(4), 521–535.
- Livesley, S. J., McPherson, G. M., & Calfapietra, C. (2016). The urban forest and ecosystem services: Impacts on urban water, heat, and pollution cycles at the tree, street, and city scale. Journal of Environment Quality, 45(1), 119. Retrieved from https://dl.sciencesocieties.org/publications/jeq/abstracts/45/1/119
- Lu, D., & Qihao, W. (2004). Spectral mixture analysis of the urban landscape in indianapolis with Landsat ETM+ imagery. Photogrammetric Engineering & Remote Sensing, 70(9), 1053–1062. Retrieved from http://openurl.ingenta.com/content/xref?genre=article&issn=0099-1112&volume=70&issue=9&spage=1053
- Malinowska, E., & Szumacher, I. (2013). Application of landscape metrics in the evaluation of geodiversity. Miscellanea Geographica – Regional Studies On Development, 17(4), 28–33.
- McGarigal, K., Cushman, S. A., Neel, M. C., & Ene, E. (2002). FRAGSTATS: spatial pattern analysis program for categorical maps. Computer software program produced by the authors at the University of Massachusetts, Amherst. Available at the following web site: www. umass. edu/landeco/research/fragstats/fragstats. html, 6.
- Mengistie, K., Schneider, T., Döllerer, M., Teketay, D., & Knoke, T. (2018). Scenario modelling of land use/land cover changes in Munessa-Shashemene landscape of the Ethiopian Highlands. Science of the Total Environment, 622–623, 534–546.
- Mengistie, K., Schneider, T., Teketay, D., & Knoke, T. (2013). Land use/land cover change analysis using object-based classification approach in Munessa-Shashemene landscape of. Remote Sensing, 5, 2411–2435.
- Mesfin, T. B. (2009). Spatial metrics and Landsat data for urban landuse change detection in Addis Ababa (Ethiopia Spatial Metrics And Landsat Data For Urban Landuse Change Detection In Addis Ababa). Ethiopia: Universitat Jaume I.
- Mpofu, T. P. Z. (2013). Environmental challenges of urbanization: A case study for open green space management. Research Journal of Agricultural and Environmental Management, 2(4), 105–110. Retreieved from http://www.apexjournal.org
- MUDHo. 2016. Rivers and River Buffer Green Infrastructure Design Standard Implementation, Manual. Addis Ababa, Ministry of Urban Development and Housing.
- Nowak, D. J., Crane, D. E., Stevens, J. C., Hoehn, R. E., Walton, J. T., & Bond, J. (2008). A ground-based method of assessing urban forest structure and ecosystem services. Arboriculture & Urban Forestry, 34(6), 347–358. Retrieved from https://www.itreetools.org/eco/resources/08UFORE.pdf
- Olivier, P. I., Rolo, V., & van Aarde, R. J. (2017). Pattern or process? Evaluating the peninsula effect as a determinant of species richness in coastal dune forests. PloS One, 12(4), e0173694. Retrieved from http://journals.plos.org/plosone/article?id=10.1371/journal.pone.0173694
- Rempel, R. S., Kaukinen, D., & Carr, A. P. (2012). Patch analyst and patch grid. Ontario Ministry of Natural Resources. Centre for Northern Forest Ecosystem Research, Thunder Bay, Ontario.
- Schindler, S., Poirazidis, K., & Wrbka, T. (2008). Towards a core set of landscape metrics for biodiversity assessments: A case study from Dadia National Park, Greece. Ecological Indicators, 8(5), 502–514.
- Schindler, S., von Wehrden, H., Poirazidis, K., Wrbka, T., & Kati, V. (2013). Multiscale performance of landscape metrics as indicators of species richness of plants, insects and vertebrates. Ecological Indicators, 31, 41–48.
- Seto, K. C., & Fragkias, M. (2005). Quantifying spatiotemporal patterns of urban land-use change in four cities of China with time series landscape metrics. Landscape ecology, 20(7), 871-888.
- Shi, Y., Xiao, J., & Shen, Y. (2008). Landscape pattern change and associated environmental implications in the Haihe River Basin, China. ISPRS J. Photogramm. Remote Sens, 37, 569-574.
- Simson, A. J. (2017). Landscape structure planning and the urban forest in polycentric city regions. IOP Conference Series: Earth and Environmental Science, 61(1), 012025.
- Simonian, L., Hernández Munguía, J. G., Arana Noguera, G. A., Thomas, L., Middleton, J., & Phillips, A. (2010). Global forest resources assessment 2010: main report (No. FAO FP-163). FAO, Rome, Italy, 340.
- Solomon Mulugeta. (1985). Meeting the Housing Shortage in Addis Ababa: The Case of Housing Cooperatives (Doctoral dissertation, MA Thesis. Addis Ababa, Addis Ababa University).
- Tadesse, A. (2010). Review of the urban environment in Ethiopia in 2008. ed. Edwards. Addis Ababa: Forum for Environment.
- Temesgen, D., Cruz, F., Kindu, M., Turrión, M. B., & Gonzalo, J. (2014). Land-Use/Land-Cover (LULC) change and socioeconomic conditions of local community in the central highlands of Ethiopia. International Journal of Sustainable Development & World Ecology, 21(5), 406–413.
- Temesgen, G., Tulu, T., Argaw, M., Worqlul, A. W., Tolessa, T., & Kindu, M. (2018). Estimating the impacts of land use/land cover changes on ecosystem service values : The case of the Andassa watershed in the Upper Blue Nile Basin of Ethiopia”. Ecosystem Services, 31, 219–228.
- Terefe, T., Feyera, S., & Moges, K. (2016). Landscape composition and configuration in the central highlands of Ethiopia. Ecology and Evolution, 6(20), 7409–7421.
- Walz, U. (2011). Landscape structure, landscape metrics and biodiversity. Living reviews in landscape research. 5 (3), 1–35.
- Wolde, M. (2013). Changes in regulating ecosystem services following establishing exclosures on communal grazing lands in Ethiopia: A synthesis. Journal of Ecosystems, 2013, 1–12.
- Wu, J., Jelinski, D. E., Luck, M., & Tueller, P. T. (2000). Multiscale analysis of landscape heterogeneity: scale variance and pattern metrics. Geographic information sciences, 6(1), 6-19.
- Yared, G., Heyaw, T., Pauleit, S., & Mengistie, K. (2019). Urban green spaces supply in rapidly urbanizing countries: The case of. Remote Sensing Applications: Society and Environment, 13, 138–149.