
 ?Mathematical formulae have been encoded as MathML and are displayed in this HTML version using MathJax in order to improve their display. Uncheck the box to turn MathJax off. This feature requires Javascript. Click on a formula to zoom.
ABSTRACT
In the present study, an effort was made in Kashmir Valley, NW-Himalayas to delineate potential groundwater areas using GIS and Analytical Hierarchy method (AHP) by incorporating remote sensing data with data from other sources. These data sets were used to prepare eight thematic layers of slope, soil texture, drainage density, land/land cover (LULC), lithology, geomorphology, lineament density, and rainfall. The analytical method of AHP pair wise matrix was used to evaluate the normalized weight of these thematic layers. All the thematic layers and their corresponding classes were allocated ranks and weights based on their impact on groundwater potential. The study area has been classified into five different potential groundwater recharge zones — excellent (28.97%), good (19.99%), moderate (21.70%), poor (27.16%) and very poor (2.15%). The groundwater potential map prepared for the study area has been validated with 245 existing bore-wells and flow direction of basin. The validation of results was in agreement with the evidence obtained as Area Under Curve (AUC) was calculated to be 79.69% and flow computational investigations which suggest groundwater flows north-eastward from south of basin up to central Kashmir, and south-westward from North towards Jhelum River. The validation suggests that the applied method proves to give us a very significant and reliable result for the study area.
1. Introduction
Groundwater is one of the most precious and important component in the natural water cycle stored under the water table in pore spaces of soil/rock (Fitts, Citation2002). Its availability serves as a source of an essential component in the domestic, agriculture, and socio-economic development activities (Ayazi et al., Citation2010; Pradhan, Citation2009). The increasing demand for water for the domestic, irrigation and industrial sectors has created increasing pressure on this natural resource which is a point of concern in highly populated and industrialized nations of the world, such as India, China, African country (Das et al., Citation2017; Manap et al., Citation2011). Urbanization, deforestation, and industrialization have serious implications for groundwater quantity and quality (Mondal & Dalai, Citation2017; Singh, Zeddies, Shankar, & Griffiths, Citation2019; Todd & Mays, Citation2005). Ground water extraction for household, agricultural, and industrial purposes is estimated as 36%, 42%, and 27%, respectively, worldwide (Taylor et al., Citation2013). Groundwater provides 80–90% of the Indian rural population’s domestic water supply (Agarwal & Garg, Citation2016) and 50% of water demand by the urban population and industrial sector depends on groundwater. In highly populated country like India, groundwater uses for irrigation is over 50% of the agricultural land (Central groundwater board annual report, Citation2014). The use of groundwater resources in India is very extensive and uncontrolled (Rodell, Velicogna, & Famiglietti, Citation2009). As a result of scarce availability, many parts of India face high water stresses (NITI Aayog – annual report Citation2017–2018) and continuous extraction has resulted in aquifer-stress and deterioration in quality (World Bank, Citation2011). A similar scenario can be seen in other highly populated country.
Several researchers globally have used different techniques to identify potential groundwater recharge zones such as frequency ratio (Al-Abadi, Al-Temmeme, & Al-Ghanimy, Citation2016; Balamurugan et al., Citation2017 Das & Pardeshi, Citation2018b; Guru, Seshan, & Bera, Citation2017; Ozdemir, Citation2011; Naghibi et al., Citation2015a,b; Razandi, Pourghasemi, Neisani, & Rahmati, Citation2015). Logistic regression model techniques (Ozdemir, Citation2011; Pourtaghi & Pourghasemi, Citation2014), random forest model (Golkarian & Rahmati, Citation2018; Naghibi, Pourghasemi, & Dixon, Citation2016), decision tree model (Chenini, Mammou, & El May, Citation2010, Lee and Jones-Lee, Citation1999); artificial neural network (Naghibi, Pourghasemi, & Abbaspour, Citation2018), and evidential belief function (Nampak, Pradhan, & Manap, Citation2014).
The remote sensing method offers systemic, synoptic, and quick repetitive region coverage as a result, it is an important tool for acquiring short-term spatiotemporal data from a very large area (Leblanc et al., Citation2003; Tweed, Leblanc, Webb, & Lubczynski, Citation2007). GIS provides a platform to effectively handle comprehensive and complicated spatial-temporal information (Wieland & Pittore, Citation2017). Nowadays, the extensive accessibility and use of satellite data with standard maps and terrain procedures have facilitated the creation of basic information for assessing prospective groundwater potential regions (Dar, Sankar, & Dar, Citation2010; Ganapuram et al., Citation2009; Jasrotia, Kumar, & Singh, Citation2016; Krishnamurthy, Venkatesa Kumar, Jayaraman, & Manivel, Citation1996; Madrucci, Taioli, & deArau´jo, Citation2008; Magesh et al., Citation2011a, ; Mallick et al., Citation2014, Sahu & Sikdar, Citation2011; Saraf & Choudhury, Citation1998; Solomon & Quiel, Citation2006; Srivastava & Bhattacharya, Citation2006). Mishra et al. (Citation2010) and Jyoti Sarup (Citation2011) have used the remote sensing and GIS for potential groundwater recharge zones as well as identification of suitable site structures for artificial recharge. Most of the methods used in these research works are based on bivariate and multivariate statistical techniques with pre-investigation assumptions and limitations (Thapa, Gupta, Guin, & Kaur, Citation2017). But studies on remote sensing and GIS coupled with the AHP approach in identifying potential groundwater recharge zones are carried out by few. Some researchers which have delineated potential groundwater recharge zones with Integrated AHP method along with RS and GIS have come up with satisfactory results like, Arulbalaji et al., Citation2019 prepare 12 thematic layers using RS and GIS to delineate the potential areas of groundwater in Southern Western Ghats, India, the weights calculated with AHP, were allocated for each layer. The resulting map of the study region was cross-validated with bore-well information and it was found that the accuracy of the map was 85%. Das, 2018 defines the groundwater potential areas by integrating AHP methods with RS-GIS at Puruliya district, West Bengal, India. The results were validated with the groundwater yield of wells. Results suggest that out of 14 wells 10 (71.43%) matches with the expected yield class. Besides, the AHP has been successfully applied in several studies of water resource management and in groundwater study by integrating multi-criteria decision analysis (MCDA) (Saaty, Citation1980, Citation1986, Citation1994) with RS and GIS techniques. The method of AHP is regarded as a straightforward, transparent, efficient, and reliable method for multi-criteria decision analysis (Machiwal et al., Citation2011a, Citation2011b). Increasing extraction of this water resource has drawn considerable attention among researchers to use cost-effective methodology for delineation of potential groundwater recharge zones which can help in comprehensive planning and water resource management (Senanayake, Dissanayake, Mayadunna, & Weerasekera, Citation2016). It is very essential to identify and plan for the optimum usage and conservation of groundwater potential areas (Hutti & Nijagunappa, Citation2011). Several geophysical and geological methods for determining the location of aquifers and groundwater table are considered to be much reliable, but these methods are very costly and time-consuming for finding availability of groundwater resources in a region (Changnon, Huff, & Hsu, Citation1988; Fetter, Citation1994; Israil, Al-Hadithi, & Singhal, Citation2006). Remote sensing integration with GIS has emerged as indirect method and cost-effectiveness to map groundwater resources, exploratory and management systems (Adiat & Abdullah, Citation2012; Chowdhury, Jha, Chowdary, & Mal, Citation2009). Hence, we employed AHP, GIS, and RS techniques to integrate hydrogeological, geomorphologic as well as climatic data to delineate potential groundwater recharge zone in one of the mountainous Kashmir Valley. People in the region depends upon groundwater for their domestic and agriculture purposes. The elevation of the area is very steep and surrounded by mountainous terrains. Water resources and demand vary both spatially and temporarily. It appears to us unlikely that such type of cost-effective study has been reported till now from the study area. Such type of study should prove as being of high relevance and topic crucial to the timely assessment of groundwater potential. This study highlights the importance of an integrated RS, GIS, and AHP model for the implementation of an efficient and low-cost approach to do potential groundwater recharge zonation in mountainous terrain which is much complex in terms of lithology, geomorphology, slope, precipitation, etc., and the method to be applied in other regions of similar characteristics. In this context, the current study uses an integrated RS, GIS, and AHP approach for (1) The development of thematic data layers for the potential groundwater recharge zone development (2) Identifying and delineating potential groundwater recharge zone by integrating these various thematic layers (3) Validation of the resulted potential groundwater recharge zone with Receiver Operating Characteristic (ROC) curve. The major purpose of delineating the groundwater potential zones of the study area was to develop a prospective guide map for groundwater exploration/exploitation to ensure optimum and sustainable development and management of groundwater resources.
2. Study area
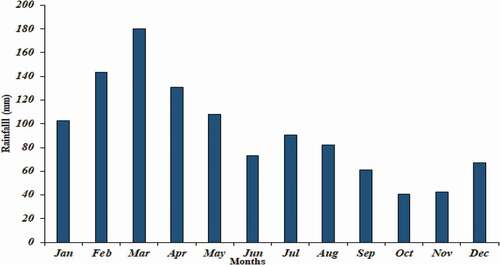
The study was carried out in the inter-montane valley of Kashmir valley, which is surrounded by the Great Himalayan Range towards Northwest and Pir-Panjal Range to the southwest and located between latitudes of 32°17ʹ −36°58ʹN and longitudes 73°26–75°25ʹ E (). Kashmir Valley is known to have a full stratigraphic record of rocks of all ages from Archean to Recent for geological importance (Ganju & Khar, Citation1984; Middlemiss, Citation1909, Citation1910; Wadia, Citation1975). Kashmir Valley averages 140 km in length and 40 km in width, an average altitude of 1850 m (amsl) covering an area of 5200 Km2(Agrawal et al., Citation1979). The valley floor is covered with floodplains and the recent alluvium throughout the length of Kashmir Valley on banks of the Jhelum River and adjacent tributaries. The valley enjoys a markedly seasonal Mediterranean climate (Romshoo & Rashid, Citation2014). Winter (Dec–Feb), Spring (Mar–May), Summer (Jun–Aug) and Autumn (Sep–Nov) seasons are defined for the Kashmir valley (Khattak, Bab El, & Sharif, Citation2011), based on temperature and precipitation. Annual maximum precipitation of nearly 80% occurs in winter and spring months (), with winter precipitation related with western disturbances (Dar, Romshoo, Chandra, & Ahmad, Citation2014) and snow precipitation in winter and early spring (Kaul, Handoo, & Qadri, Citation1977). The highest rainfall of 275 mm occurs in summer and the lowest 50 mm in winter with a mean annual rainfall of 100 mm occurs Kashmir Valley (Meher-Homji, Citation1971). The domestic water demand for total population of 69 lakhs in Kashmir Valley (Census, Citation2001) was estimated to be 460 MLD by Public Works Health and Engineering Department (PHE annual report, Citation2013). The area is hilly and mountainous, and the valleys are inter-mountainous. The valleys are flat and slightly undulating. Groundwater in such conditions are mostly suitable for domestic water supply. In meeting the demands of water for livelihood related activates for this huge population, the valley has only 1485 tube wells and 5216 dug wells (PHE annual report, Citation2013). The relatively small stage in the development of groundwater in this area enlightens our understanding for further development of this water resource that can help to fulfil the increasing water demand in future decades.
Figure 1. Study area location map
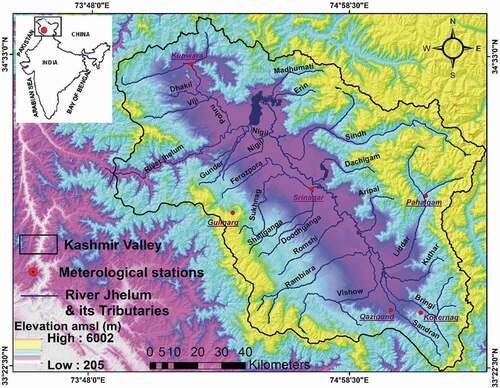
Figure 2. Monthly average rainfall (1980–2017) distribution in Kashmir Valley
3. Methodology
3.1. Data set used and preparation of thematic layers
Eight thematic layers of lithology, geomorphology, slope, LULC, lineament density, rainfall, and drainage density are chosen which had a major effect and more reliable of controlling the groundwater potential of an area. The relationship between these eight parameters and their impact on delineating potential groundwater recharge zone is shown in the (). Depending on the strength of a parameter and its respective classes relationship is weighted. A parameter with a higher weight value has a greater impact, and a parameter with a lower weight value has a smaller impact on possible groundwater zones. Satellite data and already existing maps of lithology, soil along with reports and data from different sources were used for delineation of groundwater potential zones. SRTM DEM of 30 m resolution and LISS-III image, which are freely available were downloaded from the website (http://bhuvan.nrsc.gov.in) of the National Remote Sensing Centre (NRSC) and were used for the preparation of a slope, Drainage density and Land use land cover maps of the study area. The lithological map of the study area was prepared from already exiting maps (Thakur & Rawat, Citation1992; Middlemiss, Citation1910; Bhat, Citation1982) on a scale of 1:50000 by georeferencing, scanning, and digitizing. A 1:50000 scale soil map was generated from the earlier soil map prepared by the National Soil Survey and Land Use Planning Office (NBSS and LU) of the Indian Council of Agriculture Research (ICAR). Digital image processing of Shaded relief map prepared from SRTM DEM is employed for the preparation of Lineament density. The SRTM DEM was used to prepare shaded relief map, and then through visual interpretation of the shaded relief map and LISS-III image geomorphological map was prepared. Rainfall data from the year 1980 to 2017 of the six stations of the valley was obtained from the Indian Meteorological Department (IMD) Srinagar. The rainfall data were used to create a thematic layer by geostatistical kriging interpolation technique in a GIS environment. Groundwater observation well (depth to the water table) was taken from the Central groundwater board (CGWB) for validation. Validation of results was also done with the help of the Receiver Operating Characteristic curve (ROC) and Area under Curve (AUC) Plotted with the help of SPSS software. The (ROC) curve analysis was used for quantitative validation, by comparing the actual bore well data with the recharge groundwater potential map prepared. A standard method for determining diagnostic test reliability defines the ROC curve analysis (Egan, Citation1975). For ROC false positive values are plotted along X-axis and the true positive along y-axis rate. ROC curve describes a balance between the two values (Negnevitsky, Citation2002). shows the detailed methodology used in the current study.
Figure 3. Interrelationship between the multi influencing parameters controlling the groundwater potential zone
Figure 4. Flow-chart methodology adapted for the present work
3.2. Derivation of normalized weights of thematic layers by AHP method
A common approach for deriving weights for different factors is to draw a schematic sketch of the interrelationships of the different factors. The stronger the influence of one factor on other factors the larger its relative importance which leads to a larger weight (Magesh, Chandrasekar, & Soundranayagam, Citation2012; Prasad, Mondal, Banerjee, Nandakumar, & Singh, Citation2008; Shaban, Khawlie, & Abdallah, Citation2006; Thapa et al., Citation2017; Yeh et al., Citation2009; Yeh et al., Citation2016). AHP method is very helpful for multi-parameter assessment (Saaty, Citation1980). The relative significance for every individual layer is resolved with Saaty’s 1–9 scale (), in which a score of 1 represents equal importance between the two parameters, and a score of 9 shows the outrageous significance of one parameter contrasted with the other one (Saaty, Citation1980). Saaty’s scale has been used to define the themes with their scale of rank and priority which helps to organize the criteria in hierarchical order through a pair-wise comparison matrix. The basis for groundwater prospective mapping technique is that the weight allocation of the various thematic layers and their corresponding classes are determined by the competence of the author ability so that each factor that controls the potential groundwater in an area has assigned appropriate ranks and weights (Das et al., 2017; Yeh et al., Citation2014). In the present work, several existing literatures have been carefully evaluated before assigning ranks and weights to gain an adequate understanding of the ranking of variables under distinct environmental circumstances and in distinct regions. The AHP picks up the likelihood of uncertainty in assessments through the principal Eigen value and the index of consistency (Saaty, Citation2008). The Consistency index (CI), as a measure of Consistency, is derived from the following equation.
Table 1. Rating scale of Satty’s analytical hierarchical process and Satty’s ratio index for different N number of values
where λmax is the significant eigenvalue of the pairwise comparison matrix, and n is the number of classes. To regulate the assessment of consistency analysis and scale, Consistency ratio (CR) defined as the measure of consistency between pairwise comparison matrix (Saaty, Citation1980) is calculated.
where RI is the Ratio Index. The value of RI value for different criteria is shown in (). The value of consistency should be less than 0.1 (Saaty, Citation1980; Malczewski, Citation1999), otherwise one should assign revaluated and recalculated weights of individual themes. A matrix of thematic layer comparison is developed in pairs (). By using the AHP method, the weights given to each thematic layer and each class of thematic layer were normalized (). The CR values calculated for individual layers and their respective classes are within the acceptable limits and hence show the level of consistency in the pairwise matrix.
Table 2. Pair-wise comparison matrix for all themes (parameters)
Table 3. Standardized pairwise comparison matrix of all themes (Parameters) and their weights
3.3. Overlay weighted analysis and delineation of groundwater potential zonation
Initially, reclassification of the individual layers (criteria) and assignment of ranks is done keeping in mind the impact of parameters and their respective classes in controlling the potential groundwater recharge over an area. However, in a groundwater zonation, the aim of creating several classes and their weights is to demonstrate the best possible variants. Each parameter and their respective classes are allocated the ranks and weights based on their comparative potential contribution (). This is achieved based on the experience of a researcher and their insights on current literature, location, and the other characteristic variables (LULC, rainfall, Soil texture, Geology, Geomorphology, etc.) of area. The below equation is a raster calculation of all of these parameters incorporated into ArcGIS software and followed by the resulting map.
Table 4. Assigned ranks, calculated normalized weights and consistency ratios of respective classes of a particular theme
where GWPZ shows the potential areas of groundwater. LT, GM, SL, S, LD, LU, DD, RF are the lithology, geomorphology, slope, soil, lineament density, Land use, drainage density, and rainfall, respectively. The weight of a layer and weight of a particular class of layer is represented by w and wi, which were combined on a pixel basis according to EquationEquation (3)(3)
(3) .
3.4. Validation of delineated potential groundwater recharge zone
The resulted map of the potential groundwater recharge zone was validated using existing pumping bore well data. The pumping bore well data was prepared and overlaid over the potential groundwater recharge map of the study area. To determine the accuracy of the potential groundwater recharge zone map, the Receiver Operating Characteristic Curve (ROC) and Area Under the Curve (AUC) were used. (Naghibi et al., Citation2016; Naghibi, Pourghasemi, Pourtaghi, & Rezaei, Citation2015a; Ozdemir & Altural, Citation2013; Pourghasemi et al., Citation2012a). In the ROC method, the area under the ROC curve value ranges from 0.5 to 1.0. It is used to evaluate the accuracy of the model (Nandi & Shakoor, Citation2009). If the model does not predict the occurrence of the groundwater zone the AUC becomes equal to 0.5.
4. Results
4.1. Lithology
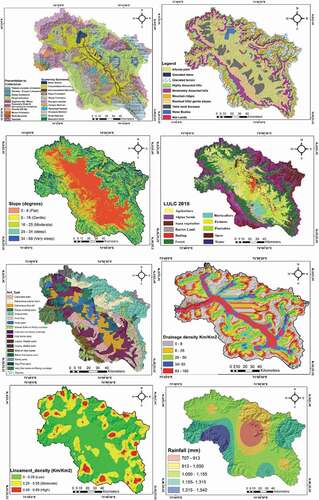
Lithology plays a major role in the availability and occurrence of groundwater. The type of lithology present affects the recharge of groundwater (Shaban et al., Citation2006) as it controls the percolation (El-Baz & Himida, Citation1995). The storage of water depends upon the type and porosity of rock formation. Study area is known to have a full stratigraphic record of rocks of all ages from Archean to Recent for geological importance (Ganju & Khar, Citation1984; Middlemiss, Citation1909, Citation1910; Wadia, Citation1975). The study area is underlain with basement inliers and series of metamorphosed rocks known as Salkhala’s and Muree’s (22.53%) which are overlain by Syringothyri’s limestones and Fenestella shales, which are in turn overlain with Triassic and Zewan limestones (11%). Panjal Traps (24%) of igneous origin and Triassic limestone’s covering a large portion of the study area that are mostly present in the upper mountainous regions and on the flanks of study area, while as lower reaches consist of Plio-Pleistocene deposits of Karewas (20%) and Recent Alluvium (18%) ()).
Figure 5. Shows different thematic layers (a) lithology, (b) geomorphology, (c) slope, d) LULC, (e) soil, (f) drainage density, (g) lineament density, (h) rainfall
4.2. Geomorphology
Geomorphology describes the region’s shape and topography and plays a main role in groundwater availability and distribution (Karanth, Citation1987). It is a main characteristic factor used to identify prospective groundwater areas (Arulbalaji et al., Citation2019). The study area is divided into six geomorphological groups ()). Upper reaches are a glaciated terrain (10%) with curved ridges of mountains (11.53%). Residual hills (18.15%) lie mostly to the south of the study area. Denudation hills cover a large area (27.71%) followed by a big alluvial plain (23.72%). Alluvial plain and gentle slopes are more promising for groundwater potential due to large infiltration rates, high porosity, and permeability.
4.3. Slope
The Slope, mainly in mountainous watersheds, is one of the principal groundwater recharges controlling factor (Magesh et al., Citation2011a). The steep slopes will lead to quick runoff, greater soil erosion rates with a little groundwater recharge (Magesh et al., Citation2011a, Citation2011b). The slope map is divided into six classes ()). 0°–6° (flat or almost flat), 6°– 16° (gentle), 16°–25° (moderate), 25°–34° (steep), and 34°–68° (very steep). Most of the area has a moderately steep (18.43%) to the steep slope (20.54%). Flat and gentle slope areas are given higher weights/ranks () and have been classified as an “excellent” category for groundwater potential because flat terrain is appropriate for more infiltration and recharge. Due to slightly undulating topography, allowing maximum percolation or partial runoff, moderate slopes are regarded good for groundwater potential (Nityananda, Khan, Chatterjee, & Das, Citation2015). The “steep” class regions with a large surface runoff with increased soil erosion but less soil infiltration is considered excellent sites for the building of dams and groundwater infiltration ponds for water harvesting. The slope is a major parameter that directly regulates the equilibrium between the response of terrains to runoff and infiltration. High runoff production results in less soil infiltration on higher slope areas and considerably regulates aquifer growth. (Gebre et al., Citation2015).
4.4. Landuse landcover (LULC)
Land use describes human operations such as land-related agriculture, settlement, and industry, while as the land cover relates to features such as lakes, mountains, vegetation, and rocks on the surface of earth (Samal & Gedam, Citation2016). (LULC) regulates volume, timing, and recharge amount. It also impacts runoff and evapotranspiration (Guzhaa, Rufinoa, Okoth, Jacobsa, & Nobregae, Citation2018). The area of study is grouped into six LULC classes ()). Dense forest area and agriculture land are having the excellent capability to recharge and hold the groundwater, while as exposed bare rock and built up are least suitable for infiltration and recharging the groundwater. LULC map of study area was reclassified into seven major classes Agriculture/Horticulture land (14.67%), Alpine scrub (13.18%), Pastures/Plantation (14.65%), Forest area (29.99%), Built-up (1.49%), Water/aqua- vegetation (18.19%), and barren land (7.78%).
4.5. Soil
Soil is also an important parameter that affects the occurrence, distribution of groundwater and plays a significant role in the infiltration of water, therefore it affects the recharge of groundwater (Das, Citation2017a; Ibrahim-Bathis & Ahmed, Citation2016). The soil texture and hydraulic properties are key factors in estimating infiltration rates. Soil texture is a key criterion for the assessment of the physical characteristics of soil and is directly linked to the structure, porosity, adhesion, and consistency of soil properties (McGarry, Citation2006). Due to the high infiltration capacity and low potential runoff sandy soils are given a higher weight and rank than the other soils ()). Similarly, lower weights are assigned to soils having fine-grained texture because fine texture limits the infiltration and percolation of water due to less permeability, while as coarse-grained soils are having higher infiltration and percolation capacities because of higher permeability and thus are assigned higher weights. The soil map was reclassified into six major types of soils: impermeable coarse loam exposed on rock outcrops (10.23%), clayey skeletal soils (2.66%), moderately well-drained sandy-loam (1.4%), moderately well-drained calcareous fine silt (10.2%), well-drained fine clay (4.29%), and a large portion of the basin is covered by fine loam that is estimated to be 71.16% of the total area.
4.6. Lineament density
Lineaments are linear or curvilinear features of the earth’s surface, such as fault, joints, folds, dikes, crustal fractures, etc. Lineaments play a very critical part in recharging the subsurface groundwater in hard rock terrains and groundwater potential remains very high closer to lineaments (Srivastava & Bhattacharya, Citation2006). Faulting and fracturing areas/regions that are responsible for increasing porosity and permeability are major indicators of groundwater (Das, Gupta, & Ghosh, Citation2017c). Geospatial studies are conducted taking into account the ultimate objective of assessment of lineament length, thickness, and orientation. The results have demonstrated that the greater part of major lineaments is found near the areas with high estimations of lineament density in the upper reaches and towards the flanks on hard rocks. Lineaments for the present study were delineated from topographical maps and satellite data. Study area was classified into three lineament density zones ()), 0–0.29 km/km2, 0.29–0.59 km/km2 and 0.59–0.89 km/km2. These zones have been assigned as “Low” (40.04%), “Moderate (38.09%)”, and “High (21.86%)“.
4.7. Drainage density (Dd)
The drainage density is a substantial measure of the linear scale of the landform components and an illustration of channel spacing proximity (Horton, Citation1932). Drainage density measurement is a helpful numerical indicator for landscape dissection and runoff potential (Chorley, Citation1969). Drainage density is the outcome of interacting factors that control the surface runoff; it affects the production of drainage basin sediment (Ozdemir & Bird, Citation2009). The lower Dd means a permeable soil, excellent vegetation cover, and lower relief, while the higher Dd indicates that the opposite is true (Harlin & Wijeyawickrema, Citation1985). The drainage density was classified as very low (0–8 km/km2), low (8–26 km/km2), moderate (26–50 km/km2), high (50–83 km/km2), and very high (83–160 km/km2) ()). Lower Dd is given a higher weight in the current study ().
4.8. Rainfall
The rainfall is a major factor controlling the groundwater recharge of a region. The study area receives precipitation mainly from western disturbances (Mediterranean Sea). Spatio-temporal precipitation distribution has a large effect on a region’s hydrological and hydrogeological processes (Shi, Tiejian, Wei, Fua, & Wang, Citation2016). Data of precipitation (1980–2017) from all six stations of Valley from IMD Srinagar were collected. The yearly average was calculated for each station and a rainfall map of the study area was generated using IDW interpolation techniques. The rainfall map is classified into five groups. Very Low (707–913 mm), Low (913–1050 mm), Moderate (1050–1155 mm), High (1155–1315 mm), and Very High (1315–1540 mm). Higher precipitation occurs in hilly regions especially towards NW and SE of the study area and the minimum is recorded at the centre of Valley, e.g., Srinagar ()).
5. Discussion
5.1. Delineation of potential groundwater recharge zones
After obtaining normalized weights of each layer and their respective individual classes, all of these were then integrated within the GIS environment by using the weighted overlay technique which was combined on a pixel basis according to EquationEquation (3)(3)
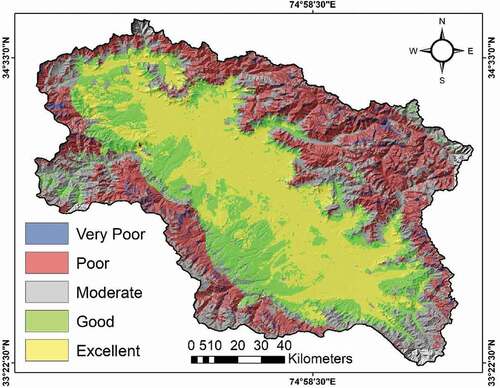
(3) for delineation of potential zones of groundwater. Based on weighted overlay analysis the study area classified into five zones. Excellent, Good, Moderate, Low, and Very Low. The results computed that around 28.97% of the total area falls under Excellent, 19.99% under good, 21.70% under moderate potential zones, the poor and very poor zones constitute around 27.16% and 2.15% of the study area (). The hydro-geomorphological setting of the basin reveals that excellent groundwater potential regions are present in the alluvial plain of the basin, having flat topography, lower slope, high porosity and permeability and, high infiltration capacity. Agriculture/Horticulture fields also show a strong influence on holding groundwater capacity, and there are excellent and good potential regions in the vicinity of these fields, particularly to the south-east and north-east of the basin. Additionally, the concentration of drainage of Jhelum and its tributaries originating from both sides of the Basin also helps the streamflow to recharge the groundwater system. Plio-Pleistocene age Fluvio-lacustrine deposits (Karewas) create another potential aquifer in the basin, but due to low hydraulic conductivity these are not as good aquifers as alluvium of the Basin (Jeelani, Citation2005), Karewas are composed of silt, clay, sand, and loess deposits (Bhat, Citation1982). In this study, deposits of “Karewas” are associated with good to moderate potential regions. Poor and very poor groundwater water potential regions are located in mountainous areas, ridges, and denudation hills with steeper slopes, high runoff potential resulting in less water infiltration and storage in these regions. The low and very low potential groundwater recharge zones also occur at the lithological formations of Salkahals, Murees, Panjal traps, Because of their lower porosity/permeability, and present at high steep slopes high drainage density areas.
Figure 6. Groundwater potential zone map of study area
5.2. Validation of results
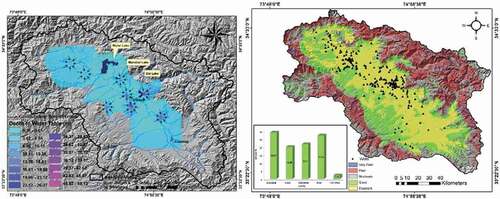
shows the ROC plot for the study area. AUC was found to be 79.69% indicating moderate to high predictability of groundwater recharge zone by AHP method for the study area. The depth to the groundwater of wells along with flow direction ()) map prepared was overlaid over groundwater potential map for further validation. The results are in good agreement with (CGWB, Citation2016–2017) flow computational investigations which suggest groundwater flows north-eastward from south up to central Kashmir and south-westward from North towards Jhelum River. The findings also suggest that high yielding wells are present on alluvium rather that Plio-Pleistocene deposits of Karewas. The results of the present study quite match very significantly as Excellent and good groundwater potential areas have been demarcated along the alluvial plain of Basin. Further, the potential zonation map obtained was further validated with 245 bore wells. Out of Which 195 falls over the Excellent and 40 over good water potential. Nine out of 245 wells fall under the category of moderate groundwater potential and only one well does not agree with the results and fall under poor groundwater potential ()). It is clear that the Groundwater potential areas of Excellent, Good, and moderate obtained for the study area coincides with the bore-well data.
Figure 7. ROC curve for validation of groundwater potential map
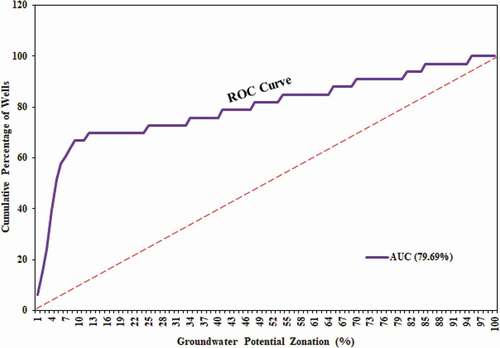
Figure 8. (a) Depth to groundwater below the ground surface and flow direction, (b) Overlain bore well data over groundwater potential map
6. Conclusion
The integrated remote sensing and GIS along with the AHP technique have proven to be a powerful and more efficient tool for the identification of groundwater potential zones. Satellite data, topographic maps were used to prepare various thematic maps. The Analytical hierarchical process (AHP) was used to assign a proper weight of individual thematic layers and respective classes for groundwater potential zonation. The final groundwater potential map of the study area is classified as Excellent, Good, moderate and poor, and very poor zones. The excellent to good potential zones is characteristic of flat alluvial Plain, and Karewas of fluvio-lacustrine origin. The validation of results done against bore-well data was in agreement with the evidence obtained as AUC was calculated to be 79.69%. From the above discussion, it can be clearly understood that the groundwater potential maps predicted in this study are indicating a very high level of accuracy. For water planners and policymakers the results of the study can serve as a water management tool. The implementation of management practices is expected to improve natural groundwater recharge and thus increase the volume of water available to the local population significantly. Initiatives to control extensive water use can include seasonal surface water storage or adaptation of irrigation practices in areas of low potential recharge. Waste dumping is advisable away from the alluvial plain which can otherwise contaminate and degrade the quality of groundwater as those areas are considered the most conducive to the recharge. Scope of groundwater development is possible through the construction of suitable infrastructure for groundwater in the valley. The presented methodology can be applicable to anywhere where data used are available. The results of the present work can help engineers, planners, and water managers for the planning of various projects locations of artificial recharge structures and the establishment of wells to ensure sustainable groundwater utilization.
Article highlights
Water resources in Kashmir Valley are both spatially and temporarily variable.
Remote sensing GIS and AHP techniques were used to delineate the groundwater potential zones. The normalized weights of each theme and its respective classes were determined with AHP.
Excellent to good groundwater potential areas are present along the alluvial plain of Jhelum Basin.
The presented methodology can be applicable to anywhere where data used are available.
Compliance with ethical standards
On behalf of all authors, the corresponding author states that there is no conflict of interest.
Acknowledgments
The authors are thankful to the different government and nongovernment authorities for providing the useful data. The authors are thankful anonymous reviewers for their helpful comments in improving the manuscript.
Disclosure statement
No potential conflict of interest was reported by the authors.
References
- Adiat, K. A. N., & Abdullah, N. M. N. M. (2012). Assessing the accuracy of GIS-based elementary multi criteria decision analysis as a spatial prediction tool-A case of predicting potential zone of sustainable groundwater resources. Journal of Hydrology, 440, 75–89.
- Agarwal, R., & Garg, P. K. (2016). Remote sensing and GIS based groundwater potential & recharge zones mapping using multi-criteria decision making technique. Water Resources Management, 30(1), 243–260.
- Agrawal, D. P., Krishnamurthy, R. V., Kusumgar, S., Nautiyal, V., Authavale, R. N., & Radhakrishnanmurthy, C. (1979). Chronostratigraphy of loessic and lacustrine sediments in the Kashmir Valley, India. Acta Geologica Academiae Scientiarum Hungaricae, 22, 185–196.
- Al-Abadi, A. M., Al-Temmeme, A. A., & Al-Ghanimy, M. A. (2016). A GIS-based combining of frequency ratio and index of entropy approaches for mapping groundwater availability zones at BadraeAl Al-GharbieTeeb areas, Iraq. Sustainable Water Resources Management, 2(3), 265–283.
- Arulbalaji, P., Padmalal, D., & Sreelash, K. (2019). GIS and AHP techniques based delineation of groundwater potential zones: A case study from Southern Western Ghats India. Scientific Reports, 9. https://doi.org/https://doi.org/10.1038/s41598-019-38567-x
- Ayazi, M. H., Pirasteh, S., Arvin, A. K. P., Pradhan, B., Nikouravan, B., & Mansor, S. (2010). Disasters and risk reduction in groundwater: Zagros mountain Southwest Iran using geoinformatics techniques. Disaster Advances, 3, 51–57.
- Balamurugan G., Karthik S., Somnath B. (2017). Frequency ratio model for groundwater potential mapping and its sustainable management in cold desert, India. J King Saud Univ - Sci, 29(3), 333–347.
- Bhat, D. K. (1982). A review of stratigraphy of Karewa group (Pliocene/Quaternary) Kashmir. Man and Environment, 6, 46–55.
- Census of India. (2011). Houselisting and Housing Census Schedule. Government of India.
- Central groundwater board annual report. (2014). Govt. of India, CENTRAL GROUND WATER BOARD Ministry of Water Resources, River Development and Ganga Rejuvenation
- Central groundwater board annual report. (2016–2017). GROUND WATER YEAR BOOK 2016-17 JAMMU & KASHMIR.
- Changnon, S. A., Huff, F. A., & Hsu, C. F. (1988). Relations between precipitation and shallow groundwater in Illinois. Journal of Climate, 1, 1239–1250.
- Chenini, I., Mammou, A. B., & El May, M. (2010). Groundwater recharge zone mapping using GIS-based multi-criteria analysis: A case study in Central Tunisia (Maknassy basin). Water Resources Management, 24(5), 921–939.
- Chorley, R. J. (1969). Introduction to physical hydrology (pp. 211). Suffolk: Methuen and Co. Ltd.
- Chowdhury, A., Jha, M. K., Chowdary, V. M., & Mal, B. C. (2009). Integrated remote sensing and GIS-based approach for assessing groundwater potential in West Medinipur district, West Bengal, India. International Journal of Remote Sensing, 30(1), 231–250.
- Dar, I. A., Sankar, K., & Dar, M. A. (2010). Remote sensing technology and geographic information system modeling: An integrated approach towards the mapping of potential groundwater recharge zones in Hardrock terrain, Mamundiyar basin. Journal of Hydrology, 394, 285–295.
- Dar, R. A., Romshoo, S. A., Chandra, R., & Ahmad, I. (2014). Tectono-geomorphic study of the Karewa basin of Kashmir valley. Journal of Asian Earth Sciences, 92, 143–156.
- Das S., Gupta A., Ghosh S. (2017). Exploring groundwater potential zones using MIF technique in semi-arid region: a case study of Hingoli district, Maharashtra. Spat Inf Res, 25(6), 749–756. https://doi.org/https://doi.org/10.1007/s41324-017-0144-0
- Das, S. (2017a). Delineation of groundwater potential zone in hard rock terrain in Gangajalghati block, Bankura district, India using remote sensing and GIS techniques. Modeling Earth Systems and Environment, 3, 1589–1599.
- Das, S., (2017b) Signatures of morphotectonic activities in Western Upland Maharashtra and Konkan region. Unpublished M.Sc. thesis. Savitribai Phule Pune University.
- Das, S., Gupta, A., & Ghosh, S. (2017c). Exploring potential groundwater recharge zones using MIF technique in semi-arid region: A case study of Hingoli district. Maharashtra. Spat. Information Resource, 25(6), 749–756.
- Das, S., & Pardeshi, S. D. (2018b). Integration of different influencing factors in GIS to delineate groundwater potential areas using IF and FR techniques: A study of Pravara basin, Maharashtra, India. Applied Water Science. 8:197
- Egan, J. P. (1975). Signal detection theory and ROC analysis. Series in cognitition and perception. New York, NY: Academic. Press.
- El-Baz F et al. (1992–1995) Research project. Groundwater potential of the Sinai Peninsula, Egypt. http://www.bu.edu/remotesensing/research/completed/egypt-groundwater.
- Fetter, C. W. (1994). Applied hydrogeology (4th ed., pp. 543–591). Englewood Cliffs, NJ: Prentice Hall.
- Fitts, C. R. (2002). Groundwater science. Academic Press.
- Ganapuram, S., Kumar, G. T. V., Krishna, I. M., Kahya, E., & Demirel, M. C. (2009). Mapping of groundwater potential zones in the musi basin using remote sensing data and GIS. Advansoft International Reviews, 40, 506–518.
- Ganju, J. L., & Khar, B. M. (1984). Tectonic and hydrocarbon prospects of Kashmir Valley possible exploration tasks. Petroleum Asian Journal, 206–216.
- Gebre, T., Kibru, T., Samuale, T., & Taye., G. (2015). Analysis of watershed attributes for water resources management using GIS: The case of Chelekot micro-watershed, Tigray, Ethiopia. Journal of Geographic Information System, 7(2), 13 ( Article ID: 55674).
- Gebre, T., Kibru, T., Tesfaye, S., & Taye., G. (2015). Analysis of watershed attributes for water resources management using GIS: The case of Chelekot micro watershed, Tigray, Ethiopia. Journal of Geographic Information System, 7, 177–190.
- Golkarian, A., & Rahmati, O. (2018). Use of a maximum entropy model to identify the key factors that influence groundwater availability on the Gonabad plain. Environmental Earth Sciences, 77, 369.
- Guru, B., Seshan, K., & Bera, S. (2017). Frequency ratio model for groundwater potential mapping and its sustainable management in cold desert India. Journal of King Saud University, 29(3), 333–347.
- Guzhaa, A. C., Rufinoa, M. C., Okoth, S., Jacobsa, S., & Nobregae, R. L. B. (2018). Impacts of land use and land cover change on surface runoff, discharge and low flows: Evidence from East Africa. Journal of Hydrology: Regional Studies, 15, 49–67.
- Harlin, J. M., & Wijeyawickrema, C. (1985). Irrigation and groundwater depletion in Caddo county, Oklahoma. JAWRA Journal of the American Water Resources Association, 21(1), 15–22.
- Horton, R. E. (1932). Drainage basin characteristics. Transactions of the American Geophysical Union, 13, 350–361.
- Hutti, B., & Nijagunappa, R. (2011). Identification of groundwater potential zone using geoinformatics in Ghataprabha basin, North Karnataka, India. International Journal of Geomatics and Geosciences, 2(1), 91–109.
- Ibrahim-Bathis, K., & Ahmed, S. A. (2016). Geospatial technology for delineating groundwater potential zones in Doddahalla watershed of Chitradurga district, India. The Egyptian Journal of Remote Sensing and Space Sciences, 19(2), 223–234.
- Israil, M., Al-Hadithi, M., & Singhal, D. C. (2006). Application of a resistivity survey and geographical information system (GIS) analysis for hydrogeological zoning of a piedmont area, Himalayan foothill region, India. Hydrogeology Journal, 14, 753–759.
- Jasrotia, A. S., Kumar, A., & Singh, R. (2016). Integrated remote sensing and GIS approach for delineation of potential groundwater recharge zones using aquifer parameters in Devak and Rui watershed of Jammu and Kashmir, India. Arabian Journal of Geosciences,9: 304
- Jeelani, G. (2005). Chemical quality of the spring waters of Anantnag, Kashmir. Journal of the Geological Society of India, 66, 453–462.
- Jyoti Sarup, M. K. & Khatediya V, (2011) Delineate groundwater prospect zones and identification of artificial recharge sites using geospatial technique. International Journal of Advance Technology & Engineering Research (IJATER), 1, (1).6-20.
- Karanth, K. R. (1987). Ground water assessment, development and management. New Delhi: Tata McGraw-Hill publishing company Limited.
- Kaul, V., Handoo, J. K., & Qadri, B. A. (1977). Seasons of Kashmir. Geographical Review of India, 41(2), 123.
- Khattak, M. S., Bab El, M. S., & Sharif, M. (2011). Hydro-meteorological trends in the upper Indus river basin in Pakistan. Climate Research, 46(2), 103–119.
- Krishnamurthy, J., Venkatesa Kumar, N., Jayaraman, V., & Manivel, M. (1996). An approach to demarcate ground water potential zones through remote sensing and a geographical information system. International Journal of Remote Sensing, 17(10), 1867–1884.
- Leblanc, M., Leduc, C., Razack, M., Lemoalle, J., Dagorne, D., & Mofor, L. (2003). Application of remote sensing and GIS for groundwater modeling of large semiarid areas: Example of the Lake Chad watershed, Africa. Hydrology of Mediterranean and Semiarid regions conference (Vol. 278, pp. 186–192). Montpieller, France, Wallingford: IAHS.
- Lee, G. F., & Jones-Lee, A. (1999). Evaluation of surface water quality impacts of hazardous chemical sites. Remediation, 9(2), 87–113.
- Machiwal, D., Jha, M. K., & Mal, B. C. (2011a). Assessment of groundwater potential in a semi- arid region of India using remote sensing, GIS and MCDM techniques. Water Resources Management, 25(5), 1359–1386.
- Machiwal, D., Jha, M. K., & Mal, B. C. (2011b). Assessment of groundwater potential in a semi- arid region of India using remote sensing, GIS and MCDM techniques. Water Resources Management, 25(5), 1359–1386.
- Madrucci, V., Taioli, F., & deArau´jo, C. C. (2008). Groundwater favorability map using GIS multicriteria data analysis on crystalline terrain, Sao Paulo state, Brazil. Journal of Hydrology, 357(3–4), 153–173.
- Magesh, N. S., Chandrasekar, N., & Soundranayagam, J. P. (2011a). Morphometric evaluation of Papanasam and Manimuthar watersheds, parts of Western Ghats, Tirunelveli district, Tamil Nadu India: A GIS approach. Environmental Earth Science, 64, 373–381.
- Magesh, N. S, Chandrasekar, N, & Soundranayagam, J. P. (2011a). Morphometric evaluation of papanasam and manimuthar watersheds, parts of western ghats, tirunelveli district, tamil nadu, india: a gis approach. Environmental Earth Sciences, 64, 373–381. doi:https://doi.org/10.1007/s12665-010-0860-4
- Magesh, N. S., Chandrasekar, N., & Soundranayagam, J. P. (2012). Delineation of groundwater potential zones in Theni district, Tamil Nadu, using remote sensing, GIS and MIF techniques. Geoscience Frontiers, 3(2), 189–196.
- Magesh, N. S., Chandrasekar, N., & Vetha Roy, D. (2011b). Spatial analysis of trace element contamination in sediments of Tamiraparani estuary,southeast coast of India. Estuarine, Coastal and Shelf Science, 92, 618–628.
- Malczewski, J. (1999). GIS and multicriteria decision analysis. New York, NY: Wiley.
- Mallick, J., Singh, C. K., Al-Wadi, H., Ahmed, M., Rahman, A., Shashtri, S., & Mukherjee, S. (2014). Geospatial and geostatistical approach for groundwater potential zone delineation. Hydrol Processes. doi:https://doi.org/10.1002/hyp.10153
- Manap, M. A., Sulaiman, W. N. A., Ramli, M. F., Pradhan, B., & Surip, N. (2011). A knowledge-driven GIS modeling technique for groundwater potential mapping at the Upper Langat basin, Malaysia. Arabian Journal of Geosciences. doi:https://doi.org/10.1007/s12517-011-0469-2
- McGarry, D. (2006). A methodology of visual-soil field assessment tool to support, enhance, and contribute to the LADA program. Rome, Italy: Food and Agriculture Organization.
- Meher-Homji, V. M. (1971). On the Mediterranean climatic regime of West Pakistan. Theoretical and Applied Climatology, 19(3), 277–286. ISSN 0177-798.
- Middlemiss, C. S. (1909). Gondwanas and related marine sedimentary systems of Kashmir. Geological Survey of India, 37, 286–327.
- Middlemiss, C. S. (1910). A revision of the Silurian-Trias sequence in Kashmir. Geological Survey of India, 40, 206–260.
- Mishra, Rajat C., Chandrasekhar, Biju, & Naik, Ranjitsingh D, 2010, Remote sensing and gis for groundwater mapping and identification of artificial recharge sites. GeoShanghai International Conference, pp 216-223.
- Naghibi, S. A., Pourghasemi, H. R., & Abbaspour, K. (2018). A comparison be-tween ten advanced and soft computing models for groundwater qanat potential assessment in Iran using R and GIS. Theoretical and Applied Climatology, 131(3–4), 967–984.
- Naghibi, S. A., Pourghasemi, H. R., & Dixon, B. (2016). GIS-based groundwater potential mapping using boosted regression tree, classification and regression tree, and random forest machine learning models in Iran. Environmental Monitoring and Assessment, 188, 1–27.
- Naghibi, S. A., Pourghasemi, H. R., Pourtaghi, Z. S., & Rezaei, A. (2015a). Groundwater qanat potential mapping using frequency ratio and Shannon’s entropy models in the Moghan watershed, Iran. Earth Science Informatics, 8, 171–186.
- Nandi, & Shakoor (2009). A GIS-based landslide susceptibility evaluation using bivariate and multivariate statistical analyses Eng. Geol., 110 (2009), pp. 11–20
- Nampak, H., Pradhan, B., & Manap, M. A. (2014). Application of GIS based data driven evidential belief function model to predict groundwater potential zonation. Journal of Hydrology, 513, 283–300.
- Negnevitsky, M. (2002). Artificial intelligence: A guide to intelligent systems (pp. 394). Harlow, England: Addison– Wesley/ Pearson.
- NITI Aayog–Annual Report (2017–2018) Government of India. “NITI Aayog State Statistics Handbook”. Online.
- Nityananda, S., Khan, A., Chatterjee, S., & Das, A. (2015). Hydrologic delineation of ground water potential zones using geospatial technique for Keleghai river basin, India. Modeling Earth Systems and Environment, 1, 25.
- Ozdemir, A. (2011). GIS-based groundwater spring potential mapping in the Sultan mountains (Konya, Turkey) using frequency ratio, weights of evidence and logistic regression methods and their comparison. Journal of Hydrology, 411, 290–308.
- Ozdemir, A., & Altural, T. (2013). A comparative study of frequency ratio, weights of evidence and logistic regression methods for landslide susceptibility mapping: Sultan Mountains, SW Turkey. Journal of Asian Earth Sciences, 64, 180–197.
- Ozdemir, H., & Bird, D. (2009). Evaluation of morphometric parameters of drainage networks derived from topographic maps and DEM in point of floods. Environmental Geology, 56, 1405–1415.
- Pourghasemi, HR, Pradhan, B, & Gokceoglu, C. (2012a). Application of fuzzy logic and analytical hierarchy process (ahp) to landslide susceptibility mapping at haraz watershed, iran. Natural Hazards, 63(2), 965– 996. doi:https://doi.org/10.1007/s11069-012-0217-2
- Pourtaghi, Z. S., & Pourghasemi, H. R. (2014). GIS-based groundwater spring potential assessment and mapping in the Birjand township, southern Khorasan province, Iran. Hydrogeology Journal, 22, 643–662.
- Pradhan, B. (2009). Groundwater potential zonation for basaltic watersheds using satellite remote sensing data and GIS techniques. Open Geoscience, 1, 120–129.
- Prasad, R., Mondal, N., Banerjee, P., Nandakumar, M., & Singh, V. (2008). Deciphering potential groundwater zone in hard rock through the application of GIS. Environmental Geology, 55(3), 467–475.
- Public Works Health and Engineering Department Kashmir 57th Annual Report. (2013). National Informatics Centre, Jammu & Kashmir.Government of Jammu & Kashmir.
- Razandi, Y., Pourghasemi, H. R., Neisani, N. S., & Rahmati, O. (2015). Application of analytical hierarchy process. Frequency ratio, and certainty factor models for groundwater potential mapping using GIS. Earth Science India, 8(4), 867–883.
- Rodell, M., Velicogna, I., & Famiglietti, J. S. (2009). Satellite-based estimates of groundwater depletion in India. Nature, 460(7258), 999–1002.
- Romshoo, S. A., & Rashid, I. (2014). Assessing the impacts of changing land cover and climate on Hokersar wetland in Indian Himalayas, Arab. Journal of Geosciences, 7, 143–160.
- Saaty, T. (1994). How to make a decision: The analytic hierarchy process. Interfaces, 24, 19–43.
- Saaty, T. L. (1980). The analytic hierarchy process: Planning, priority setting, resource allocation. New York, NY: McGraw-Hill.
- Saaty, T. L. (1986). Axiomatic foundation of the analytic hierarchy process. Management Science, 32, 841–855.
- Saaty, T. L. (2008). Decision making with the analytic hierarchy process. International Journal of Services Sciences, 1(1), 83–98.
- Sahu, P., & Sikdar, P. K. (2011). Groundwater potential zoning of a peri-urban wetland of south Bengal Basin, India; Environ. Environmental Monitoring and Assessment, 174, 119–134.
- Samal, D. R., & Gedam, S. S. (2016). Monitoring land use changes associated with urbanization: An object based image analysis. European Journal of Remote Sensing, 48, 85–99.
- Saraf, A. K., & Choudhury, P. R. (1998). Integrated remote sensing and GIS for groundwater exploration and identification of artificial recharge sites. International Journal of Remote Sensing, 19, 1825–1841.
- Senanayake, I. P., Dissanayake, D. M. D. O. K., Mayadunna, B. B., & Weerasekera, W. L. (2016). An approach to delineate groundwater recharge potential sites in Ambalantota, Sri Lanka using GIS techniques. Geoscience Frontiers, 7(1), 115–124.
- Shaban, A., Khawlie, M., & Abdallah, C. (2006). Use of remote sensing and GIS to determine recharge potential zone: The case of occidental Lebanon. Hydrogeology Journal, 14, 433–443.
- Shi, H., Tiejian, L., Wei, J., Fua, W., & Wang, G. (2016). Spatial and temporal characteristics of precipitation over the three-river headwaters region during 1961–2014. Journal of Hydrology: Regional Studies, 6, 52–65.
- Shubham Saroha, Prasenjit Mondal, Deepak Tandon. (2017). DownstreamProcessing of Heavier Petroleum Fractions from: Sustainable Utilization of Natural Resources CRC PressAccessed on: 14 Feb 2020
- Singh, S. K., Zeddies, M., Shankar, U., & Griffiths, G. A. (2019). Potential groundwater recharge zones within New Zealand. Geoscience Frontiers, 10, 1065–1072.
- Solomon, S., & Quiel, F. (2006). Groundwater study using remote sensing and geographic information systems (GIS) in the central highlands of Eritrea. Hydrogeology Journal, 14, 729–741.
- Srivastava, P. K., & Bhattacharya, A. K. (2006). Groundwater assessment through an integrated approach using remote sensing, GIS and resistivity techniques: A case study from a hard rock terrain. International Journal of Remote Sensing, 27(20), 4599–4620.
- Taylor, R. G., Scanlon, B., Döll, P., Rodell, M., van Beek, R., Wada, Y., … Treidel, H. (2013). Ground water and climate change. Nature Climate Change, 3(4), 322–329.
- Thakur, V. C., & Rawat, B. S. (1992). Geological map of the Western Himalaya. Published under the authority of the surveyor general of India. Printing Group of Survey of India, p.101. HLO.
- Thapa, R., Gupta, S., Guin, S., & Kaur, H. (2017). Assessment of groundwater potential zones using multi-influencing factor (MIF) and GIS: A case study from Birbhum district, West Bengal. Applied Water Science, Vol.7, Issue 7, pp 4117–4131.
- Todd, D. K., & Mays, L. W. (2005). Groundwater hydrology (3rd ed., pp. p 636). New York, NY: Wiley.
- Tweed, S. O., Leblanc, M., Webb, J. A., & Lubczynski, M. W. (2007). Remote sensing and GIS for mapping groundwater recharge and discharge areas in salinity prone catchments, southeastern Australia. Hydrogeology Journal, 15, 75–96.
- Wadia, D. N. (1975). Geology of India. New Delhi: Tata McGraw Hill.
- Wieland, M., & Pittore, M. (2017). A spatio-temporal building exposure database and information life-cycle management solution. ISPRS International Journal of Geo-Information, 6(4), 114.
- World Bank. (2011). India groundwater governance. Washington: World Bank.
- Yeh, H. F., Lin, H. I., Lee, S. T., Chang, M. H., Hsu, K. C., & Lee, C. H. (2014). GIS and SBF for estimating groundwater recharge of a mountainous basin in the Wu river watershed, Taiwan. Journal of Earth System Science, 123(3), 503–516.
- Yeh, H.-F., Lee, C.-H., Hsu, K.-C., & Chang, P.-H. (2009). GIS for the assessment of the groundwater recharge potential zone. Environmental Geology, 58(1), 185–195.
- Yeh, H-F, Cheng, Y-S, Lin, H-I, & Lee, C-H. (2016). Mapping groundwater recharge potential zone using a gis approach in hualian river, taiwan. Sustainable Environment Research, 26(1), 33–43. doi:https://doi.org/10.1016/j.serj.2015.09.005