
 ?Mathematical formulae have been encoded as MathML and are displayed in this HTML version using MathJax in order to improve their display. Uncheck the box to turn MathJax off. This feature requires Javascript. Click on a formula to zoom.
ABSTRACT
The objective of this paper is to exploit the potential application of weighted index overlay analysis for assessing groundwater potential mapping at Dhungeta-Ramis sub-basin, Wabi Shebele basin, Ethiopia using remote sensing and geographic information system (GIS) technique. For this purpose, seven groundwater occurrences and movement controlling factors, including, lithology, slope, land use land cover (LULC), rainfall, lineaments, soil, and drainage density were mapped. Then, weight was assigned to thematic maps, and the groundwater prospective of the sub-basin is qualitatively classified into five classes, namely, very good, good, moderate, poor, and very poor which account for 2.22%, 26.93%, 56.74%, 13.84%, and 0.26% landscape, respectively. The cross-validation of the resultant model was carefully carried out using spring, hand-dug, and deep well data. The result reveals that 89% of springs were overlaying good and/or very good groundwater potential zones and 58% of deep well shows the same scenario, whereas 42% of deep well overlays moderate zone. As a result, the map generated using this platform could be used as a preliminary reference in selecting suitable sites for groundwater resource exploitation.
1. Introduction
Groundwater is the primary source of domestic, agricultural, and industrial use in many regions of the world (Burke & Moench, Citation2000; Hosseinifard & Mirzaei Aminiyan, Citation2015). Groundwater has been found to be a more preferred resource due to its less susceptible contamination than surface water (Naghibi, Moghaddam, Kalantar, Pradhan, & Kisi, Citation2017). It can be considered as the largest single freshwater source in many parts of the world, especially during prolonged dry periods (Assaf & Saadeh, Citation2008). The utility of water is continuously growing and causes groundwater resource stress predictably (Vaux, Citation2011). In developing countries like Ethiopia, the unregulated growth of population and improper management resources affected directly and/or indirectly both the quality and quantity of groundwater. Hence, unscientific exploitation and improper use of water policy are also possible factors. Therefore, the assessment of groundwater resources is critical for sustainable management.
Most groundwater potential investigation techniques (i.e., geophysical methods, ground-based survey, and exploratory drilling) are uneconomical and time-consuming and require large data sets (Nampak, Pradhan, & Manap, Citation2014; Singh & Prakash, Citation2002). However, an integrated GIS and remote sensing study can provide the appropriate platform for the convergent analysis of large volumes of data and quite decision-making techniques for groundwater exploration. Remote sensing data that are a wide-range scale of the space-time distribution provide good opportunities to current science in improving the understanding of the hydrological system (Hoffmann & Sander, Citation2007). Besides of its scale, remote sensing provides information on inaccessible areas (Sener, Davraz, & Ozcelik, Citation2005) and saves time and money as well (Murthy, Citation2010; Solomon & Quiel, Citation2006; Tweed, Leblanc, Webb, & Lubczynski, Citation2007). Thus, remote sensing and GIS are being increasingly used for the identification of groundwater potential zones (Andualem & Demeke, Citation2019) as well as groundwater recharge and discharge zones (Chenini, Mammou, & Elmay, Citation2010; Russo, Fisher, & Lockwood, Citation2015). GIS has also been used for processing and interpretation of groundwater quality data (Srinivasan & Jugran, Citation2003). Moreover, researchers have been used an integrated approach using remote sensing, GIS, and geophysical techniques to assess groundwater resources (Srivastava & Bhattacharya, Citation2006).
Recently, several studies have been applied using weighted overlay analysis for assessing groundwater potential zones (Andualem & Demeke, Citation2019; Das, Pal, Malik, & Rabin Chakrabortty, Citation2019; Hussein, Govindu, & Nigusse, Citation2016; Ibrahim-Bathis & Ahmed, Citation2016; Kumar, Herath, Avtar, & Takeuchi, Citation2016; Magesh, Chandrasekar, & Soundranayagam, Citation2012; Rahmati, Samani, Mahdavi, Pourghasemi, & Zeinivand, Citation2014). Among many determinant factors of the occurrence and movement of groundwater, topography, geomorphology, lithology, geological structures, lineaments, porosity, slope, drainage patterns, rainfall, LULC, water quality, depth to water, net groundwater recharge, and climate can be listed as examples (Andualem & Demeke, Citation2019; Elewa & Qaddah, Citation2011; Jaiswal, Mukherjee, Krishnamurthy, & Saxena, Citation2003; Jha, Chowdhury, Chowdary, & Peiffer, Citation2007; Murthy & Mamo, Citation2009). Hence, the factors used are different per researches, and consequently, the results vary (Magesh et al., Citation2012).
In Ethiopia, groundwater is a source of domestic water in urban and rural areas, hence the only practical means of meeting rural communities in arid and semi-arid regions (Kebede, Citation2013). Considering hydrogeological properties, groundwater potential within the territory of Ethiopia was estimated to be about 1000 billion m3 (Kebede, Citation2013). Specifically, in the Dhungeta-Ramis sub-basin (an area of approximately 16,076.64 km2) of Wabi Shebele river basin, groundwater resources are primarily used for irrigation and domestic utilities since the amount of surface water in the area is scarce and those available are not developed well.
The practical development of the groundwater resources will have a significant effect on the improvement of the community livelihood. In fact, generating groundwater potential map has a significant effect to enhance sustainable management of groundwater resources in the study area as well as in the country. Thus, a detailed study has been performed to identify the potential areas of groundwater resources for better utility. Accordingly, this paper contributes by providing delineated groundwater potential zones through implementing remote sensing techniques and GIS tools to have proper administration, management, and sustainable use of groundwater resources in the sub-basin. Seven determinant factors, namely, lithology, slope, LULC, rainfall, lineaments, and drainage density, were accounted for in the study.
2. Study area
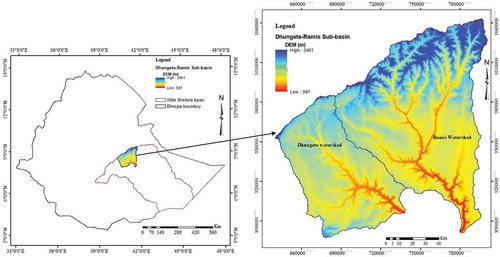
The study area Dhungeta-Ramis sub-basin is located in the upper portion of Wabi Shebele basin, Ethiopia. Geographically, the study site is situated between latitude 7°55ʹ52” to 9°25ʹ44” N and longitude 40°16ʹ13” to 41°44ʹ12” E with an aerial extent of 16,076.64 Km2 (). As shown in , the study area generally ought to a higher elevation in the northern and northwestern areas and lower elevation in the southern with minimum and maximum elevation of 597 m and 3401 m from mean sea level (datum), respectively, and the standard deviation of 341.54 m. The hydrological behaviors of the sub-basin are characterized by spatial and temporal variability. The mean annual rainfall of the Dhungeta-Ramis sub-basin is 720–1255 mm, with high spatial and temporal variability. The study area is dominated by humid to sub-humid tropical climate and having a mean annual temperature of 19.5° with small seasonal variability. A groundwater resource in Dhungeta-Ramis sub-basin is exploited through springs, hand-dug, and deep well. The groundwater potential assessment is vital in this area since groundwater supplies drinking water and irrigation necessities for the dwellers.
Figure 1. The geographic location of Dhungeta-Ramis sub-basin
3. Materials and methods
In this study, various types of data and software have been used. A digital elevation model (DEM) with 30 m resolution was obtained from Shuttle Radar Topography Mission (SRTM) to derive slope and drainage density map using the ArcGIS tool. The development of drainage density involves filling sinks, flow direction, flow accumulation, and stream network extraction. Then, the drainage density map was produced using a line density analysis tool. Landsat 8 Operational Land Imager (OLI) satellite image was obtained from the United States Geological Society (USGS) website and used to generate lineament density and LULC maps (USGS, Citation2019). Automatic lineament extraction was performed using the line module of PCI Geomatica. The daily rainfall data of 23 years (1994–2016) and groundwater well data were provided from the National Metrological Agency and Ethiopian Ministry of Water, Energy and Electricity, whereas geological data were obtained from the Ethiopian geological survey. A rainfall map was developed using inverse distance weight methods. Soil map of the study area was prepared using the Harmonized World Soil Database (HWSD).
Once the thematic maps were developed the weight was assigned to the parameters influencing groundwater occurrence and movement. Then, groundwater potential map was developed using weighted index overlay analysis. The groundwater potential index was calculated using a weighted linear combination method (Malczewski, Citation1999) (EquationEq. 1)(1)
(1) . In general, the study procedure adopted was shown in the flowchart ().
Figure 2. Conceptual framework adopted for the generation of groundwater potential map
where GPx is the groundwater potential index [-]; L is the score of lithology [-]; Dd is the score of drainage density [-]; Ld is the score of lineament density [-]; Sg is the score of slope gradient [-]; LC is the score of LULC [-], S is the score of soil [-], and where the subscripts w and r refer to the weight of a theme and the rate of individual features of a theme, respectively.
4. Results and discussion
4.1. Deterministic factors for groundwater occurrence and movements
4.1.1. Lithology
Lithology plays an important role in the occurrence and distribution of groundwater since it is the controlling factor of infiltration rate and flow. The geological map () of the study area reveals the presence of lithology with range of geological timescale, namely, Precambrian (4.34%), Paleozoic–Early Jurassic (3.95%), Middle–Late Jurassic (76.03%), Cretaceous (5.49%), Tertiary (4.37%), and Quaternary (5.83%). Precambrian lithology of Ethiopia which is mainly of metamorphic rocks is considered as low yielding regional aquicludes (Chernet, Citation1993); nevertheless, regoliths and fractures are the main groundwater holding and transmitting media in a metamorphic terrain (Kebede, Citation2013). Mesozoic sediments have better productivity because they have intergranular permeability and can have extensive aquifers (Chernet, Citation1993). The quaternary sediments are composed of alluvium (sand, silt, and clay and their inter-bedding) river gravels, fans, and travertine (). The quaternary alluvial has good potential because they are recent deposits and have better permeability and productivity (Kebede, Citation2013). If fractured, quaternary volcanic could yield a good amount of water. The weight is therefore assigned according to the aforementioned characteristics of the hydrogeological units.
Figure 3. Lithology map of the study area
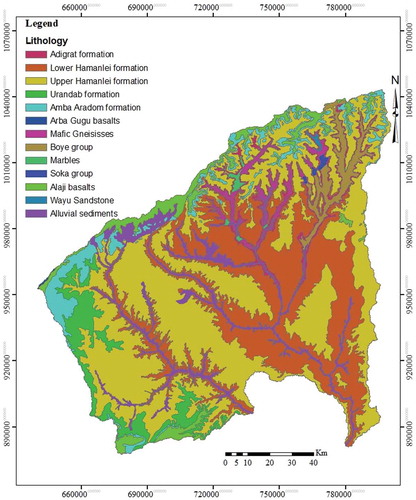
Table 1. Characteristic features of lithological groups in the Dhungeta-Ramis sub-basin (source: Alemu, Citation2010; Gebrekidan, Citation2005; Kebede, Citation2013; Teklay, Kroner, Mezger, & Oberhonsl, Citation1998)
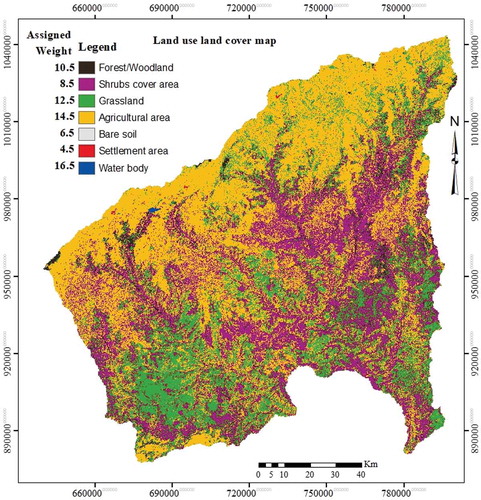
4.1.2. Land use land cover (LULC)
LULC includes the type of soil deposits, the distribution of residential areas, waterbody, and vegetation cover within a certain area. It is an important factor affecting groundwater recharge, groundwater occurrence, and availability (Hussein et al., Citation2016; Kumar et al., Citation2016; Pande, Khadri, Moharir, & Patode, Citation2017; Yeh, Cheng, Lin, & Lee, Citation2016).
Supervised image classification was conducted to classify and identify the type of LULC, where Landsat 8 (OLI) satellite image of 2018 with 30-m spatial resolution used. The study area consists of seven types of LULC () namely; agricultural area (45.68%), shrubs cover area (27.72%), grassland (24.23%), forest/woodland (2.17%), bare soil/rock (0.08%), settlement area (0.08%), and waterbody (0.04%).
Figure 4. Land use land cover map of the study area
4.1.3. Lineament
Geological lineaments are the manifestation at the earth’s surface of deeper geological structures (faults and fractures that have obvious displacement, ruptures that have no significant fracture displacement) (Han, Liu, Ning, & Zhao, Citation2018). It has been used to investigate the distribution of minerals (Bahiru & Woldai, Citation2016), determine the potential areas for runoff water harvesting (Elewa, Qaddah, & El-Feel, Citation2012), the regional distribution of groundwater potential (Magesh et al., Citation2012), geological disasters (Yusof, Ramli, Pirasteh, & Shafri, Citation2011), geothermal resources, earthquakes (Elmahdy & Mohamed, Citation2016) and geomorphology. Moreover, identification of the weathered zones from the lineament density map is useful in soil erosion studies (Krishna, Kishan, & Sarup, Citation2015). Areas with high lineament density denote a permeable zone so reveal good groundwater potential zones.
Thanks to the USGS website for open accessibility Landsat 8 (OLI) satellite image captured in January 2019 was obtained to have a cloud-free image for the betterment of the results. In preceding studies for automatic lineament extraction, VNIR band 3 of ASTER and the fused band 4 of the Landsat ETM (Hung, Batelaan, & De Smedt, Citation2005) and band 8 (panchromatic) of Landsat 8 (El-Sawy, Ibrahim, El-Bastawesy, & El-Saud, Citation2016) were used, where others use principal components (Han et al., Citation2018). In this study, band 8 of Landsat 8 (OLI) was used due to its higher spatial resolution. The lineament map was prepared using the line module of PCI Geomatica (Hashim, Ahmad, Johari, & Pour, Citation2013). Whereas, before starting the process, atmospheric correction and geometric correction were applied to remove errors in the image. Considering the lineament map as a baseline, lineament density (Ld) defined as the total length of lineaments per unit area (Greenbaum, Citation1985; Magesh et al., Citation2012; Yeh et al., Citation2016), was calculated (EquationEq. 2)(2)
(2) to prepare lineament density map.
where is the total length of lineaments [L], A refers to unit area of study site [L2], and n stand for number of drainage networks in the sub-basin [-].
The lineament density of the study area was classified into six classes (). The map reveals that the more densely distributed lineaments were along Dhungeta and Ramis River, which could be the result of serious erosion downstream. Areas having a lineament density between 0.82 and 1.33 km/km2 were considered as excellent groundwater prospective zone covering about 6.67% of the landscape. Referring to the map, it is clear that the major part of the study area is having poor and very poor lineament density which accounts for 33.30% and 23.43%, respectively. Despite, landscape having an area coverage of 3647.33 km2 (22.69%) was scored as good lineament density. Overall percentage and area coverage of lineament density classes are presented in .
Figure 5. Lineament density map of the study area
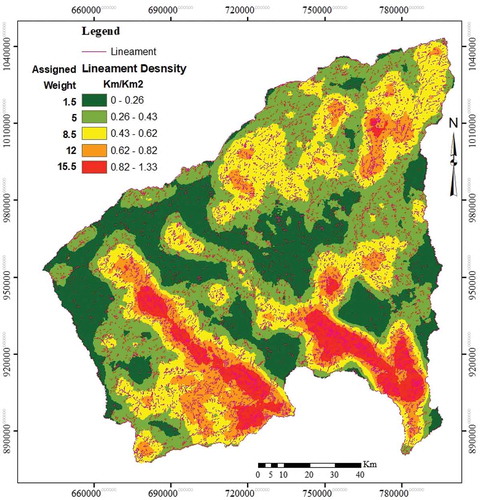
Table 2. Categorization of factors influencing groundwater movement and occurrence and their associated aerial extent within the study area
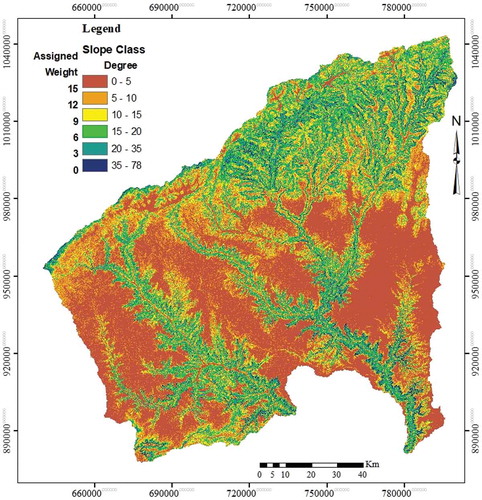
4.1.4. Slope
Topography and/or slope gradient directly influence the infiltration of rainfall and could be considered as one of the indicators of groundwater potential accessibility (Al Saud, Citation2018). It can also give an indication for the general groundwater flow direction (Gupta & Srivastava, Citation2010). The slope percentage map of the study area () was prepared from DEM with 30 m resolution using a spatial analysis tool in ArcGIS 10.4. The slope percentage of the study area varies between 0 and 80%. Despite the flat slope region causes more infiltration to the steep slope, the study area has been classified into six slope classes. About 40.29% of landscape is under the gentle slope (0º-5º) category and could be a pointer of the presence of high groundwater potential zones (Hussein et al., Citation2016). This is due to the fact that gentle slope areas have an affinity for holding rainfall and facilitate recharge to groundwater. The region with a very steep slope (20-35º) and escarpment (35-78º) accounts for 15.34% and 2.46% of landscape, respectively. This covers the Northeast parts of the study area and the escarpment area with a buffer zone of the valley. However, the gentle (0-5º), moderate (5-10º), and moderately steep (10-20º) slope covers about 40.29%, 20.08%, and 12.33% of the total area of sub-basin, respectively.
Figure 6. Slope class map of the study area
4.1.5. Drainage density
Drainage density is one of the important indicators of groundwater recharge (Magesh et al., Citation2012) and groundwater occurrence (Sener et al., Citation2005). In fact, it is linked with water percolation properties of underlying lithology, consequently having close relation with groundwater mapping. The drainage density is an inverse function of permeability. An area with low permeable surface prone to high drainage density and water comes from precipitation goes to a high runoff as well and vice versa. As a result, high drainage density implies low groundwater potential.
The algorithm has put forward to extract drainage networks from DEM with 30 m resolution using a spatial analysis tool in ArcGIS 10.4. Afterwards, a drainage density map is produced using a line density analysis tool (). As per the definition of preceding studies (Greenbaum, Citation1985; Magesh et al., Citation2012), drainage density (Dd) is the total length of the stream segments divided by the unit area (EquationEq. 3)(3)
(3) .
Figure 7. Drainage density map of the study area
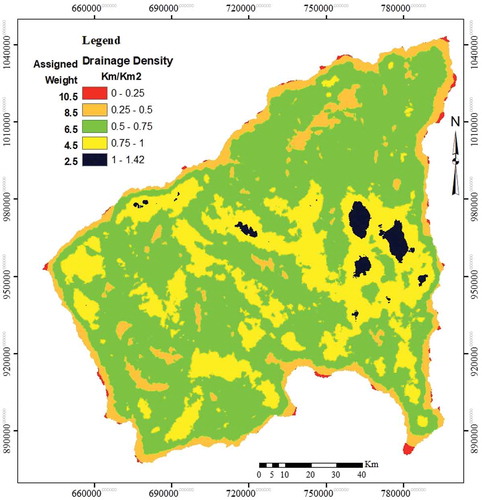
where the total length of drainage [L], A is total area of study site [L2], and n stand for number of drainage networks in the sub-basin [-].
illustrates the drainage density class in the study area. The class has been assigned according to its importance to potentiality for groundwater storage, namely “very poor” (1.00–1.42 km/km2), “poor” (0.75–1.00 km/km2), “good” (0.5–0.75 km/km2), “very good” (0.25–0.5 km/km2), and excellent (0–0.25 km/km2). In the study area, 1.73% and 25.07% of landscape were found in 0–0.25 km/km2 and 0.25–0.5 km/km2 drainage density class, respectively. This implies the availability of good groundwater potential zones. Moreover, 61.18% was entitled under drainage class with good potentiality for groundwater storage.
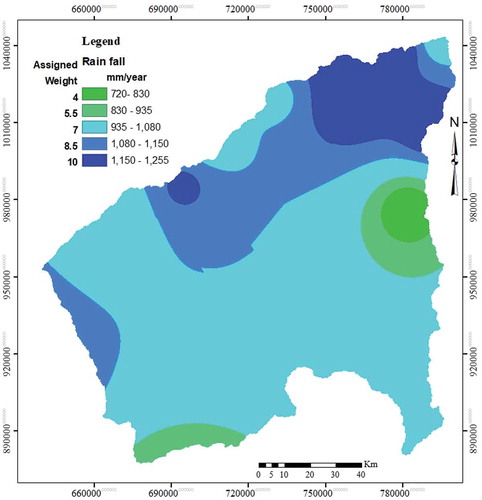
4.1.6. Rainfall
Rainfall is one of the important factors to delineate groundwater potential zones. In fact, it is the main source of natural recharge that develops groundwater resources. Rainfall map was developed from the historical rainfall data of 23 years (1994–2016) which is measured at the meteorology stations located in and within a buffer zone of the study area using inverse distance weight method. As it is shown in , the mean annual rainfall of the sub-basin ranges from 720 up to 1255 mm. The intensity of rainfall plays a significant role in infiltration; consequently, the weight was given to rainfall classes.
Figure 8. Rainfall map of the study area
4.1.7. Soil
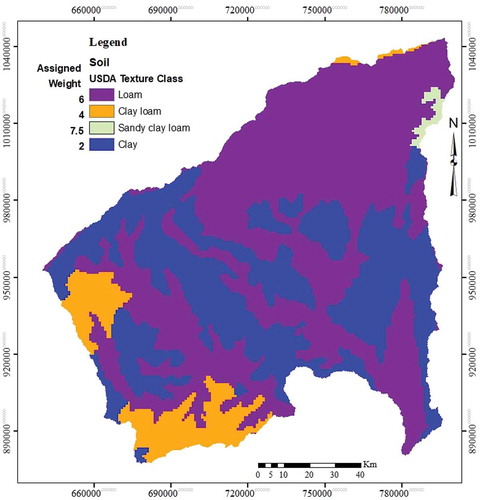
Soil type plays a vital role in controlling the infiltration rate of precipitated water and water-holding capacity of the area. Consequently, it could be considered as one of the important factors for the delineation of groundwater potential zones (Kumar et al., Citation2016; Magesh et al., Citation2012). Soil map of the area was prepared using Harmonized World Soil Database (FAO/IIASA/ISRIC/ISSCAS/JRC, Citation2012) and having 10 soil types per FAO 90 nomenclatures.
The statistical analysis of the soil type reveals that the study area is predominantly covered by loam (Eutric Leptosols; Haplic Calcisols; Rendzic Leptosols) soil which accounts for 57.12% area coverage, followed by clay (Vertic Luvisols; Eutric Vertisols), clay loam (Chromic Cambisols; Eutric Cambisols; Lithic Leptosols), and sandy clay loam (Chromic Luvisols; Haplic Luvisols) with area coverage of 34.34%, 8.09%, and 0.45%, respectively. These soil types are characterized by poor to good infiltration property. shows the soil map of the study area.
Figure 9. Soil map of the study area
4.2. Weight assignment to parameters
In this study, seven factors (i.e., lithology, slope, LULC, lineament, drainage, soil, and rainfall) were selected to delineate the groundwater potential zones of the study area. The influence of these factors in groundwater potential zonation is not the same (Magesh et al., Citation2012). The weight of each factor was assigned depending on its influence on the movement and storage of groundwater and in reference to literatures (Andualem & Demeke, Citation2019; Ibrahim-Bathis & Ahmed, Citation2016; Magesh et al., Citation2012; Naghibi et al., Citation2017; Nampak et al., Citation2014; Pande et al., Citation2017; Rahmati et al., Citation2014; Sener et al., Citation2005; Yeh et al., Citation2016).
The weight value of a factor represents the proportion of its value in groundwater potential zonation, in which high weight value is given to the dominant influencing factor (). To illustrate, geology plays a vital role with the highest score weight of 25% followed by LULC, lineament, slope, drainage density, rainfall, and soil with score weight of 16.5%, 15.5%, 15%, 10.5%, 10%, and 7.5%, respectively.
An area having high lineament density was given high weight and vice versa (Ibrahim-Bathis & Ahmed, Citation2016; Naghibi et al., Citation2017; Nampak et al., Citation2014; Yeh et al., Citation2016). An area having high drainage density was assigned very low weight (Andualem & Demeke, Citation2019; Ibrahim-Bathis & Ahmed, Citation2016; Rahmati et al., Citation2014). An area with low slope to flat was given high weight, whereas steep slope area assigned to low weight (Andualem & Demeke, Citation2019; Hussein et al., Citation2016; Ibrahim-Bathis & Ahmed, Citation2016). Since rainfall distribution directly affects the infiltration rate of runoff water, high weight was given to high rainfall region. Moreover, high weight was given to course texture soil (Ibrahim-Bathis & Ahmed, Citation2016).
4.3. Delineation of groundwater potential zones
Groundwater potential map was developed using a weighted index overlay analysis by summing up the weight value of each thematic layer. The area score with a high weighted value was considered as groundwater prospective area (Ibrahim-Bathis & Ahmed, Citation2016). Consequently, the groundwater potential map has been classified into five classes with groundwater potentiality from very good to very poor owing to the grading method of equal intervals (). This is attributed as: 2.22% (very good), 26.93% (good), 56.74% (moderate), 13.84% (poor), and 0.26% (very poor).
Figure 10. Groundwater potential zone map of the study area
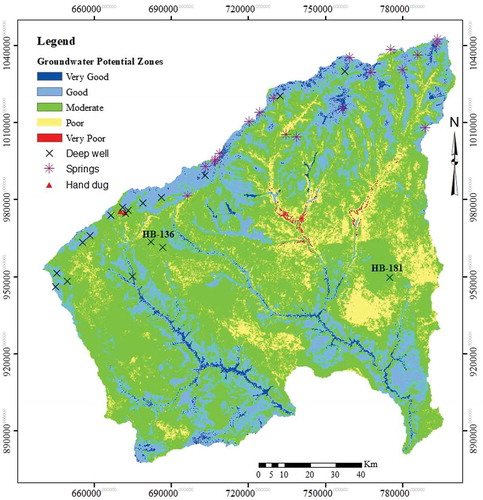
As demonstrates in , very good and good groundwater potential zones are concentrated in the area where Cenozoic (tertiary and quaternary) sedimentary rock (alluvial plain) and volcanic rock (arba gugu basalt and alaji basalts) allocated (Kebede, Citation2013). Those formations are characterized by the presence of high primary and secondary porosity, respectively, and, consequently, have a high potentiality of retaining groundwater since they allow maximum percolation. The groundwater perspective zones also follow the valley section of Dhungeta River and lower portion of Ramis River due to alluvial deposits that could increase the degree of groundwater recharge. Moreover, high lineament density was also illustrated as one of the fundamental factors for groundwater potential zonation (Ibrahim-Bathis & Ahmed, Citation2016). The poor to very poor potential zones are mainly distributed in the areas having high drainage density. Hence, the groundwater potential in these areas could be not sufficient for irrigation and other livelihood requirements. Therefore, groundwater development activities preferred to be performed in high groundwater prospective zones.
4.4. Validation
The results obtained using overlay analyses were compared with spring, hand-dug, and deep well data (). A total of 19 springs, 19 deep wells, and 2 hand-dug data were used for validation, where most of them are positioned on the upper portion of the sub-basin. Data availability in the lower portion of the sub-basin is limited due to topography and scarce population settlement. Besides, due to uneven distribution of point data, preparation of the groundwater level map was not plausible. Therefore, the validity of the groundwater potential map was performed by only overlying the point data of springs, hand-dug and deep well with the map generated using weighted index overlay analysis.
Figure 11. Comparison of groundwater prospective area map generated using weighted overlay analysis of multi-criteria techniques and water point (springs, hand-dug, and deep well)
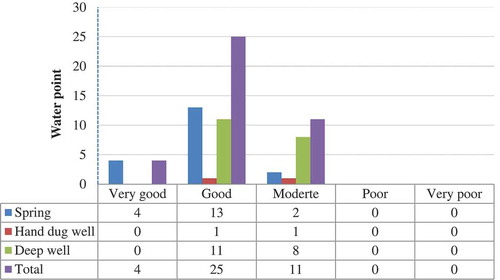
The overlay analysis shows that 89% of springs with static water levels equivalent to ground surface were overlaid good and very good groundwater potential zones. Springs is paramount important for successful groundwater determination, protection, and management, where some researchers use groundwater spring potential zones as an indicator of groundwater potential zones (Moghaddam, Rezaei, Pourghasemi, Pourtaghie, & Pradhan, Citation2015). Moreover, Haghizadeh, Moghaddam, and Pourghasemi (Citation2017) were used spring locations as groundwater indicator to analyze groundwater capacity in the Broujerd region, Lorestan Province, Iran.
Hand-dug well having a shallow static water level of 4.2 m and 11.85 m depth from the ground surface was overlays good and moderate groundwater potential zones, respectively. In regards to deep well, about 58% was overlaid good groundwater potential zone, nerveless, 42% was overlay area classified under moderate groundwater potential zone. However, those wells are very deep and their groundwater level is low as compared to wells in the good potential zone. For instance, the depth of wells HB-181 and HB-136 those overlay moderate groundwater potential zone is about 221 m and 153 m from ground surface, respectively (). An area with a low groundwater level anticipated to lie into the poor groundwater potential zones (Kumar et al., Citation2016). Considering this in an account, the cumulative effect of the weighted multi influencing factors through overlay analysis was obtained as a good platform for mapping of groundwater potential zones in the study area.
5. Conclusion
Mapping groundwater potential using remote sensing data and GIS techniques have been increasingly implemented because of applicability in the inaccessible area, saves time and money. In this study, qualitative analysis was carried out to assess the groundwater potential zones using GIS and remote sensing techniques for Dhungeta-Ramis sub-basin, Wabi Shebele basin, Ethiopia. The study merged effects of different factors account for occurrence and movement of groundwater, namely lithology, LULC, lineament, slope, drainage density, rainfall, and soil with score weight of 25%, 16.5%, 15.5%, 15%, 10.5%, 10%, and 7.5%, respectively.
According to the groundwater potential zone map, sub-basin is categorized into five different zones, namely “very good” (2.22% of the area), “good” (26.93% of the area), “moderate” (56.74% of the area), “poor” (13.84% of the area), and “very poor” (0.26% of the area). The suitable potential groundwater areas are found within Cenozoic (tertiary and quaternary) sedimentary rock (alluvial plain) and volcanic rock (arba gugu basalt and alaji basalts). Moreover, areas with high lineament density are also found as the most potential zone of groundwater. The results obtained using overlay analyses were validated with springs, hand-dug, and deep well data, and it reveals that groundwater potential zonation map generated via weighted index overlay analysis and point data proves satisfactory correlation. Therefore, results obtained could use as a preliminary reference in selecting suitable sites for groundwater resource exploration/exploitation.
The investigation of groundwater potential in certain areas is vital, but further investigation has to be performed to be assured of its reliabilities. Moreover, the studies can be done on the quality and its suitability for different aspects such as drinking, agricultural and industrial activities. Groundwater recharge strongly affects the potential of the groundwater resource. Accordingly, a quantitative investigation of groundwater recharge is recommended for future study as it will aid in giving empirical evidence of the groundwater potential of an area.
Acknowledgments
The author is highly indebted to all secondary data provider organizations. The author is also grateful to those individuals who assist in different stages of this work.
Disclosure statement
No potential conflict of interest was reported by the author.
References
- Al Saud, M. (2018). Mapping potential areas for groundwater storage in Wadi Aurnah Basin, western Arabian Peninsula, using remote sensing and geographic information system techniques. Hydrogeology Journal, 18(6), 1481–1495.
- Alemu, T. (2010). Geological evolution of the northern Ogaden basin: A review. Ethiopian Geosciences and Mineral Engineering Association (EGMEA) Congress, November 8 – 9 2008. Earth Sciences for Society in the context of the UN proclaimed International Year of the Planet Earth 2008.
- Andualem, T. G., & Demeke, G. G. (2019). Groundwater potential assessment using GIS and remote sensing: A case study of Guna tana landscape, upper Blue Nile Basin, Ethiopia. Journal of Hydrology: Regional Studies, 24, 100610.
- Assaf, H., & Saadeh, M. (2008). Geostatistical assessment of groundwater nitrate contamination with reflection on DRASTIC vulnerability assessment: The case of the upper Litani Basin, Lebanon. Water Resources Management, 23(4), 775–796.
- Bahiru, E. A., & Woldai, T. (2016). Integrated geological mapping approach and gold mineralization in Buhweju area, Uganda. Ore Geology Reviews, 72, 777–793.
- Burke, J. J., & Moench, M. H. (2000). Groundwater and society: Resources, tensions and opportunities. Themes in groundwater management for the twenty-first century. United Nations, New York: Department of International Economic and Social Affairs, Statistical Office, United Nations.
- Chenini, I., Mammou, A. B., & Elmay, M. (2010). Groundwater recharge zone mapping using GIS-based multi-criteria analysis: A case study in central Tunisia (Maknassy Basin). Water Resources Management, 24(5), 921–939.
- Chernet, T. (1993). Hydrogeology of Ethiopia and water resources development. Ethiopian institute of geological surveys, Addis Ababa
- Das, B., Pal, S. C., Malik, S., & Rabin Chakrabortty, R. (2019). Modeling groundwater potential zones of Puruliya district, West Bengal, India using remote sensing and GIS techniques. Geology, Ecology, and Landscapes, 3(3), 223–237.
- Elewa, H. H., & Qaddah, A. A. (2011). Groundwater potentiality mapping in the Sinai Peninsula, Egypt, using remote sensing and GIS-watershed-based modeling. Hydrogeology Journal, 19(3), 613–628.
- Elewa, H. H., Qaddah, A. A., & El-Feel, A. A. (2012). Determining potential sites for runoff water harvesting using remote sensing and geographic information systems-based modeling in Sinai. American Journal of Environmental Sciences, 8(1), 42–55.
- Elmahdy, S. I., & Mohamed, M. M. (2016). Mapping of tecto-lineaments and investigate their association with earthquakes in Egypt: A hybrid approach using remote sensing data. Geomatics, Natural Hazards and Risk, 7(2), 600–619.
- El-Sawy, E. K., Ibrahim, A. M., El-Bastawesy, M. A., & El-Saud, W. A. (2016). Automated, manual lineaments extraction and geospatial analysis for Cairo-Suez district (Northeastern Cairo-Egypt), using remote sensing and GIS. International Journal of Innovative Science, Engineering & Technology, 3(5), 491–500.
- FAO/IIASA/ISRIC/ISSCAS/JRC. (2012). Harmonized World Soil Database (version 1.2). FAO, Rome, Italy and IIASA, Laxenburg, Austria.
- Gebrekidan, E. (2005). Water balance and effect of irrigation agriculture on the water quality in meteraha area. MSc thesis, Addis Ababa University pp 105.
- Greenbaum, D. (1985). Review of remote sensing applications to groundwater exploration in basement and regolith (pp. 36). In British geological survey, Overseas Geology Series. Nottingham, UK.
- Gupta, M., & Srivastava, P. K. (2010). Integrating GIS and remote sensing for identification of groundwater potential zones in the hilly terrain of Pavagarh, Gujarat, India. Water International, 35(2), 233–245.
- Haghizadeh, A., Moghaddam, D. D., & Pourghasemi, H. R. (2017). GIS-based bivariate statistical techniques for groundwater potential analysis (an example of Iran). Journal of Earth System Science, 126, 109.
- Han, L., Liu, Z., Ning, Y., & Zhao, Z. (2018). Extraction and analysis of geological lineaments combining a DEM and remote sensing images from the northern Baoji loess area. Advances in Space Research, 62(9), 2480–2493.
- Hashim, M., Ahmad, S., Johari, M. M., & Pour, A. B. (2013). Automatic lineament extraction in a heavily vegetated region using Landsat Enhanced Thematic Mapper (ETM+) imagery. Advances in Space Research, 51(5), 874–890.
- Hoffmann, J., & Sander, P. (2007). Remote sensing and GIS in hydrogeology. Hydrogeology Journal, 15(1), 1–3.
- Hosseinifard, S. J., & Mirzaei Aminiyan, M. (2015). Hydrochemical characterization of groundwater quality for drinking and agricultural purposes: A case study in Rafsanjan Plain, Iran. Water Quality, Exposure, and Health, 7(4), 531–544.
- Hung, L. Q., Batelaan, O., & De Smedt, F. (2005). Lineament extraction and analysis, comparison of LANDSAT ETM and ASTER imagery. Case study: Suoimuoi tropical karst catchment, Vietnam. In the Preceding of Remote Sensing for Environmental Monitoring, GIS Applications, and Geology, 5983, Belgium. doi:10.1117/12.627699.
- Hussein, A., Govindu, V., & Nigusse, A. G. M. (2016). Evaluation of groundwater potential using geospatial techniques. Applied Water Science, 7(5), 2447–2461.
- Ibrahim-Bathis, K., & Ahmed, S. A. (2016). Geospatial technology for delineating groundwater potential zones in Doddahalla watershed of Chitradurga district. India. The Egyptian Journal of Remote Sensing and Space Sciences, 19(2), 223–234.
- Jaiswal, R. K., Mukherjee, S., Krishnamurthy, J., & Saxena, R. (2003). Role of remote sensing and GIS techniques for generation of groundwater prospect zones towards rural development – An approach. International Journal of Remote Sensing, 24(5), 993–1008.
- Jha, M. K., Chowdhury, A., Chowdary, V. M., & Peiffer, S. (2007). Groundwater management and development by integrated remote sensing and geographic information systems: Prospects and constraints. Water Resources Management, 21(2), 427–467.
- Kebede, S. (2013). Groundwater in Ethiopia. Features, numbers and opportunities. Heidelberg, Germany: Springer Hydrogeology. doi:10.1007/978-3-642-30391-3
- Krishna, R., Kishan, D., & Sarup, J. (2015). Lineament extraction and lineament density assessment of Omkareshwar, M P, India, using GIS Techniques. International Journal of Engineering and Management Research, 5(3), 717–720.
- Kumar, P., Herath, S., Avtar, R., & Takeuchi, K. (2016). Mapping of groundwater potential zones in Killinochi area, Sri Lanka, using GIS and remote sensing techniques. Sustainable Water Resources Management, 2(4), 419–430.
- Magesh, N. S., Chandrasekar, N., & Soundranayagam, J. P. (2012). Delineation of groundwater potential zones in Theni district, Tamil Nadu, using remote sensing, GIS and MIF techniques. Geoscience Frontiers, 3(2), 189–196.
- Malczewski, J. (1999). GIS and multicriteria decision analysis. New York: Wiley.
- Moghaddam, D. D., Rezaei, M., Pourghasemi, H. R., Pourtaghie, Z. S., & Pradhan, B. (2015). Groundwater spring potential mapping using bivariate statistical model and GIS in the Taleghan Watershed, Iran. Arabian Journal of Geosciences, 8(2), 913–929.
- Murthy, K. S. R. (2010). Groundwater potential in a semi-arid region of Andhra Pradesh geographical information system approach. International Journal of Remote Sensing, 21(9), 1867–1884.
- Murthy, K. S. R., & Mamo, A. G. (2009). Multi-criteria decision evaluation in groundwater zones identification in Moyale–Teltele subbasin, South Ethiopia. International Journal of Remote Sensing, 30(11), 2729–2740.
- Naghibi, S. A., Moghaddam, D. D., Kalantar, B., Pradhan, B., & Kisi, O. (2017). A comparative assessment of GIS-based data mining models and a novel ensemble model in groundwater well potential mapping. Journal of Hydrology, 548, 471–483.
- Nampak, H., Pradhan, B., & Manap, M. A. (2014). Application of GIS based data driven evidential belief function model to predict groundwater potential zonation. Journal of Hydrology, 513, 283–300.
- Pande, C. B., Khadri, S. F. R., Moharir, K. N., & Patode, R. S. (2017). Assessment of groundwater potential zonation of Mahesh River basin Akola and Buldhana districts, Maharashtra, India using remote sensing and GIS techniques. Sustainable Water Resources Management, 4(4), 965–979.
- Rahmati, O., Samani, A. N., Mahdavi, M., Pourghasemi, H. R., & Zeinivand, H. (2014). Groundwater potential mapping at Kurdistan region of Iran using analytic hierarchy process and GIS. Arabian Journal of Geosciences, 8(9), 7059–7071.
- Russo, T. A., Fisher, A. T., & Lockwood, B. S. (2015). Assessment of managed aquifer recharge site suitability using a GIS and modeling. Groundwater, 53(3), 389–400.
- Sener, E., Davraz, A., & Ozcelik, M. (2005). An integration of GIS and remote sensing in groundwater investigations: A case study in Burdur, Turkey. Hydrogeology Journal, 13(5–6), 826–834.
- Singh, A. K., & Prakash, S. R. (2002). An integrated approach of remote sensing, geophysics and GIS to evaluation of groundwater potentiality of Ojhala subwatershed, Mirzapur district, UP, India. In Proceedings of the First Asian Conference on GIS, GPS, Aerial Photography and Remote Sensing, Bangkok, Thailand.
- Solomon, S., & Quiel, F. (2006). Groundwater study using remote sensing and geographic information systems (GIS) in the central highlands of Eritrea. Hydrogeology Journal, 14(6), 1029–1041.
- Srinivasan, R. Y., & Jugran, K. D. (2003). Delineation of groundwater potential zones and zones of groundwater quality suitable for domestic purposes using remote sensing and GIS. Hydrological Sciences Journal, 48(5), 821–833.
- Srivastava, P. K., & Bhattacharya, A. K. (2006). Groundwater assessment through an integrated approach using remote sensing, using remote sensing, GIS and resistivity techniques: A case study from a hard rock terrain. International Journal of Remote Sensing, 27(20), 4599–4620.
- Teklay, M., Kroner, A., Mezger, K., & Oberhonsl, R. (1998). Geochemistry, Pb-Pb single zircon ages and Nd-Sr isotope composition of Precambrian rocks from southern and eastern Ethiopia: Implications for crustal evolution in East Africa. Journal of African Earth Sciences, 26(2), 207–227.
- Tweed, S. O., Leblanc, M., Webb, J. A., & Lubczynski, M. W. (2007). Remote sensing and GIS for mapping groundwater recharge and discharge areas in salinity prone catchments, southeastern Australia. Hydrogeology Journal, 15(1), 75–96.
- U.S. Geological Survey. (2019). U.S. Geological Survey database Available online at https://earthexplorer.usgs.gov/
- Vaux, H. (2011). Groundwater under stress: The importance of management. Environmental Earth Sciences, 62(1), 19–23.
- Yeh, H. F., Cheng, Y. S., Lin, H. I., & Lee, C. H. (2016). Mapping groundwater recharge potential zone using a GIS approach in Hualian River, Taiwan. Sustainable Environment Research, 26(1), 33–43.
- Yusof, N., Ramli, M. F., Pirasteh, S., & Shafri, H. Z. M. (2011). Landslides and lineament mapping along the Simpang Pulai to Kg Raja highway, Malaysia. International Journal of Remote Sensing, 32(14), 4089–4105.