
 ?Mathematical formulae have been encoded as MathML and are displayed in this HTML version using MathJax in order to improve their display. Uncheck the box to turn MathJax off. This feature requires Javascript. Click on a formula to zoom.
ABSTRACT
Rapid exhaustion of fossil fuels followed by inherent climatic effects arising out of their use has forced the world to search for alternative energy sources. So, almost all nations including developing countries tend to harness renewable energies for the benefit of mankind. One such source is the sun offering clean, and environment-friendly energy. Solar energy can be changed into electricity and as well combined with other energies. This study is intended to model solar energy potential, delineate suitable grid-connected solar photovoltaic (PV) farms, and calculatetheir power generating capacity in the East Shewa Zone of Ethiopia using GIS-based approach combined with analytical hierarchical process. Results showed that 1129 km2 of area in the zone is ideal for the development of large PV solar farms.The findings suggest that as much as 2.2 TW of solar PV electric power can be fed to the grid system.The output of this study is thus useful to the government agencies and entrepreneurs engaged in the exploitation, production and promotion of non-conventional solar energy source in the region.
Introduction
Energy is the main economic artery of countries all over the world (Merrouni et al., Citation2018; Sandén, Citation2005; Toman & Jemelkova, Citation2003) and can indeed be considered as the primary commodity in the economic growth. In recent times, the demand for energy is significantly increasing with increases in population and the rapid development of the world economy (Husain et al., Citation2018). There is a great potential in the deployment of renewable energy source technologies, as these resources are natural, free, rapidly replenished, and are spread worldwide (Hassan et al., Citation2017). Solar photovoltaic (PV) technology is one of the fastest-growing technologies across the globe (Candelise et al., Citation2013). Therefore, the site selection of solar potential sites increasingly important to the investment and has a positive effect on the environment and the society.
The advancement of human civilization including the process of industrialization, development in standard of living, public health, and even the development of art and recreation have historically dependent on the steadily increasing supply of energy (Ouammi et al., Citation2012). Today, one of the main problems that societies are facing is the energy generation and sustainable utilization (Guaita-Pradas et al., Citation2019). Most of the energy resources currently relied on the finite resources and it is likely to be depleted because of the rapid increasing demand. Besides, there have been associated serious environmental pollution problems as a result of the consumption of various conventional energy y resources (Kumar Sahu, Citation2015). It has become clear that continuing to use fossil fuels is not wise not only due to the global impacts on the climate system but also due to both short term and very long-term impacts on society and the ecosystem (Elliot, Citation2007).
Renewable and nonrenewable energy sources can be used to produce secondary energy sources such as electricity. The renewable energy sources include solar, wind, geothermal energy, biomass, hydropower, and energy from ocean water (Kousksou et al., Citation2015). However, most of our energy consumption is dependent on non-renewable energy sources, such as fossil fuels, oil, natural gas, and coal. While the consumption of fossil fuels is increasing regardless of their impact on the environment, today world’s agenda focuses on sustainable energy system in terms of both reliability for economic development and benefits for the environment. Global energy demand is projected to increase by 49% in the next 25 years. Global oil consumption is expected to grow from 86 million barrels per day in 2007 to104 million barrels per day in 2030 (Brink & Marx, Citation2013). According to Tester et al. (Citation2005), the definition of sustainable energy is the combination of providing energy equally to all people and protecting the environment for the next generations. Solar energy is among the most attractive renewable energy sources available on the planet (Chueh & Haile, Citation2010). One important approach to achieve sustainable development is to take advantage of solar energy.
The sun generates most of the energy required for all physical, biological, and industrial processes on the Earth (Dubayah & Rich, Citation1996; Fu & Rich, Citation1999; Ruiz‐Arias et al., Citation2009; Suri & Hofierka, Citation2004). Solar energy has many advantages including being one of the cleanest of all renewable energies since its operation is silent and does not produce carbon dioxide (CO2) or other emissions. Photovoltaic (PV) technology is independent and can be easily adapted to various scenarios (Ackerman et al., Citation2009; Hoffert et al., Citation1998; Wigley et al., Citation1996). Examples; utility-scale photovoltaic can be connected to smart grid networks, and PV can also be adapted to small-scale, off-grid applications such as stand-alone PV power systems on rooftops (Charabi & Gastli, Citation2010, Citation2011). According to a comprehensive life cycle assessment on PV technologies, emissions from the photovoltaic industry are very small as compared to the emissions originating from the fossil-fuel-based plants (DeCanio & Fremstad, Citation2011; Tisza, Citation2014). Utility-size solar PV technology has promising potential for deployment in vast land areas where the amount of solar irradiation per year is very high (Fu & Rich, Citation1999; Ruiz‐Arias et al., Citation2009).
In recent past, many solar radiation estimation models have been developed to measure radiation easier and cheaper than taking multiple sensors to the area to measure the actual radiation. Especially, global radiation estimates have been under development. The model belongs ordinarily into these categories: manual theoretical calculations, satellite data estimates, geostatistics and Geographic Information System (GIS) models (Gastli et al., Citation2010; Kumar et al., Citation1997; Ramachandra & Shruthi, Citation2007). During the last decade, the use of the GIS has accelerated in the field of renewable energy in several regions of the world (Strzalka et al., Citation2012). GIS has been used to develop spatial decision support systems that are designed to help decision-makers to solve spatially related problems by integrating data management and capabilities such as analytical and spatial modeling and spatial display (Carrión et al., Citation2008; Sugumaran & Degroote, Citation2011). A combination of GIS tools and the multi-criteria decision-making (MCDM) technique has become a successful approach to solve the complex problem of site selection for solar plants (Lee et al., Citation2009, Citation2015; Sánchez-Lozano et al., Citation2013; Wilton et al., Citation2014). Many researchers use this technique to evaluate the capacity of their areas to host green power plants (Delivand et al., Citation2015; Kucuksari et al., Citation2014; Massimo et al., Citation2014; Mussa & Suryabhagavan, Citation2019; Ren et al., Citation2012; Xiao et al., Citation2013). In addition, there are many studies on the same subject for wind farms (Aydin et al., Citation2010; Tegou et al., Citation2010).
Geographic Information system (GIS) is a powerful and effective tool to identify suitable sites for large-scale PV installations (Rumbayan et al., Citation2012). Identifying suitable locations with optimum solar potential is essential to cater the increasing demand for power supply (Charabi et al., Citation2016; Hadian et al., Citation2009; Wang et al., Citation2014). Because the decision of power plant sites has a strong relationship with the plant’s security which should meet the meteorology requirement, economics requirement, environment, and society requirement (Zou & Li, Citation2008). The locations with the highest solar resources are not always feasible sites for solar farms. A variety of factors play a role in the site selection of solar farms. They can be categorized into economic, ecological factors, etc. (Van Haaren & Fthenakis, Citation2011). The main objective of the present study was to assess and estimate the solar energy potential for the grid-connected solar photovoltaic farm in East Shewa Zone by integrating AHP and GIS-based mapping models to locate the most appropriate sites for the exploitation of the solar energy in the area.
Materials and methods
The study area
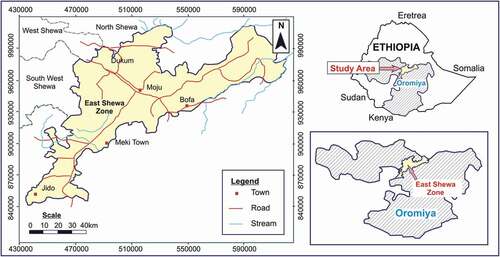
The present study was conducted in the East Shewa Zone of the Oromia Regional State of Ethiopia bounded by latitude 7°33′50″ N‒9° 08′56″ N and longitude 38° 24′ 10″ E‒ 40°05′ 34″ E and covering a total area of 9636 km2 (). The administrative center of the Zone is Adama Town which is at a distance of 100 km from Addis Ababa, the capital city of Ethiopia. The study area lies within the altitudes of 1000 to 3000 m above sea level. According to the National Metrological Agency (NMA), the mean annual temperature of the study area lies in between 20°C and 30°C. This region is well known for its high capacity to produce electricity from wind, PV power plants hydroelectric, geothermal and biomass. The country’s installed generation capacity has reached to 4,280 MW. Out of this 92% is contributed by hydro energy, 6% by wind and remaining 2% by thermal energy source (Belay, Citation2009). The main land-covers in the study area are bare land, grassland, farmland, settlement, shrub land, plantation, forest and waterbody.
Figure 1. Location map of the study area.
Methods
Spatial data and software
The selection of the suitable sites for the installation of large-scale PV solar plants is very complex, and different parameters have to be taken into consideration during the analysis. Indeed, the solar potential alone is not sufficient, the land suitability and its availability have to be taken into consideration as well. For the present study, Landsat Operational Land Imager (OLI) imagery was obtained from the US Geological Survey website (http://glovis.usgs.gov). Besides, Advanced Spaceborne Thermal Emission and Reflection Radiometer (ASTER) from USGS and digital elevation data of 30 m resolution were also used for the present study. The Digital Image data files were acquired as zipped files from the United States Geological Survey (USGS) archive website: http://earthexplorer.usgs.gov. Ethiopian mapping agency topographical maps, Landsat 8 OLI 2016 image, zonal boundary, settlement (town) boundary, road, power-grid lines, solar radiation, elevation, slope, aspect, and land-use and land-cover maps were used in the analysis. Advanced Spaceborne Thermal Emission and Reflection Radiometer (ASTER) data and DEM were used to calculate and generate solar radiation potential, topographic characteristics such as elevation, slope inclination, aspect, and shaded relief of the neighboring terrain features that may affect the amount of incoming solar radiations. Other necessary input data from the secondary data sources were obtained from the concerned organizations and from the earlier studies (). Further, Global Positing System (GPS) survey and photographs were taken for the ground truth in the study area.
Table 1. Data used for the present study.
Software used
In this study, different software packages were used for image processing and spatial analysis. ERDAS Imagine was used for image processing and image classification. ArcGIS was used for storing and managing geographic data in a geo-database package. Further, GIS data were compiled and analyzed in both vector and raster format for the solar radiation potential assessment. IDRISI Silva was used for decision support and uncertainty management of weighting criteria, and an extensive set of criteria aggregation procedures based on a weighted linear combination. The details of the methodology used for the present study are presented in the flow chart ().
Figure 2. Model structure for generating optimal sites for solar farm.
Modeling solar radiation
Solar radiation reaching the surface of the earth shows considerable spatial and temporal variation at the local and on a global scale. On a global scale, the major controlling factors are the latitude, distance from the sun, and time of the year (ESRI, Citation2009, Citation2014). Whereas at the local scale major sources of spatial variation are elevation above the sea level, surface inclination, surface orientation, and shadowing effects of neighboring terrain features. These topographic parameters can be modeled and derived from high-resolution DEM (Hofierka & Cebecauer, Citation2008). To assess the solar potential for a region, it is crucial to develop a solar map with high accuracy. Temperature increase leads to a decrease in the output power and of the conversion efficiency of the PV module (Radziemska, Citation2003). The most important input for the calculation of solar radiation is an accurate, geo-referenced high-resolution DEM. Generally, a solar plant site has to be accessible, relatively close to the town and cities, roads, and electricity grid. For the present study, the road network was built based on the topographic maps of the region and the map acquired from the Ethiopian roads authority, and the transmission lines data were obtained from the Ethiopian Electric Utility office, Addis Ababa.
GIS-based multi-criteria analysis
The site selection process for large-scale solar Photovoltaic Solar farm installation involves various social, technological, environmental, and economic aspects. Usually, to solve this type of problem, researchers and decision-makers use the Multi-Criteria Decision Making (MCDM) methods to handle and bring together wide range of variables assessed in different ways and thus offer useful support to the decision-maker in indicating suitable sites (Abu Taha & Daim, Citation2013; Cristobal & Ramon, Citation2012; Kabite et al., Citation2012; Malczewski, Citation1999, Citation2006; Mussa & Suryabhagavan, Citation2019). To perform suitability analysis for PV solar farms in the present study area, Solar radiation potential, aspect, slope, land-cover, distance from the urban settlement, distance to roads, and power transmission grid were selected as criteria and processed using a GIS-based multi-criteria analysis. All the input datasets were changed into a common 30 m resolution raster and reclassified into four classes. The final result is a standardized vector of the overall weights of the system to examine the consistency of the comparison matrix (Saaty, Citation1980). After a certain number of pair-wise comparisons, some inconsistencies can arise. To check the consistency of the results, through the consistency ratio (CR), first, consistency index (CI) was calculated using the following equation:
where λmax is the maximum eigen value of the composition matrix and n the order of the composition square matrix. The λmax is calculated as the average of elements of the vector where every element is a ratio of the product of weight coefficients (w) and pair-wise comparison matrix as a number, as numerator and vector of weight coefficients as denominator.
where RI is a random consistency index and its value depends on the size of the matrix (n × n) and can be taken from (). If the CR values are lesser or equal to 0.10, the matrix of pair-wise comparison values needs to be adjusted.
Table 2. Nine-point importance scale.
Solar electricity potential calculation
The performance of solar power plants is not significantly affected by temperature. To estimate the amount of electricity that can be generated with the Zone, solar radiation values are used (Charabi & Gastli, Citation2010). Annual solar energy is calculated by using Equationequation 3(3)
(3) (Gastli & Charabi, Citation2010). Further, annual solar energy is generated based on a total area of suitable sites, estimated area factor of panel coverage, and the efficiency of the modules. Thus, solar electricity potential is calculated as
where EGP is electric power generation potential per year (GWh/year), SR is annual mean solar radiation received per unit area (GWh/m2/year), CA is calculated total area of suitable site (km2), AF is area factor, indicates what fraction of calculated areas can be covered by solar panels (%) and η is PV system efficiency (%).
The electricity generation potential was calculated by taking the PV efficiency of five different solar cell materials. For this study, the efficiency (η) value is adopted from the National Renewable Energy Laboratory of the USA (Gaur & Tiwari, Citation2013; Green et al., Citation2013). The calculations also assume that at least 50% of the total area can be covered by solar panels. The annual potential of electricity generation from suitable sites for large-scale PV solar farms using different types of solar cell materials can be computed as follows. After calculating the annual solar energy potential, the annual electric power generation capacity can be obtained by using the following equation:
Power = Energy/Time or GW = GWh/h (4)
where GW is the annual power obtained from the calculated potential energy, GWh is the annual potential energy obtained from the sun, and h is calculated annual sunshine hour.
Factor criteria development
For the present study, all identified factors that may affect the grid-connected PV solar farm site selection were reviewed in their order of importance. These criteria are Global solar radiation potential, aspect, slope, land-cover, power grids, roads, and urban settlement. In this study, the datasets of solar radiation potential, land-cover, population density, proximity to existing road and power transmission networks, and distance to rivers as well as slope and aspect were processed based on different related literatures and studies conducted in different areas (Charabi & Gastli, Citation2011; Janke, Citation2010; Li, Citation2013; Uyan, Citation2013). By considering this criterion, each factor and constraint were analyzed for selecting potential sites for large PV plant installation ().
Table 3. Suitability criteria and constraints for PV solar farm site selection.
Results
In this study, a combination of the multi-criteria decision-making and GIS tool has been used to evaluate the suitability of the study area to host the solar power farm sites. In the present study for solar farm site selection, two scenarios (factors and constraints) were used. The factors that were considered to assess the suitability of sites for PV farms are; Global solar radiation, slope, aspect, distance to power grid, and distance to roads. The constraint that was considered includes forest area, exposed rocks, densely populated areas, and river flood plain. The pair-wise comparison matrices for factors and constraints considered are presented in (). The matrices for factors were produced by using the analytical hierarchy process. The hierarchical decision data were made based on the literature and the logical assumption made through discussions with the experts in the related field.
Table 4. Factor criteria weights’ assignment and constraints used in the suitability model.
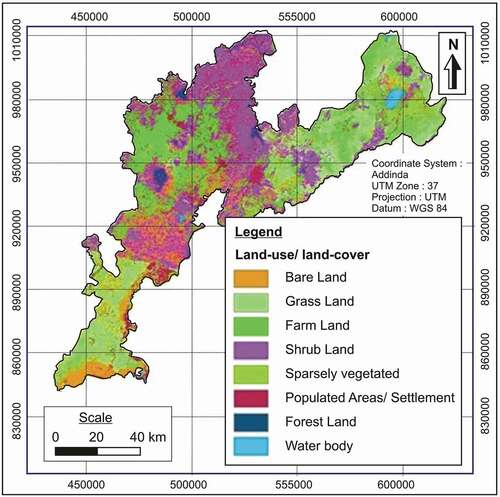
Land use/land cover
The land-use/land-cover map of the study area was classified into eight classes, such as bare land, grassland, farmland, settlement, shrubland, plantation, forest, and waterbody. Major portion of the study area (58.8%) is covered by farmland, followed by bare land (17.83%), settlement (5.4%), shrubland (4.54%), grassland (4.49%), plantation (7%), forest (1.12%), and waterbody (0.65%), respectively (). For solar power technology, the availability of land-use and land-cover is crucial, as land-use classes play a major role in the solar power plant site selection. Some of the land classes may be utilized as suitable land for the installation of the solar PV farm whereas other classes may be constraints for the installation. The land classes such as bare land, shrubland, , and farmland may be suitable land whereas, forestland, settlement, and waterbody may be a constraint for PV farm installations. Thus, accordingly suitable landforms other than constraint lands were considered while making the selection for the PV farm sites in the present study.
Figure 3. Land-use and land-cover map.
Suitability factors
Solar radiation potential factor
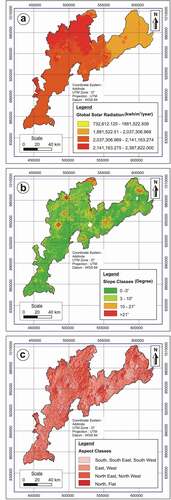
Solar radiation potential factor is the most determinant factor for grid-connected solar farm site selection. It expresses the amount of radiation that reaches on every square meters in a year and it indicates whether the amount of solar radiation is high or low. In order to locate areas receiving high amounts of solar radiation, total global solar radiation was processed for the total surface area of the study area. As a result, the maximum estimated solar radiation is 2,387,822 kWh/m2/year while the minimum solar radiation is 732,612 kWh/m2/year. ) shows the global solar radiation map of the study area. Most of the northern, northwestern, central and some isolated areas in southwestern parts with red color indicates area that receives a high amount of solar radiation. This indicates that the areas have favorable conditions for large PV farm installation irrespective of other factors that hinder the installation of PV farms within the Zone.
Figure 4. Global solar radiation map (a), slope map (b), and (c) aspect map.
Slope
Topography plays an important role in the selection of suitable sites for large PV solar farms over an area and highly affected by the land slope. It is considered a major parameter for land assessment since it highly affects the feasibility and the cost of any solar power project. The slope of the area was divided into four suitability slope classes, namely highly suitable <5%, suitable 5–10%, less suitable 10–21%, and not suitable >21%, respectively. In slope gradient map ()), area indicated in green and lemon color are slopes less or equal to 10°, these are very gentle slopes and are considered as most suitable for grid-connected solar PV sites. On the contrary, areas marked in orange and red colors have steeper slopes which are considered as unfavorable because such areas are not recommendable for a grid-connected solar farm site (Charabi & Gastli, Citation2010; Janke, Citation2010).
Aspect
For aspect of the study, area different directions in which the slopes are inclined were considered: south, southeast, southwest, east, west, northeast, northwest, and north and flat directions as shown in ()). The aspect of the area was divided into four suitability classes such as highly suitable–slope inclined towards south, southwest, southeast; suitable–slope inclined towards east, and west; less suitable–slope inclined towards northeast and northwest and not suitable–slope inclined towards north and flat area. These aspect classes are based on the exposure time of the slopes to the solar radiations and define the general suitability for the grid-connected solar PV farm site.
Distance from power gridlines
Power line accessibility to large PV solar power farm sites is considered to be the major factor. Euclidian distance was employed in ArcGIS in order to see how far or near the PV Solar farm sites will be from the existing Transmission lines ()). The distance to the main transmission line suitability class of the area was divided into four classes such as highly suitable <3 km which is indicated by brown areas, suitable 3−7 km, less suitable 7−12 km and not suitable >12 km, respectively. The proximity of transmission lines from the solar PV site is desirable from an economic point of view as this may considerably reduce the cost for the installation of power lines to connect to the existing power lines from the new PV farm sites (Tegou et al., Citation2010).
Figure 5. Distance to transmission line map (a) and (b) distance to roads map.
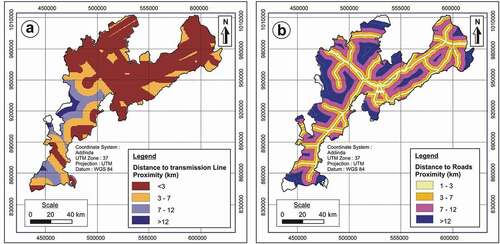
Distance from road network
Road accessibility is important in solar power farm installation. It is required for construction and installation, maintenance, and dismantling of the solar plant (Noorollahi et al., Citation2016; Tegou et al., Citation2010). Thus, close proximity of solar PV sites to the existing roads will be an advantage and it may minimize the cost of the project. In the present study, distance to the main road was divided into four classes,: highly suitable, 1−3 km; suitable, 3−7 km; less suitable, 7−12 km; and not suitable >12 km, respectively. The road network suitability distance map is shown in ).
Constraint criteria
In order to develop a PV solar energy farm at a certain site, as it is necessary to identify factors that contribute to the suitability, constraints should also be identified. For instance, batteries used for solar PV system cover a relatively large area forest covers shall be avoided to protect the environment. Dusty and sandy surface shall also be avoided to prevent the power station from coverage of such particles that affect the efficiency. Besides, the power station site shall avoid bad geological conditions such as fault, rocky, muddy, and easily flooded areas to keep power station safe. Constraints are limitations or restrictions, which prohibit certain elements to be taken into account. For the present study, the constraint that was considered includes forest area, exposed rocks, densely populated areas, and river flood plain. Thus, all such areas which cover these constraints were excluded from the selection of PV solar sites. In addition, a suitable buffer zone from urban settlement and the rivers and flood plains was also considered as constraint for the selection of suitable sites. It implies that all other areas were considered for the suitability analysis for the selection of PV solar sites in the study area.
Urban settlement
The placements of large PV Solar farm sites need sparsely populated areas. The urban area by its nature is highly populated as a result it cannot be recommended to build large PV Solar farms in such populated urban areas. Therefore, area within 2 km of buffer from the urban boundary was taken as constraint whereas area beyond 2 km buffer zone from the urban boundary was considered for the selection of suitable sites ()).
Figure 6. Urban constraints map (a) and (b) river and flood plain constraints map.
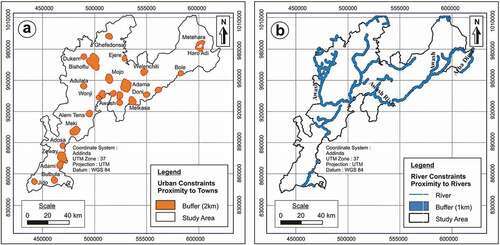
River and flood plains constraint
The river and flood plains are also considered as constraint; therefore, it is not recommendable to deploy solar farm within or near to the flood Plains of the rivers. Accordingly, a 1 km of buffer distance was considered as a constraint in order to protect the PV solar power farm from the flooding ()) to exclude as non-suitable areas for PV solar farm site. Thus, area beyond 1 km from the buffer zone from the river and the flood plains was considered for the selection of suitable sites.
Forest land and rocky exposures
For solar power technology, the availability of suitable land-use and land-cover is crucial, as land-use classes play a major role in the solar power plant site selection. Forest land, settlement, rocky areas, and waterbody may be constraints for PV farm installations. Thus, accordingly, areas covering forestland, settlement, rocky areas, and waterbody were excluded while making the selection for the PV farm sites in the present study. Forest land needs to be excluded from an environmental protection point of view while rocky areas generally result in undulating and steep ground morphology which may not be suitable for the installation of the solar PV farm sites. Besides, areas with rocky exposures may also pose problems in installation and accessibility to the sites.
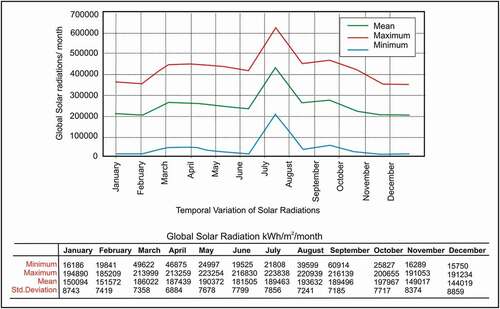
Spatial and temporal distribution
For the present study area, the least global solar radiation distribution per square meter (732,612.125 kWh/m2) was found mainly along the margins of the highland. Whereas the maximum global solar radiation distribution per square meter (2,387,822 kWh/m2) was found in the northwestern and central parts of the study area. The results from the global solar radiation model of the study area have shown considerable monthly variations. A perusal of shows monthly minimum, maximum, and mean global solar radiations, respectively. The minimum solar radiation ranges from December (15,750 kWh/m2) to March (49,622 kWh/m2). The minimum solar radiation during this period is due to the fact that during winters Northern hemisphere has a short sunshine duration and oblique angle of the sun. On the contrary, maximum solar radiation that reaches the surface of the study area ranges from September (216,139 kWh/m2) to February (185,209 kWh/m2).
Figure 7. Monthly temporal variations of global radiation in the study area.
Spatial distributions of PV Solar farms sites
In the present study area, the data sets derived for various factors have shown different degrees of influence on solar power farm site selection. The suitability map obtained by considering various factors, and the constraints show favorable locations for hosting a grid-connected solar energy farm. The suitability map () shows considerable locations, well distributed in the study area, that are suitable to install grid-connected solar power plants. Based on the computed weighted value by using pair-wise comparison with weighted overlay analysis through multi-criteria analysis, a total of 53 feasible locations with optimum solar radiation potential have been identified for the grid-connected PV solar farm sites within the study area (). The northeastern part of the study area including Fentale and Boset district has the lowest number of sites whereas the northern part of the study area in Gimbichu and Boset district has showed the highest number of feasible sites. In the central part, Lomme and Adea district also have a reasonable number of feasible PV solar farm sites. Remaining feasible sites are sparsely distributed among Adama, Bora, Dugda, and Ziway districts in the study area.
Figure 8. Suitability map for feasible grid-connected solar photovoltaic farm sites.
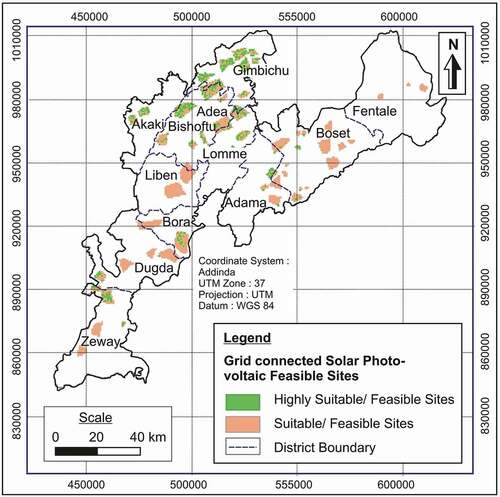
Solar electric power potential capacity
The identified 53 feasible locations with optimum solar radiation potential cover a total area of 1129 km2, which is about 11.7% of the total study area. The northern part of the study area has shown the highest number of feasible sites followed by the central part that showed a reasonable number of feasible sites and remaining feasible sites are sparsely distributed in the study area. For the identified solar PV feasible sites annual electric power generation was also estimated. For the power computations the panel efficiency value for polycrystalline silicon (Poly C-Si) was taken as 20% (Gaur & Tiwari, Citation2013; Green et al., Citation2013). Further, the electric potential was calculated by assuming that at least 50% of the selected area can be covered by the solar panels. Thus, based on the computations it is estimated that a total of 2.2 TW of solar power can be generated from the identified solar PV potential sites in the study area.
Discussion
Selection of a suitable site for solar PV farm installation depends on several factors and constraints. Thus, there is a necessity, first to identify such factors and constraints and later prioritize them for logical decision-making for suitable site selection. In the present study for solar PV farm sites selection integrated GIS-based multi-criteria decision-making (MCDM) approach and analytical hierarchical process (AHP) was followed. For the present study, the factors considered to assess the suitability of sites for PV farms are global solar radiation, slope, aspect, distance to power grid, and distance to roads. The constraint that was considered includes forest area, exposed rocks, densely populated areas, and river flood plain. The matrices for factors were produced by using the AHP which later helped in selecting suitable sites for solar PV farms (Aydin et al., Citation2013; Rylatt et al., Citation2001).
The GIS has demonstrated its principal role in exploiting geographical information for developing a spatial decision-support system for locating solar facilities. Extensive information from the GIS offers significant advantages for determining site suitability for utility-scale solar PV power plants (Carrión et al., Citation2008). To make a proper selection of feasible location for solar farm site in the present study area, extensive literature survey and expert opinion have been utilized. GIS has been used as a primary tool for assessing solar radiation values by analyzing Digital Elevation Models (DEM) by taking into account slope gradient, aspect, and cell surface area (Corripio, Citation2003). Remotely Sensed data, coupled with GIS analysis tools, have shown and displayed spatial variations of solar radiation over the study area. Further, the solar analyst tool in ArcGIS also facilitated to consider the site latitude and elevation, slope, aspect, daily, and seasonal shifts of the sun angle, effects of shadows cast from the surrounding topography and the atmosphere (Ramdé et al., Citation2013). Shuttle Radar Topography Mission (SRTM) digital elevation model was used to derive the aspect angle in azimuth for the investigated area. For the geographical location of the investigated region (in the northern hemisphere), the southern direction is the best in receiving solar radiation, the southwest and southeast are the second and third best areas, respectively. This is because in the northern hemisphere, the north side of slopes is often shaded, while the southern side receives more solar radiation for a given surface area because the slope is tilted towards the sun and it is not shaded directly by the earth itself (Effat, Citation2016). By investigating the literature of similar studies (Chu & Meisen, Citation2011), it is deduced that due to the fact that thermoelectric material is still quite low and in addition, the concentrated thermal solar system is unable to collect diffuse irradiation and relies on direct radiation only.
Through the present study, 53 potential feasible sites for solar PV farm installations were identified in the study area. These sites cover a total area of about 1129 km2, which is about 11.7% of the study area. The northern part of the study area has shown the highest number of feasible sites. These feasible sites mainly fall into Gimbichu and Boset district in the study area. In contrast, the northeastern part of the study area including Fentale and Boset district has the lowest number of sites. The remaining feasible sites are randomly distributed in the central, northwestern, and southwestern parts of the study area. Further, it is estimated that a total of 2.2 TW of solar power can be generated from the identified solar PV potential sites in the study area. It is expected that electricity consumption increases during the summer in particular, mainly due to home air (Jovanovic et al., Citation2011). This is very important for effective planning and solar energy use during the year. The present investigation is unique in terms of choosing a potential location for solar installation in one of the Region in Ethiopia. This work provides a systematic and theoretical framework for the recognition and prioritization of factors influencing solar farm selection sites. The study presents a decision support tool helpful in assisting decision-makers for prioritization of the suitable sites in solar energy generation. Keeping in view the implication discussed in this section, it is obvious that the present investigation is a robust contribution to solar energy installations. Furthermore, there is a wide range of factors that have to be considered before decisions on solar power site locations. Natural factors are basic and this research can help in this process.
Conclusion
Solar energy exploitation depends on various factors. The study has described the GIS-based multi-criteria decision-making approach that was followed to identify the suitable solar PV farm sites in East Shewa Zone, Ethiopia. Global solar radiation, slope, aspect, distance to power grid, and distance to roads were identified as the suitability factors whereas forest area, exposed rocks, densely populated areas, and river flood plain were taken as constraint in the suitability model. The total suitable area for PV farm sites is about 1129 km2 and is well distributed in the study area, with most suitable areas in the northern, northwestern and central parts. The suitability analysis has shown that 53 potential solar PV farm sites in the study area can be exploited to generate a total estimated 2.2 TW of solar power. It was found that the region has a very high potential for implementing solar forms to generate power. The present study would assist government agencies and the investors who are engaged in the development of solar PV farm sites. Also, the present study provides a systematic methodology that can be used for the recognition and prioritization of factors that influence solar farm selection sites. This will encourage and boost the investments in solar energy in this region. Thus, creating new jobs and a sustainable development, not only for the region but also for the whole country.
Acknowledgments
The authors thankfully acknowledge all kinds of supports provided by the School of Earth Sciences, College of Natural and Computational Sciences, Addis Ababa University. The authors would also like to thank the Ethiopian Metrological Agency and Ethiopian Electric Power Cooperation (EEPC) for their support. The first author, Abayneh Gerbo would like to acknowledge the Information Network Security Agency (INSA) for the sponsorship for his higher studies. The authors also extended their gratitude to two anonymous reviewers for their constructive comments and suggestions which markedly improved the manuscript.
Disclosure statement
The authors declare that they have no competing interests.
Correction Statement
This article has been republished with minor changes. These changes do not impact the academic content of the article.
References
- Abu Taha, R., & Daim, T. (2013). Multi-criteria applications in renewable energy analysis, a literature review. In T. Daim, T. Oliver, & J. Kim (Eds.), Research and technology management in the electricity industry. Green Energy and Technology. Springer. pp 17−30. h ttps://d oi.org/1 0.1007/978-1-4471-5097-8_2.
- Ackerman, F., Stanton, E. A., DeCanio, S. J., Goodstein, E., Howarth, R. B., Norgaard, R. B., Norman, C. S., & Sheeran, K. A. (2009). The economics of 350: The benefits and costs of climate stabilization. Economics for Equity and the Environment. pp 1−50. http://sei-us.org/publications/id/31.
- Alsamamra, H., Ruiz-Arias, J. A., Pozo-Vázquez, D., & Tovar-Pescador, J. (2009). A comparative study of ordinary and residual kriging techniques for mapping global solar radiation over southern Spain. Agricultural and Forest Meteorology, 149(8), 1343–1357. https://doi.org/https://doi.org/10.1016/j.agrformet.2009.03.005
- Aydin, N. Y., Kentel, E., & Duzgun, H. S. (2013). GIS‐based site selection methodology for hybrid renewable energy systems: A case study from western Turkey. Energy Conversion and Management, 70, 90–106. https://doi.org/https://doi.org/10.1016/j.enconman.2013.02.004
- Aydin, N. Y., Kentel, E., & Duzgun, S. (2010). GIS-based environmental assessment of wind energy systems for spatial planning: A case study from Western Turkey. Renewable and Sustainable Energy Reviews, 14(1), 364–373. https://doi.org/https://doi.org/10.1016/j.rser.2009.07.023
- Belay, E. (2009). Modeling site suitability for wind farm using remote sensing and GIS: The case study of Adama Woreda [ Master’s Thesis]. School of Earth Science, Addis Ababa University.
- Brink, J., & Marx, S. (2013). Harvesting of Hartbeespoort Dam micro-algal biomass through sand filtration and solar drying. Fuel, 106, 67–71. https://doi.org/https://doi.org/10.1016/j.fuel.2012.10.034
- Candelise, C., Winskel, M., & Robert, J. K. G. (2013). The dynamics of solar PV costs and prices as a challenge for technology forecasting. Renewable and Sustainable Energy Reviews, 26, 96–107. https://doi.org/https://doi.org/10.1016/j.rser.2013.05.012
- Carrión, J. A., Estrella, A. E., Dols, F. A., Toro, M. Z., Rodríguez, M., & Ridao, A. R. (2008). Environmental decision-support systems for evaluating the carrying capacity of land areas: Optimal site selection for grid-connected photovoltaic power plants. Renewable and Sustainable Energy Reviews, 12(9), 2358–2380. https://doi.org/https://doi.org/10.1016/j.rser.2007.06.011
- Charabi, Y., Ben Hadj, R. M., & Gastli, A. (2016). Siting of PV power plants on inclined terrains. International Journal of Sustainable Energy, 35(9), 834–843. https://doi.org/https://doi.org/10.1080/14786451.2014.952298
- Charabi, Y., & Gastli, A. (2010). GIS assessment of large CSP plant in Duqum, Oman. Renewable and Sustainable Energy Reviews, 14(2), 835–841. https://doi.org/https://doi.org/10.1016/j.rser.2009.08.019
- Charabi, Y., & Gastli, A. (2011). PV site suitability analysis using GIS-based spatial fuzzy multi-criteria evaluation. Renewable Energy, 36(9), 2554–2561. https://doi.org/https://doi.org/10.1016/j.renene.2010.10.037
- Chu, Y., & Meisen, P. (2011). Review and Comparison of different solar energy technologies. Global Energy Network Institute (GENI).
- Chueh, W. C., & Haile, S. M. (2010). A thermochemical study of ceria: exploiting an old material for new modes of energy conversion and CO2 mitigation. Philosophical Transactions of the Royal Society A: Mathematical, Physical and Engineering Sciences, 368, 3269–3294. h ttps://d oi.org/1 0.1098/rsta.2010.0114.
- Corripio, J. G. (2003). Vectorial algebra algorithms for calculating terrain parameters from DEMs and solar radiation modeling in mountainous terrain. International Journal of Geographical Information Science, 17(1), 1–23. https://doi.org/https://doi.org/10.1080/713811744
- Cristobal, S., & Ramon, J. (2012). Multi criteria analysis. In J. R. M. San Cristóbal (Ed.), Multi-criteria analysis in the renewable energy industry. Green Energy and Technology. Springer. 1−106. https://doi.org/https://doi.org/10.1007/978-1-4471-2346-0
- CSA. (2007). Central statistics agency. Population and Housing Census of Ethiopia.
- DeCanio, S. J., & Fremstad, A. (2011). Economic feasibility of the path to zero net carbon emissions. Energy Policy, 39(3), 1144–1153. https://doi.org/https://doi.org/10.1016/j.enpol.2010.11.038
- Delivand, M. K., Cammerino, A. R. B., Garofalo, P., & Monteleone, M. (2015). Optimal locations of bioenergy facilities, biomass spatial availability, logistics costs and GHG (greenhouse gas) emissions: A case study on electricity productions in South Italy. Journal of Cleaner Production, 99, 129–139. https://doi.org/https://doi.org/10.1016/j.jclepro.2015.03.018
- Dubayah, R., & Rich, P. M. (1996). GIS-based solar radiation modeling. In M. J. Goodchild, L. T. Steyaert, B. O. Parks, C. Johnston, D. Maidment, M. Crane, & S. Glendinning (Eds.), GIS and environmental modeling: Progress and research issues (pp. 129–134). GIS World Books.
- Effat, H. A. (2016). Mapping solar energy potential zones, using ASTER and spatial analysis, application in lake nasser region, egypt. International Journal of Sustainable Land Use and Urban Planning, 3(1), 1–14. https://doi.org/https://doi.org/10.24102/ijslup.v3i1.551
- Elliot, D. (2007). Sustainable energy: Opportunities and limitations. Palgrave Macmillan.
- ESRI. (2009). Environmental system research institute, Inc. ArcGIS Desktop 9.3Help.
- ESRI. (2014). Environmental system research institute, locating sites for photovoltaic solar. Retrieved February, 2014, from. http://www.esri.com/news/arcuser/1010/solarsiting.html
- Fu, P., & Rich, P. M. (1999). Design and implementation of the Solar Analyst: An ArcView extension for modeling solar radiation at landscape scales. Proceedings of the 19th Annual ESRI User Conference, San Diego.
- Gastli, A., & Charabi, Y. (2010). Solar electricity prospects in Oman using GIS-based solar radiation maps. Renewable and Sustainable Energy Reviews, 14(2), 790–797. https://doi.org/https://doi.org/10.1016/j.rser.2009.08.018
- Gastli, A., Charabi, Y., & Zekri, S. (2010). GIS-based assessment of combined CSP electric power and seawater desalination plant for Duqum-Oman. Renewable and Sustainable Energy Reviews, 14(2), 821–827. https://doi.org/https://doi.org/10.1016/j.rser.2009.08.020
- Gaur, A., & Tiwari, G. N. (2013). Performance of photovoltaic modules of different solar cells. Journal of Solar Energy, 1–13. https://doi.org/https://doi.org/10.1155/2013/734581
- Green, M. A., Emery, K., Hishikawa, Y., Warta, W., . &., & Dunlop, E. D. (2013). Solar cell efficiency tables (version 41). Progress in Photovoltaics, 21(1), 1–11. https://doi.org/https://doi.org/10.1002/pip.2352
- Guaita-Pradas, I., Marques-Perez, I., Gallego, A., & Segura, B. (2019). Analyzing territory for the sustainable development of solar photovoltaic power using GIS databases. Environmental Monitoring and Assessment, 191(12), 764. https://doi.org/https://doi.org/10.1007/s10661-019-7871-8
- Hadian, A., Haghifam, M. R., Zohrevand, J., & Akhavan-Rezai, E. (2009). Probabilistic approach for renewable DG placement in distribution systems with uncertain and time varying loads. Proceedings of 2009 IEEE Power & Energy Society General Meeting (PES) (pp. 1–8). Calgary, AB, Canada.
- Hassan, Z., Al, G., & Awasthi, A. (2017). Solar PV power plant site selection using a GIS-AHP based approach with application in Saudi Arabia. Applied Energy, 206, 1225–1240. h ttps://d oi.org/1 0.1016/j.apenergy.2017.10.024.
- Hoffert, M. I., Caldeira, K., Jain, A. K., Haites, E. F., Harvey, L. D. D., Potter, S. D., Schlesinger., M. E., Stephen, H. S., Watts, R. G., Wigley Tom, M. L., & Donald, J. W. (1998). Energy implications of future stabilization of atmospheric CO2 content. Nature, 395(6705), 881–884. https://doi.org/https://doi.org/10.1038/27638
- Hofierka, J., & Cebecauer, T. (2008). Spatially distributed assessment of solar resources for energy applications in Slovakia. Acta Facultatis Studiorum Humanitatis et Naturae Universitatis Prešoviensis. Prírodné Vedy, Folia Geographica, 12, 97–114.
- Husain, A. A. F., Wan Zuha, W. H., Suhaidi, S., Mohd, N. H., & Shyam, S. P. (2018). A review of transparent solar photovoltaic technologies. Renewable and Sustainable Energy Reviews, 94, 779–791. https://doi.org/https://doi.org/10.1016/j.rser.2018.06.031
- Janke, J. R. (2010). Multicriteria GIS modeling of wind and solar farms in Colorado. Renewable Energy, 35(10), 2228–2234. https://doi.org/https://doi.org/10.1016/j.renene.2010.03.014
- Jovanovic, M., Turanjanin, V., Bakic, V., Pezo, M., & Vucicevic, B. (2011). Sustainability estimation of energy system options that use gas and renewable resources for domestic hot water production. Energy, 36(4), 2169–2175. https://doi.org/https://doi.org/10.1016/j.energy.2010.08.042
- Kabite, G., Suryabhagavan, K. V., Argaw, M., & Hameed, S. (2012). GIS-based solid waste landfill site selection in Addis Ababa, Ethiopia. International Journal of Ecology and Environmental Sciences, 38(2−3), 59–72.
- Kousksou, T., Allouhi, A., Belattar, M., Jamil, A., El Rhafiki, T., Arid, A., & Zeraouli, Y. (2015). Renewable energy potential and national policy directions for sustainable development in Morocco. Renewable and Sustainable Energy Reviews, 47, 46–57. https://doi.org/https://doi.org/10.1016/j.rser.2015.02.056
- Kucuksari, S., Khaleghi, A. M., Hamidi, M., Zhang, Y., Szidarovszky, F., Bayraksan, G., . &., & Son, Y. J. (2014). An Integrated GIS, optimization and simulation framework for optimal PV size and location in campus area environments. Applied Energy, 113, 1601–1613. https://doi.org/https://doi.org/10.1016/j.apenergy.2013.09.002
- Kumar, L., Skidmore, A. K., & Knowles, E. (1997). Modelling topographic variation in solar radiation in a GIS environment. International Journal of Geographical Information Science, 11(5), 475–497. https://doi.org/https://doi.org/10.1080/136588197242266
- Kumar Sahu, B. (2015). A study on global solar PV energy developments and policies with special focus on the top ten solar PV power producing countries. Renewable and Sustainable Energy Reviews, 43, 621–634. https://doi.org/https://doi.org/10.1016/j.rser.2014.11.058
- Lee, A. H. I., Chen, H. H., & Kang, H.-Y. (2009). Multi-criteria decision making on strategic selection of wind farms. Renewable Energy, 34(1), 120−126. h ttps://d oi.org/1 0.1016/j.renene.2008.04.013
- Lee, A. H. I., Kang, H. Y., Lin, C. Y., & Shen, K. C. (2015). An integrated decision-making model for the location of a PV solar plant. Sustainability, 7(10), 13522–13541. https://doi.org/https://doi.org/10.3390/su71013522
- Li, D. (2013). Using GIS and remote sensing techniques for solar panel installation site selection. M.Sc Thesis, University of Waterloo.uwspace.uwaterloo.ca Li, D. (2013). . Renewable Energy, 4, 100–148.
- Malczewski, J. (1999). GIS and multicriteria decision analysis. Wiley.
- Malczewski, J. (2006). GIS-based multicriteria decision analysis: A survey of the literature. International Journal of Geographical Information Science, 20(7), 703–726. https://doi.org/https://doi.org/10.1080/13658810600661508
- Massimo, A., Dell’Isola, M., Frattolillo, A., & Ficco, G. (2014). Development of a geographical information system (GIS) for the integration of solar energy in the energy planning of a wide area. Sustainability, 6(9), 5730–5744. https://doi.org/https://doi.org/10.3390/su6095730
- Merrouni, A. A., Elalaoui, F. E., Ghennioui, A., Mezrhab, A., & Mezrhab, A. (2018). A GIS-AHP combination for the sites assessment of large-scale CSP plants with dry and wet cooling systems. Case study: Eastern Morocco. Solar Energy, 166, 2–12. h ttps://d oi.org/1 0.1016/j.solener.2018.03.038.
- Mussa, A., & Suryabhagavan, K. V. (2019). Solid waste dumping site selection using GIS-based multi-criteria spatial modeling: A case study in Logia town, Afar region, Ethiopia. Geology, Ecology, and Landscapes, 1–13. https://doi.org/https://doi.org/10.1080/24749508.2019.1703311
- Noorollahi, E., Fadai, D., Akbarpour Shirazi, M., & Ghodsipour, S. H. (2016). Land suitability analysis for solar farms exploitation using gis and fuzzy analytic hierarchy process (FAHP)—A case study of Iran. Energies, 9(8), 643. https://doi.org/https://doi.org/10.3390/en9080643
- Ouammi, A., Zejli, D., Dagdougui, H., & Benchrifa, R. (2012). Artificial neural network analysis of Moroccan solar potential. Renewable and Sustainable Energy Reviews, 16(7), 4876–4889. https://doi.org/https://doi.org/10.1016/j.rser.2012.03.071
- Radziemska, E. (2003). The effect of temperature on the power drop in crystalline silicon solar cells. Renewable Energy, 28(1), 1–12. h ttps://d oi.org/1 0.1016/S0960-1481(02)00015-0.
- Ramachandra, T. V., & Shruthi, B. V. (2007). Spatial mapping of renewable energy potential. Renewable and Sustainable Energy Reviews, 11(7), 1460–1480. https://doi.org/https://doi.org/10.1016/j.rser.2005.12.002
- Ramdé, E., Azoumah, Y., Brew-Hammond, A., Rungundu, A., & Tapsoba, G. (2013). Site ranking and potential assessment for concentrating solar power in West Africa. Natural Resources, 4(1), 146–153. https://doi.org/https://doi.org/10.4236/nr.2013.41A019
- Ren, Y. L., Zhou, Y. L., & Shi, L. F. (2012). Decision-making approach in charging mode for electric vehicle based on cumulative prospect theory. Proceedings of 2012 5th China International Conference on Electricity Distribution (CICED 2012), Shanghai, China.
- Ruiz‐Arias, J. A., Tovar‐Pescador, J., Pozo‐Vázquez, D., & Alsamamra, H. (2009). A comparative analysis of DEM‐based models to estimate the solar radiation in mountainous terrain. International Journal of Geographical Information Science, 23(8), 1049–1076. https://doi.org/https://doi.org/10.1080/13658810802022806
- Rumbayan, M., Abudureyimu, A., & Nagasaka, K. (2012). Mapping of solar energy potential in Indonesia using artificial neural network and geographical information system. Renewable and Sustainable Energy Reviews, 16(3), 1437–1449. https://doi.org/https://doi.org/10.1016/j.rser.2011.11.024
- Rylatt, M., Gadsden, S., & Lomas, K. (2001). GIS-based decision support for solar energy planning in urban environments. Computers, Environment and Urban Systems, 25(6), 579–603. https://doi.org/https://doi.org/10.1016/S0198-9715(00)00032-6
- Saaty, T. L. (1980). The analytic hierarchy process. In Planning, priority setting. Resource Allocation, McGraw-Hill.
- Sánchez-Lozano, M., Teruel-Solano, J., Soto-Elvira, P. L., & García-Cascales, M. S. (2013). Geographical Information Systems (GIS) and Multi-Criteria Decision Making (MCDM) methods for the evaluation of solar farms locations: Case study in south-eastern Spain. Renewable and Sustainable Energy Reviews, 24, 544–556. https://doi.org/https://doi.org/10.1016/j.rser.2013.03.019
- Sandén, B. A. (2005). The economic and institutional rationale of PV subsidies. Solar Energy, 78(2), 137–146. https://doi.org/https://doi.org/10.1016/j.solener.2004.03.019
- Strzalka, A., Alam, N., Duminil, E., Coors, V., & Eicker, U. (2012). Large scale integration of photovoltaics in cities. Applied Energy, 9, 413–421. h ttps:d oi.org/1 0.1016/j.apenergy.2011.12.033.
- Sugumaran, R., & Degroote, J. (2011). Spatial decision support systems. Principles and practices. CRC Press.
- Suri, M., & Hofierka, J. (2004). A new GIS-based solar radiation model and its application to photovoltaic assessments. Transactions in GIS, 8(2), 175–190. https://doi.org/https://doi.org/10.1111/j.1467-9671.2004.00174.x
- Tegou, L. I., Polatidis, H., & Haralambopoulos, D. A. (2010). Environmental management framework for wind farm siting: Methodology and case study. Journal of Environmental Management, 91(11), 21–34. https://doi.org/https://doi.org/10.1016/j.jenvman.2010.05.010
- Tester, J. W., Drake, E. M., Driscoll, M. J., Golay, M. W., & Peters, W. A. (2005). Sustainable energy; choosing among options. The MIT Press.
- Tisza, K. (2014). GIS-based suitability modeling and multi-criteria decision analysis for utility scale solar plants in four states in the southeast US. Environmental Engineering and Science, All Theses paper 2005
- Toman, M. T., & Jemelkova, B. (2003). Energy and economic development: An assessment of the state of knowledge. The Energy Journal, 24(4), 93–112. h ttps:d oi.org/1 0.2307/41323014.
- Uyan, M. (2013). GIS-based solar farms site selection using analytic hierarchy process (AHP) in Karapinar region. Konya, Turkey: Renewable & Sustainable Energy Reviews, 28, 11–17. h ttp://dx.d oi.org/1 0.1016/j.rser.2013.07.042.
- Van Haaren, R., & Fthenakis, V. (2011). GIS-based wind farm site selection using spatial multi-criteria analysis (SMCA): Evaluating the case for New York State. Renewable and Sustainable Energy Reviews, 15(7), 3332–3340. https://doi.org/https://doi.org/10.1016/j.rser.2011.04.010
- Wang, Q., M’Ikiugu, M. M., & Kinoshita, I. (2014). A GIS-based approach in support of spatial planning for renewable energy: A case study of Fukushima, Japan. Sustainability (Switzerland), 6(4), 2087–2117. https://doi.org/https://doi.org/10.3390/su6042087
- Wigley, T. M. L., Richels, R., & Edmonds, J. A. (1996). Economic and environmental choices in the stabilization of atmospheric CO2 concentrations. Nature, 379(6562), 240–243. https://doi.org/https://doi.org/10.1038/379240a0
- Wilton, E., Delarue, E., D’haeseleer, W., & van Sark, W. (2014). Reconsidering the capacity credit of wind power: Application of cumulative prospect theory. Renewable Energy, 68, 752–760. https://doi.org/https://doi.org/10.1016/j.renene.2014.02.051
- Xiao, J. H., Yao, Z., Qu, J. J., & Sun, J. H. (2013). Research on an optimal site selection model for desert photovoltaic power plants based on analytic hierarchy process and geographic information system. Journal of Renewable and Sustainable Energy, 5(2), 023132. https://doi.org/https://doi.org/10.1063/1.4801451
- Zou, X., & Li, D. (2008). A multidisciplinary GIS-based approach for the potential evaluation of land consolidation projects: A model and its application. Proceedings ofthe7th WSEAS International conference on Applied Computer and Applied Computational Science, China.