
ABSTRACT
Species distribution can be influenced by different factors that may either be biotic or abiotic. In the Serengeti Ecosystem, most of the studies on species distribution have focused on single species. In contrast, few which considered multispecies have been done in larger protected areas such as Serengeti National Park and left the small areas like Kijereshi Game Reserve (KGR) unexplored. Here, we assessed the impact of vegetation, proximity to humans, and the distance from the roads and waterways on large mammal distribution in the KGR. We used line transects to record locations and numbers of large mammals in the KGR while the distances from boundaries, roads, and waterways were calculated by using QGIS. To assess how large mammals varied in response to different vegetation types, proximity to human settlements, and distances to nearest roads and the waterways, Generalized Additive Model (GAM) was used. Our findings revealed that vegetation and proximity to humans do not significantly affect large mammal density. However, we observed a significant non-linear relationship between large mammal density and distances from the roads and waterways. Therefore, the study findings provide a foundation for large mammal studies in the KGR, which are essential in planning and implementation of wildlife tourism activities.
Introduction
Species distribution can be influenced by different factors (Ashcroft et al., Citation2011; Berg et al., Citation1994; Elmouttie, Citation2009; Reese et al., Citation2005) that may either be biotic or abiotic (Lewis et al., Citation2017). At broad spatial scales, species distribution is mainly shaped by abiotic factors such as rainfall, temperature, and soil (just to mention few) (Austin, Citation2007; Elith & Leathwick, Citation2009; Guisan & Thuiller, Citation2005; Pearson & Dawson, Citation2003;) while biotic factors such as vegetation, predation, and symbiotic relationships govern the distribution of species at finer scales (Benton, Citation2009; Lewis et al., Citation2017; Wiens, Citation2011). Although factors associated with biotic interactions remained less explored in explaining species distribution (Sexton et al., Citation2009), abiotic factors such as rivers and human-modified habitats still need more explorations (Boulangeat et al., Citation2012; Lewis et al., Citation2017).
Vegetation type (Moura et al., Citation2016), disturbances, and water availability (Parker et al., Citation2009) have been mentioned to influence mammal distribution in different places. For the case of vegetation, in Lope Reserve of Gabon, for example, African elephants (Loxodonta africana) prefer habitats with abundant ground vegetation (White, Citation1994). On the other hand, the same species preferred herbaceous vegetations in a protected central African forest (Blom et al., Citation2005). In Chebera Churchura National Park of Ethiopia, African buffaloes (Syncerus caffer) are widely distributed in riverine vegetation (Megaze et al., Citation2018) than in any other vegetation type. On the other hand, disturbances mediated by human activities have been mentioned as one of the significant threats to biodiversity, including large mammals (De Lima et al., Citation2020). For example, the disturbance caused by roads has been mentioned to alter mammal distribution (Bowman et al., Citation2010), and abundance through roadkill (Njovu et al., Citation2019). Other disturbances, such as agricultural activities have affected large mammal distribution through habitat destruction (Krause et al., Citation2011). Even construction activities such as the building of tourist accommodation facilities in wildlife areas do affect large mammals’ abundance and diversity (Rimaze et al., Citation2020). Furthermore, water availability does shape species distribution (Switalski & Bateman, Citation2017) by influencing food availability (Parker et al., Citation2009). For example, during the dry season, elephants in Pangola Game Reserve, South Africa are widely distributed around the Josini Dam and riverine thickets as they are the only places with significant food resources during that season (Shannon et al., Citation2006). In Tarangire National Park, Tanzania, mammal species tend to concentrate in areas around Tarangire River, especially during the dry season (Gereta et al., Citation2004). Therefore, vegetation, disturbance, and water availability have an impact on large mammal distribution, and it is, therefore, important to understand how these factors modify species distribution both locally and globally (Wisz et al., Citation2013).
Kijereshi Game Reserve (KGR) is the smallest protected area in the Serengeti ecosystem. Despite its importance of acting as a western corridor in the ecosystem for the great wildebeest migration, studies on large mammals in the area are very limited. To our understanding, there is no study which has assessed large mammal distribution in the KGR. Most of the studies on large mammal distribution in the Serengeti ecosystem have been conducted in the large Serengeti National Park (for example, Hopcraft et al., Citation2012; Seagle & McNaughton, Citation1992) and are largely focused on single species such as honey badger (Allen et al., Citation2018), wildebeests Wilmshurst et al. (Citation1999), lions (Packer, Citation1990), and elephants (Watson & Bell, Citation1969). This leaves the gap in studying large mammal distribution in the small KGR. Because little has been done simultaneously to assess the impact of the biotic and human-influenced abiotic environment on large mammals (Boulangeat et al., Citation2012), it is therefore important for wildlife conservation to understand the effects of landscape structure on mammal species (Ramesh et al., Citation2016). In addition, the availability of wildlife population and distribution data will enhance quick decision making on the matters pertaining wildlife conservation and management which will save African wildlife (Megaze et al., Citation2018).
Herein, we assessed the impact of vegetation, disturbances (distance from the roads and proximity to humans), and water (distance to the nearby waterway) on the distribution of large mammals in the KGR. Understanding these factors is crucial in planning and implementation of wildlife-based tourism activities such as the location of picnic and camping sites as well as areas for a game drive in the reserve.
Material and methods
Study area
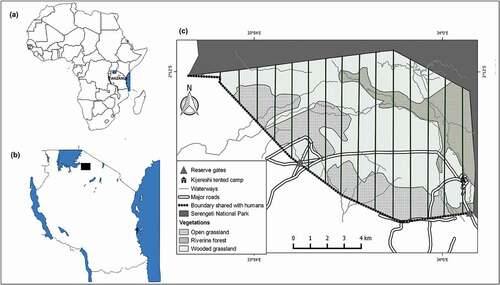
This study was conducted in the KGR which is located in the south-west of Serengeti National Park, and it is one of the components of the western corridor in the Serengeti ecosystem which is used by migratory ungulates. The reserve is within two districts of Simiyu region, Tanzania namely Busega and Bariadi. The reserve covers 65.7 km2, and it was gazetted in 1994 after being upgraded from the Maswa Game Controlled Area (Kideghesho et al., Citation2007). KGR is under IUCN category VI of protected areas, i.e. Managed Resource Protected Areas (Kisingo et al., Citation2016) and it is managed by the Tanzania Wildlife Management Authority (TAWA). Although KGR is in IUCN category VI, the reserve is free from tourist hunting. The reserve has managed to establish a 500 m buffer zone as required by Wildlife Conservation Act No. 5 of 2008 which regulated encroachment to protected area boundaries. However, in August 2019 the Tanzania government announced that all protected areas buffer zones should be returned to the local people hence increase edge effect. The TAWA geographic information unit has classified the KGR into three vegetation types following the Food and Agriculture Organization of the United Nations (FAO) Land Cover Classification System (LCCS). These are riverine forest (covering 9.4% of the reserve area), grassland (25.1%) and wooded grassland (65.5%). Therefore, we referred to these vegetations categories in our analysis. The soil in the KGR is sandy clay loam, and the area receives an annual rainfall of about 750–850 mm (McSherry, Citation2015). The reserve harbours a diversity of wildlife from mammals, birds, reptiles, amphibians to invertebrates. The primary source of water for wild animals in reserve are rivers and streams. The reserve is also bisected by roads used by tourists, Serengeti National Park and accommodation facilities staff, and the public in general.
Data collection
The line transects survey technique was used to count large mammals (mammal weighed at least 1 kg) in the KGR. A total of 15 transects of unequal length (minimum = 723 m, maximum = 9.3 km) were laid to cover the whole protected area () with distance from one transect to another being 1 km. The irregular shape of the KGR caused the length of transects to be unequal. We randomized the location of the first transect while other transects were laid systematically. Three people walked along the transect and record any large mammal observed within 500 m on both sides of the transect. The perpendicular distance (max 500 m) was determined by averaging visual estimations from the three observers who were trained on distance estimation. This approach was used following a recommendation from Milner-Gulland and Rowcliffe (Citation2007). If the animal was observed outside the 500 m, it was recorded but not involved in the analysis. Upon observation, the animal was identified, counted, and recorded in a prepared datasheet. We also recorded the global positioning system (GPS) coordinates of the point of observation. The exercise was conducted in early mornings (0600 h – 1100 h East Africa Time) from 6th to 11 January 2019 during the wet season. Due to a lack of research resources, we were unable to replicate the study in the dry season. Additionally, during dry season animals in the KGR do concentrate on the available water points (A. Eustace pers. obsrv. 2016) while others do move to Serengeti National Park. Thus, we decided to carry out this study during the wet season to increase the chances of encountering many animals. This approach was also applied by Rimaze et al. (Citation2020) when assessing large mammal diversity and abundance in the Kwakuchinja Wildlife Corridor.
Figure 1. Location of the study area: (a) Map of Africa showing the location of Tanzania; (b) Map of Tanzania showing the location of the Kijereshi Game Reserve by a black rectangle; (c) Map of the Kijereshi Game Reserve showing the location of 15 transects laid during large mammal ground count. The boundary shared with humans was the one used to calculate the distance from the boundary which was used as a factor of proximity to humans.
Data analysis
For showing the spatial distribution of large mammals in the KGR, we plotted point locations of the large mammal sightings by using QGIS 2.18 (QGIS Development Team, Citation2016). Because abundance (number of individuals) has been used previously to determine species distribution (Gaston, Citation1996), we similarly used the abundance of mammals to show the spatial distribution of large mammals in the KGR (the point with higher abundance being larger than the point with lower mammal abundance). Furthermore, we overlaid the point location of large mammal sightings to the KGR vegetation layer in QGIS 2.18 (QGIS Development Team, Citation2016) to show how large mammals are distributed across different vegetation structures. Later we used the point sampling tool in QGIS 2.18 (QGIS Development Team, Citation2016) to extract the vegetation of each point where large mammal was sighted. After that, we calculated the density of each species which was referred as a number of individuals recorded in specific vegetation (riverine forest, grassland, and wooded grassland) divide by the area of that specified vegetation.
Furthermore, we calculated distances from the river and road present within the reserve boundaries to the point where a large mammal was recorded. We also calculated the distance to the reserve boundary, which is adjacent to human settlements to assess if proximity to humans has any influence on large mammal distribution. The calculations of distances from the river, road, and proximity to human settlements to the points of mammal sightings were done by using gDistance function from rgeos package (Bivand et al., Citation2018) in R 3.5.1 Patched (R Core Team, Citation2018).
After that, we applied the Generalized Additive Model (GAM) to assess if vegetation, distances from the river and road, and proximity to human settlements have an impact on large mammal density in the KGR. We used GAM as it considers both linear and non-linear relationships by using non-parametric smoothing functions (Murase et al., Citation2009; Snyder et al., Citation2019). Our model included smoothed terms of distance from the waterway and distance from the road. To improve our model, we added the tensor product of the distance from the waterway and distance from the road. The smooth term of distance from boundary neither shows a non-linear relationship with the response variable nor improved our GAM. Therefore, we created the other models with distance from the boundary as the linear term. The other linear terms were vegetation and the interactions between vegetation and distances from the river, road, and boundary. It was not possible to smooth vegetation because it is a categorical variable. Model selection was based on Akaike Information Criterion (AIC) (Marra & Wood, Citation2011) and percentage of deviance explained (Snyder et al., Citation2019). Furthermore, the significance of both linear and non-linear terms of the final model was determined by Wald tests (type III ANOVA) from the anova.gam function within the mgcv package (Wood, Citation2019). We considered a term to be significant when p < 0.05. All GAM analysis was done in R 3.5.1 Patched (R Core Team, Citation2018) by using gam function from mgcv package (Wood, Citation2019).
Results
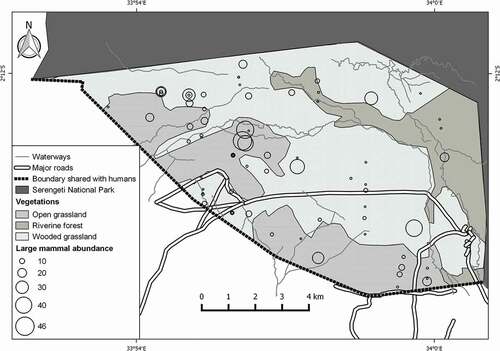
A total of 698 large mammals from 14 species (including six warthogs (Phacochoerus africanus) and five plain zebras (Equus quagga) which were observed outside the transect width) were encountered in this study (). Higher abundance of the large mammals was observed in the interior part of the reserve ().
Table 1. Large mammals recorded in Kijereshi Game Reserve during a line transect survey together with number of individuals observed and their detections. A total of 698 large mammals were recorded in the surveyed area
Figure 2. Distribution of large mammals in Kijereshi Game Reserve. Black circles on the map indicate the points where large mammals were observed in relation to abundance (large circle indicates the point with higher abundance). Overlapping circles indicate the point of which more than one species was encountered. Abundance in this map is referred as number of individuals.
In order to assess large mammal distribution in the KGR we run different combinations of GAMs () and select the best model basing on AIC and percentage of explained deviance. Although we recoded higher large mammal density in open grassland (14 animal/km2) than in wooded grassland (11 animal/km2) and riverine forest (3 animal/km2), our final model showed no significant variation in the distribution of large mammals between the three vegetation types in the KGR (F = 0.175, df = 2, p = 0.840; ). Furthermore, there was no significant interaction, between vegetation and distance from the boundary (F = 1.144, df = 2, p = 0.329), between vegetation and distance from the waterway (F = 0.021, df = 3, p = 0.996), and between vegetation and distance from the road (F = 0.607, df = 3, p = 0.614).
Table 2. Different combinations of models which were run to define large mammal distribution in Kijereshi Game Reserve. We adopted the default values of k and/or bs in the model which we did not specify them in the smoothed (s) and tensor (te) terms. We selected the model with lowest Akaike Information Criterion (AIC) and highest percentage of deviance explained
Although large mammal density increased by an average of 0.24 ± SE 0.12 animal/kilometre from the boundary, there was no significant change in large mammal density in the KGR as moving away from the boundary (F = 3.875, df = 1, p = 0.056). Distance from the road (F = 1.178, df = 7, p = 0.027) and distance from the waterway (F = 1.484, df = 14, p = 0.012) showed a significant non-linear relationship with large mammal density in the KGR. We found that many large mammals do occur below 1.5 km from the major roads however the density of large mammals was highly below the average at the distance between 1.5 km and 2.9 km from the major roads ()). Furthermore, many recordings of large mammals were made below 1 km from the waterway however the density of large mammals in the KGR was highly below the average in <0.2 km and after 1.3 km from the waterway ()).
Figure 3. Response curves of the smoothed terms as determined by our generalized additive model (GAM). The solid line is the predicted value of the density as a function of the distance from the road (a) and distance from the waterway (b). The shaded area indicates standard error from the mean while the small lines along the x-axis (like inside tick marks) indicates sample observations.
Discussion
Large mammals and their distribution in Kijereshi Game Reserve
African elephant, Thomson’s gazelle, and white-bearded wildebeest were observed in higher number than other species we recorded in KGR (). The African elephant has a large home range of about 191–3698 km2 (about 3–56 times the size of the KGR) and covers longer distance seasonally (Kikoti, Citation2009). This suggests that KGR could have one elephant herd, which is very mobile; hence it was encountered several times during six days of our survey. This situation was also encountered by Chambegga et al. (Citation2007) when surveyed large mammals in Saadani National Park, Tanzania. A higher number of Thomson’s gazelle could be due to the availability of short grasses in most parts of the KGR which are among preferred habitats for the species (IUCN SSC Antelope Specialist Group,Citation2018). The higher abundance of wildebeest in the KGR could be explained by the reasons for their domination in the Serengeti ecosystem. These reasons are: presence of flat and wide dental arcade which enables them to feed on high-quality forage materials, having synchronized breeding during wet season where nutritious forage is available, and breeding highly precocial calves which have the ability to escape predators by mixing itself in a large herd (Hopcraft, Citation2010). On the other hand, our results are inconsistent with those of Sinclair (Citation1972) who surveyed large mammals in the Serengeti and found impala, topi, and hartebeest (kongoni) as the most abundant large mammal species. This could be due to the fact that the study of Sinclair (Citation1972) is nearly 50 years old, and the author focused on non-migratory species. Furthermore, our findings were inconsistent with Caro (Citation2015) who found that buffalo, zebra, and hippopotamus are highly abundant species in Katavi National Park.
Although large mammal density was higher in open grasslands than in wooded grasslands and riverine forests, we found non-significant variation in large mammal density between the three vegetation types in the KGR. Our results are consistent with Gandiwa (Citation2014) who found vegetation structure and composition being a non-primary factor for large mammal distribution in the Gonarezhou National Park, Zimbabwe. However, our findings are inconsistent with Caro (Citation2015) who found a variation in large mammal densities between different vegetations in Katavi National Park, Tanzania. Furthermore, our results do not conform to Mworia et al. (Citation2008) who found vegetation to be a significant factor influencing large mammal distribution in the south-east Kajiado, Kenya during the dry season.
Impact of road, proximity to humans and rivers on large mammal distribution in the Kijereshi Game Reserve
We did not record a significant change in large mammal density as moving away from the boundary. This could be influenced by the presence of a buffer zone which was already secured at the time of this study. Buffer zones provide the opportunity for local people to practice sustainable wildlife utilization encouraging wildlife-based economies and minimizing human edge effects on the protected areas (Watson et al., Citation2013; Woodroffe & Ginsberg, Citation1998). By securing buffer zones, the periphery part of the protected area is regulated from human activities (Kiffner et al., Citation2013); hence wild animals could be less affected by human disturbance. This result is similar to Kiffner et al. (Citation2013) who found large mammal (herbivores) distribution in Katavi National Park does not vary significantly as moving away from the park boundary. However, with the current changes in land use where protected area buffer zones have been returned to the people for different activities, including agriculture and establishment of settlements, the situation might be different.
We recorded a significant non-linear relationship between large mammal abundance and distance from the road ()). The non-linear relationship could be influenced by the presence of other biotic (competition, predation, and other ecological interactions) and abiotic (soil and rainfall) factors which interact with our variables. For the case of distance from the road and large mammal distribution, we observed that most of the large mammals preferred to be in areas below 1.5 km from the road ()). Probably, the low level of vehicle traffic in the KGR is tolerable to the large mammals hence staying below 1.5 km from the road is not a problem. This observation was also pointed out by Sangiwa and Magige (Citation2019) who mentioned that low road usage has less disturbance and therefore tolerable to species. Similarly, Forman et al. (Citation2003) and Caro (Citation1999) mentioned that road impacts do positively correlate with vehicle traffic; hence the KGR roads which have low vehicle traffic do not have a severe impact on large mammals. The road can also become beneficial to wildlife, for example, wolves (Canis lupus) have appeared to benefit from roads (Musiani & Paquet, Citation2004) as they use them as corridors to travel between different habitats (James et al., Citation2004). In addition to that, the vegetation changes which occur across the roads and the presence of minerals near or within the road attracts some species of ungulate (Laurian et al., Citation2008).
Furthermore, many large mammals were observed below 1 km ()) from the waterway. This could be due to the fact that areas closer to water points are rich in food (Parker et al., Citation2009) and drinking water (Gaylard et al., Citation2003) which are important factors governing species distribution (Megaze et al., Citation2018). This finding is consistent with Mworia et al. (Citation2008) who found the distribution of large mammals in south‐east Kajiado, Kenya to be influenced by proximity to water sources with most of the animals found to be close to the water sources. Similarly, our results do conform with Gereta et al. (Citation2004) who observed high concentration of large mammals along the Tarangire River in Tarangire National Park, Tanzania. Although Shannon et al. (Citation2006) did their study during the dry season, they found elephants in Pangola Game Reserve, South Africa concentrated in water-rich areas as they have enough food. The decline in large mammal density below the average at <0.2 km from the waterway ()) could mean a few species in the KGR are water dependent. This could be shown by a lower number of buffaloes and waterbuck () which are water dependent species (Estes et al., Citation2012; Rimaze et al., Citation2020). The lower density of large mammals after 1.3 km from the waterway ()) could mean that few species in the KGR are adapted to live far from the water sources. Additionally, being far from the water sources could be one of the strategies to avoid predation as it has been observed that lions do hunt their prey close to the water sources (De Boer et al., Citation2010).
Conclusions and recommendations
KGR has a significant diversity of large mammals, including both residents and non-residents. In this study, we encountered 687 individuals from 12 species whose distribution varied in relation to distance from the road and distance from the waterway, but vegetation and proximity to protected area boundary do not have influence. There have been some observations of migratory wildebeest in the KGR, especially in November (G. Hopcraft and T. Morrison pers. comm. 2019). Still, in this study, we did not observe any migratory ungulates as our study was conducted in January. Therefore, long-term mammal monitoring in the KGR is recommended as it will help to understand a pattern of ungulates migration in the area.
Furthermore, the reserve is currently developing tourist circuit roads of about 88 km. These roads were not included in our analysis, so future studies on the impact of roads on wild animals are recommended to quantify the impact of these new roads. Finally, this study focused on diurnal large mammals; it would be better to consider conducting further studies on small mammals, nocturnal mammals, birds, and other animal groups whose distribution is affected by different biotic and abiotic factors.
Availability of data and material
The data that support the findings of this study are available from Kijereshi Game Reserve (KGR) and Tanzania Wildlife Management Authority (TAWA), but restrictions apply to the availability of these data, which were used under permission for the current study, and so are not publicly available. Data are however available from the authors upon reasonable request and with the authorization from KGR and TAWA.
Authors’ contributions
All authors contributed to the study conception and design. Material preparation and data collection were performed by Daud Mathew Gunda and Diana Chambi while Abraham Eustace performed analysis. The first draft of the manuscript was written by Abraham Eustace, and all authors commented on previous versions of the manuscript. All authors read and approved the final manuscript.
Acknowledgments
We thank Tanzania Wildlife Management Authority (TAWA) for the support and funding. We also appreciate the staffs from Kijereshi Game Reserve, Zonal Anti-Poaching Unit of Serengeti (APU-Bunda), and Zonal Anti-Poaching Unit of Lake Zone (APU-Mwanza) for their support during data collection. Furthermore, we thank Thomas Hesselberg for reviewing this manuscript before submission. Finally, we acknowledge the comments from two anonymous reviewers and Rudolf Mremi which significantly improved this manuscript.
Disclosure statement
No conflict of interest to declare
References
- Allen, M. L., Peterson, B., & Krofel, M. (2018). No respect for apex carnivores: Distribution and activity patterns of honey badgers in the Serengeti. Mammalian Biology, 89(1), 90–94. https://doi.org/https://doi.org/10.1016/j.mambio.2018.01.001
- Ashcroft, M. B., French, K. O., & Chisholm, L. A. (2011). An evaluation of environmental factors affecting species distributions. Ecological Modelling, 222(3), 524–531. https://doi.org/https://doi.org/10.1016/j.ecolmodel.2010.10.003
- Austin, M. (2007). Species distribution models and ecological theory: A critical assessment and some possible new approaches. Ecological Modelling, 200(1–2), 1–19. https://doi.org/https://doi.org/10.1016/j.ecolmodel.2006.07.005
- Benton, M. J. (2009). The red queen and the court jester: Species diversity and the role of biotic and abiotic factors through time. Science, 323(5915), 728–732. https://doi.org/https://doi.org/10.1126/science.1157719
- Berg, A., Ehnström, B., Gustafsson, L., Hallingbäck, T., Jonsell, M., & Weslien, J. (1994). Threatened plant, animal, and fungus species in Swedish Forests: Distribution and habitat associations. Conservation Biology, 8(3), 718–731. https://doi.org/https://doi.org/10.1046/j.1523-1739.1994.08030718.x
- Bivand, R., Rundel, C., Pebesma, E., Stuetz, R., Hufthammer, K. O., Giraudoux, P., Davis, M., & Santilli, S. (2018) Package ‘rgeos’. Comprehensive R Archive Network. Retrieved June 23, 2019, from https://cran.rstudio.com/web/packages/rgeos/rgeos.pdf
- Blom, A., van Zalinge, R., Heitkönig, I. M. A., & Prins, H. H. T. (2005). Factors influencing the distribution of large mammals within a protected central African forest. Oryx, 39(4), 381–388. https://doi.org/https://doi.org/10.1017/S0030605305001080
- Boulangeat, I., Gravel, D., & Thuiller, W. (2012). Accounting for dispersal and biotic interactions to disentangle the drivers of species distributions and their abundances. Ecology Letters, 15(6), 584–593. https://doi.org/https://doi.org/10.1111/j.1461-0248.2012.01772.x
- Bowman, J., Ray, J. C., Magoun, A. J., Johnson, D. S., & Dawson, F. N. (2010). Roads, logging, and the large-mammal community of an eastern Canadian boreal forest. Canadian Journal of Zoology, 88(5), 454–467. https://doi.org/https://doi.org/10.1139/Z10-019
- Caro, T. (2015). Roads through national parks: Successful case study. Tropical Conservation Science, 8(4), 1009–1016. https://doi.org/https://doi.org/10.1177/2F194008291500800411
- Caro, T. M. (1999). Abundance and distribution of mammals in Katavi National Park, Tanzania. African Journal of Ecology, 37(3), 305–313. https://doi.org/https://doi.org/10.1046/j.1365-2028.1999.00181.x
- Chambegga, O. A., Msyani, E. K., Nyakunga, O. A., & Hagwet, M. (2007) An inventory of the large mammals in Saadani National park. In: J. D. Keyyu & V. Kakengi (eds) Proceedings of the 6th TAWIRI scientific conference, 3rd - 6th December 2007 Arusha International Conference Centre, Arusha, Tanzania (pp. 158–172). Arusha, Tanzania: Tanzania Wildlife Research Institute.
- de Boer, W. F., Vis, M. J. P., de Knegt, H. J., Rowles, C., Kohi, E. M., van Langevelde, F., Peel, M., Pretorius, Y., Skidmore, A. K., Slotow, R., van Wieren, S. E., & Prins, H. H. T. (2010). Spatial distribution of lion kills determined by the water dependency of prey species. Journal of Mammalogy, 91(5), 1280–1286. https://doi.org/https://doi.org/10.1644/09-MAMM-A-392.1
- de Lima, D. O., Banks‐Leite, C., Lorini, M. L., Nicholson, E., & Vieira, M. V. (2020). Anthropogenic effects on the occurrence of medium‐sized mammals on the Brazilian Pampa biome. Animal Conservation. https://doi.org/https://doi.org/10.1111/acv.12618
- Elith, J., & Leathwick, J. R. (2009). Species distribution models: Ecological explanation and prediction across space and time. Annual Review of Ecology, Evolution, and Systematics, 40(1), 677–697. https://doi.org/https://doi.org/10.1146/annurev.ecolsys.110308.120159
- Elmouttie, D. (2009). Utilization of seed resources by small mammals: A two-way interaction [PhD Dissertation]. Queensland University of Technology. http://eprints.qut.edu.au/30239/1/David_Elmouttie_Thesis.pdf. Accessed 10 February 2019
- Estes, R. D., Otte, D., & Wilson, E. O. (2012). The behavior guide to African mammals: Including Hoofed Mammals, Carnivores, Primates. 20th anniversary edition. University of California Press.
- Forman, R. T. T., Sperling, D., Bissonette, J. A., Clevenger, A. P., Cutshall, C. D., Dale, V. H., Fahrig, L., France, R., Goldman, C. R., Heanue, K., Jones, J. A., Swanson, F. J., Turrentine, T., & Winter, T. C. (2003). Road ecology: Science and solutions. Island Press.
- Gandiwa, E. (2014). Vegetation factors influencing density and distribution of wild large herbivores in a southern African savannah. African Journal of Ecology, 52(3), 274–283. https://doi.org/https://doi.org/10.1111/aje.12114
- Gaston, K. J. (1996). The multiple forms of the interspecific abundance-distribution relationship. Oikos, 76(2), 211–220. https://doi.org/https://doi.org/10.2307/3546192
- Gaylard, A., Owen-Smith, N., & Redfern, J. (2003). Surface water availability: Implications for heterogeneity and ecosystem processes. In J. T. Du Toit, K. H. Rogers, & H. C. Biggs (Eds.), The Kruger experience: Ecology and management of savanna heterogeneity (pp. 171–188). Island Press.
- Gereta, E., Meing’ataki, G. E. O., Mduma, S., & Wolanski, E. (2004). The role of wetlands in wildlife migration in the Tarangire ecosystem, Tanzania. Wetlands Ecology and Management, 12(4), 285–299. https://doi.org/https://doi.org/10.1007/s11273-005-3499-2
- Guisan, A., & Thuiller, W. (2005). Predicting species distribution: Offering more than simple habitat models. Ecology Letters, 8(9), 993–1009. https://doi.org/https://doi.org/10.1111/j.1461-0248.2005.00792.x
- Hopcraft, J. G. C. (2010) Ecological implications of food and predation risk for herbivores in the Serengeti. PhD Thesis, University of Groningen.
- Hopcraft, J. G. C., Anderson, T. M., Pérez‐Vila, S., Mayemba, E., & Olff, H. (2012). Body size and the division of niche space: Food and predation differentially shape the distribution of Serengeti grazers. Journal of Animal Ecology, 81(1), 201–213. https://doi.org/https://doi.org/10.1111/j.1365-2656.2011.01885.x
- IUCN SSC Antelope Specialist Group. (2018). Eudorcas thomsonii. The IUCN red list of threatened species 2018: E.T8982A50188023. IUCN. https://doi.org/https://doi.org/10.2305/IUCN.UK.2018-2.RLTS.T8982A50188023.en
- James, A. R. C., Boutin, S., Hebert, D. M., & Rippin, A. B. (2004). Spatial separation of caribou from moose and its relation to predation by wolves. Journal of Wildlife Management, 68(4), 799–809. https://doi.org/https://doi.org/10.2193/0022-541X(2004)068[0799:SSOCFM]2.0.CO;2
- Kideghesho, J. R., Røskaft, E., & Kaltenborn, B. P. (2007). Factors influencing conservation attitudes of local people in Western Serengeti, Tanzania. Biodiversity and Conservation, 16(7), 2213–2230. https://doi.org/https://doi.org/10.1007/s10531-006-9132-8
- Kiffner, C., Stoner, C., & Caro, T. (2013). Edge effects and large mammals. Animal Conservation, 16(1), 97–107. https://doi.org/https://doi.org/10.1111/j.1469-1795.2012.00577.x
- Kikoti, A. P. (2009). Seasonal home range sizes, trans-boundary movements and conservation of elephants in Northern Tanzania. PhD Dissertation, University of Massachusetts. Open Access Dissertations, 108. https://doi.org/https://doi.org/10.7275/3mmp-ed60
- Kisingo, A., Rollins, R., Murray, G., Dearden, P., & Clarke, M. (2016). Evaluating ‘good governance’: The development of a quantitative tool in the Greater Serengeti Ecosystem. Journal of Environmental Management, 181(1), 749–755. https://doi.org/https://doi.org/10.1016/j.jenvman.2016.08.002
- Krause, B., Culmsee, H., Wesche, K., Bergmeier, E., & Leuschner, C. (2011). Habitat loss of floodplain meadows in north Germany since the 1950s. Biodiversity and Conservation, 20(11), 2347–2364. https://doi.org/https://doi.org/10.1007/s10531-011-9988-0
- Laurian, C., Dussault, C., Ouellet, J. P., Courtois, R., Poulin, M., & Breton, L. (2008). Behavior of moose relative to a road network. Journal of Wildlife Management, 72(7), 1550–1557. https://doi.org/https://doi.org/10.2193/2008-063
- Lewis, J. S., Farnsworth, M. L., Burdett, C. L., Theobald, D. M., Gray, M., & Miller, R. S. (2017). Biotic and abiotic factors predicting the global distribution and population density of an invasive large mammal. Scientific Reports, 7(1), 44152. https://doi.org/https://doi.org/10.1038/srep44152
- Marra, G., & Wood, S. N. (2011). Practical variable selection for generalized additive models. Computational Statistics & Data Analysis, 55(7), 2372–2387. https://doi.org/https://doi.org/10.1016/j.csda.2011.02.004
- McSherry, M. E. (2015) Human-managed vs. natural grazing systems: Exploring effects of livestock and wildlife grazing at multiple scales. Dissertations - ALL. Paper 335. Retrieved February 10, 2019, from https://surface.syr.edu/cgi/viewcontent.cgi?article=1335&context=etd
- Megaze, A., Balakrishnan, M., & Belay, G. (2018). Current population estimate and distribution of the African buffalo in Chebera Churchura National Park, Ethiopia. African Journal of Ecology, 56(1), 12–19. https://doi.org/https://doi.org/10.1111/aje.12411
- Milner-Gulland, E. J., & Rowcliffe, J. M. (2007). Conservation and sustainable use: A handbook of techniques. Oxford University Press Inc.
- Moura, M. R., Villalobos, F., Costa, G. C., & Garcia, P. C. A. (2016). Disentangling the role of climate, topography and vegetation in species richness gradients. PLoS ONE, 11(3), e0152468. https://doi.org/https://doi.org/10.1371/journal.pone.0152468
- Murase, H., Nagashima, H., Yonezaki, S., Matsukura, R., & Kitakado, T. (2009). Application of a generalized additive model (GAM) to reveal relationships between environmental factors and distributions of pelagic fish and krill: A case study in Sendai Bay, Japan. ICES Journal of Marine Science, 66(6), 1417–1424. https://doi.org/https://doi.org/10.1093/icesjms/fsp105
- Musiani, M., & Paquet, P. C. The practices of wolf persecution, protection and restoration in Canada and the USA. (2004). Bioscience, 54(1), 50–60. https://doi.org/https://doi.org/10.1641/0006-3568(2004)054[0050:TPOWPP]2.0.CO;2
- Mworia, J. K., Kinyamario, J. I., & Githaiga, J. M. (2008). Influence of cultivation, settlements and water sources on wildlife distribution and habitat selection in south‐east Kajiado Kenya. Environmental Conservation, 35(2), 117–124. https://doi.org/https://doi.org/10.1017/S0376892908004670
- Njovu, H. K., Kisingo, A. W., Hesselberg, T., & Eustace, A. (2019). The spatial and temporal distribution of mammal roadkills in the Kwakuchinja Wildlife Corridor in Tanzania. African Journal of Ecology, 57(3), 423–428. https://doi.org/https://doi.org/10.1111/aje.12608
- Packer, C. (1990) Serengeti lion survey: Report to TANAPA, SWRI, MWEKA and the Wildlife Division. University of Minnesota. Retrieved December 08, 2019, from http://www.cbs.umn.edu/sites/cbs.umn.edu/files/public/downloads/Serengeti_Lion_Survey_1990.pdf
- Parker, K. L., Barboza, P. S., & Gillingham, M. P. (2009). Nutrition integrates environmental responses of ungulates. Functional Ecology, 23(1), 57–69. https://doi.org/https://doi.org/10.1111/j.1365-2435.2009.01528.x
- Pearson, R. G., & Dawson, T. P. (2003). Predicting the impacts of climate change on the distribution of species: Are bioclimate envelope models useful? Global Ecology and Biogeography, 12(5), 361–372. https://doi.org/https://doi.org/10.1046/j.1466-822X.2003.00042.x
- QGIS Development Team. (2016). QGIS 2.18 Las Palmas. Free Software Foundation, Inc.
- R Core Team. (2018). R: A language and environment for statistical computing. R Foundation for Statistical Computing. https://www.R-project.org/
- Ramesh, T., Kalle, R., Colleen, T., & Downs, C. T. (2016). Predictors of mammal species richness in KwaZulu-Natal, South Africa. Ecological Indicators, 60(1), 385–393. https://doi.org/https://doi.org/10.1016/j.ecolind.2015.07.011
- Reese, G. C., Wilson, K. R., Hoeting, J. A., & Flather, C. H. (2005). Factors affecting species distribution predictions: A simulation modeling experiment. Ecological Applications, 15(2), 554–564. https://doi.org/https://doi.org/10.1890/03-5374
- Rimaze, D., Machumu, A., Mremi, R., & Eustace, A. (2020). Diversity and abundance of wild mammals between different accommodation facilities in the Kwakuchinja Wildlife Corridor, Tanzania. Sci Afr, 9, e00480. https://doi.org/https://doi.org/10.1016/j.sciaf.2020.e00480
- Sangiwa, M. W., & Magige, F. J. (2019). Effects of roads on small mammal diversity and abundance in the northern Serengeti, Tanzania. African Journal of Ecology, 57(4), 565–574. https://doi.org/https://doi.org/10.1111/aje.12637
- Seagle, S. W., & McNaughton, S. J. (1992). Spatial variation in forage nutrient concentrations and the distribution of Serengeti grazing ungulates. Landscape Ecology, 7(4), 229–241. https://doi.org/https://doi.org/10.1007/BF00131254
- Sexton, J. P., McIntyre, P. J., Angert, A. L., & Rice, K. J. (2009). Evolution and ecology of species range limits. Annual Review of Ecology, Evolution, and Systematics, 40(1), 415–436. https://doi.org/https://doi.org/10.1146/annurev.ecolsys.110308.120317
- Shannon, G., Page, B., Slotow, R., & Duffy, K. (2006). African elephant home range and habitat selection in Pongola Game Reserve, South Africa. African Zoology, 41(1), 37–44. https://doi.org/https://doi.org/10.1080/15627020.2006.11407333
- Sinclair, A. R. E. (1972). Long term monitoring of mammal populations in the Serengeti: Census of non-migratory ungulates, 1971. African Journal of Ecology, 10(4), 287–297. https://doi.org/https://doi.org/10.1111/j.1365-2028.1972.tb00873.x
- Snyder, K. D., Mneney, P., Benjamin, B., Mkilindi, P., & Mbise, N. (2019). Seasonal and spatial vulnerability to agricultural damage by elephants in the western Serengeti, Tanzania. Oryx, 1–11. https://doi.org/https://doi.org/10.1017/S0030605318001382
- Switalski, A. B., & Bateman, H. L. (2017). Anthropogenic water sources and the effects on Sonoran Desert small mammal communities. PeerJ, 5, e4003. https://doi.org/https://doi.org/10.7717/peerj.4003
- Watson, F., Becker, M. S., McRobb, R., & Kanyembo, B. (2013). Spatial patterns of wire-snare poaching: Implications for community conservation in buffer zones around National Parks. Biological Conservation, 168, 1–9. https://doi.org/https://doi.org/10.1016/j.biocon.2013.09.003
- Watson, R. M., & Bell, R. H. (1969). The distribution, abundance and status of elephant in the Serengeti region of northern Tanzania. The Journal of Applied Ecology, 6(2), 115–132. https://doi.org/https://doi.org/10.2307/2401532
- White, L. J. T. (1994). Biomass of Rain Forest Mammals in the Lope Reserve, Gabon. The Journal of Animal Ecology, 63(3), 499–512. https://doi.org/https://doi.org/10.2307/5217
- Wiens, J. J. (2011). The niche, biogeography and species interactions. Philosophical Transactions of the Royal Society B: Biological Sciences, 366(1576), 2336–2350. https://doi.org/https://doi.org/10.1098/2Frstb.2011.0059
- Wilmshurst, J. F., Fryxell, J. M., Farm, B. P., Sinclair, A. R. E., & Henschel, C. P. (1999). Spatial distribution of Serengeti wildebeest in relation to resources. Canadian Journal of Zoology, 77(8), 1223–1232. https://doi.org/https://doi.org/10.1139/z99-088
- Wisz, M. S., Pottier, J., Kissling, W. D., Pellissier, L., Lenoir, J., Damgaard, C. F., Dormann, C. F., Forchhammer, M. C., Grytnes, J., Guisan, A., Heikkinen, R. K., Høye, T. T., Kühn, I., Luoto, M., Maiorano, L., Nilsson, M., Normand, S., Öckinger, E., Schmidt, N. M., Termansen, M., … Svenning, J. (2013). The role of biotic interactions in shaping distributions and realized assemblages of species: Implications for species distribution modelling. Biological Reviews, 88(1), 15–30. https://doi.org/https://doi.org/10.1111/j.1469-185X.2012.00235.x
- Wood, S. N. (2019). Package ‘mgcv’: Mixed GAM computation vehicle with automatic smoothness estimation: R package version 1.8-28. Comprehensive R Archive NetworkRetrieved June 23, 2019, from https://cran.r-project.org/web/packages/mgcv/mgcv.pdf
- Woodroffe, R., & Ginsberg, J. (1998). Edge effects and the extinction of populations inside protected areas. Science, 280(5372), 2126–2128. https://doi.org/https://doi.org/10.1126/science.280.5372.2126