
ABSTRACT
This study is focused on the morphometric evaluation of some hydrological parameters of the streams/rivers in Chaohu Lake Basin and its influence on land-use changes in the basin. The hydrological parameters considered here include drainage network, linear morphometric, areal, and relief parameters as well as the focal statistics of the stream variables in the Chaohu Lake catchment. Morphometric analyses and assessments of the basin were carried out (in ESRI©ArcGIS 10.6.3) utilizing the remotely sensed georeferenced Digital Elevation Model (DEM) data obtained from Shuttle Radar Topographic Mission (SRTM) while the land-use change analyses (executed in ESRI© ArcGIS) was based on Maximum Likelihood supervised Classification (MLC) of subsets of Landsat MSS and OLI/TIRS images acquired in 1979 and 2015. Linear morphometric results from the analyses include river and stream length (18.22 km), stream order (1–4), mean stream length (0.01 km), bifurcation ratio (2.11–4.34) and mean bifurcation ration (2.15) respectively. The areal morphometric attributes extracted include drainage density (670.85 km2), basin perimeter (789.3 km), basin area (13,350 km2), Circularity ratio (Rc, 0.0059) and relief aspects with the highest value at 1.282 m and the lowest elevation at −7 m. The drainage system here is designated as the fourth-order stream of a majorly dendritic pattern which may be a result of the structural and geomorphological influence on the stream system. In this study, the analyses and understanding of the dynamics of the different streams in the basin are shown to indicate the easy accessibility to the abundant freshwater systems in the basin which has contributed to the changes in land-use patterns over the last five decades in the basin. The notable changes include the increase of agricultural lands from 29.8% in 1979 to 45.2% in 2015; and the built-up (urban) areas from 3.5% in 1979 to 25.1% in 2015, respectively.
1. Introduction
Studies related to the quantification of drainage basin morphometric parameters are well established in the literature (Abdoud & Nofal, Citation2017; Horton, Citation1945; Markose et al., Citation2014; Poyraz et al., Citation2011; Resmi et al., Citation2019; Saha et al., Citation2017; Strahler, Citation1952). Morphometric studies of drainage basins are very vital in the understanding of different features and characteristics of the hydrological system (especially the rivers) of the basin (Dubey et al., Citation2015; Saha et al., Citation2017; Strahler, Citation1964). Morphometric analyses are the mathematical and quantitative exemplification of the earth’s features and the application of this to drainage basin is very important in the understanding of the processes that shape the earth (Clarke, Citation1966 ; Saha et al., Citation2017). A drainage basin reflects the earth’s surface geology and its sub-surface lithology (Cox, Citation1994; Mahmood & Gloaguen, Citation2012); the driving geomorphic processes operating in such system (Chorley et al., Citation1984); and the revelation of the basin’s hydro-geological behavior (e.g., Clarke, Citation1966; Horton, Citation1945; Merritts & Vincent, Citation1989; Oguchi, Citation1997; Resmi et al., Citation2019; Strahler, Citation1952). Therefore, the quantitative analyses of the basin’s morphometric variables are important in understanding the morphodynamics of the basin’s resource potentials (Rajasekhar et al., Citation2020; Resmi et al., Citation2019), structural and tectonic disturbances (e.g., Pérez-Peña et al., Citation2010; Pophrae & Balpande, Citation2014), possibilities of flood hazard evaluation (Resmi et al., Citation2019; Seta et al., Citation2005), determination of erosion intensity and rates (e.g., Gardiner, Citation1990; Ozdemir & Bird, Citation2009), and in the understanding of the interaction between geology, geomorphology, and the climate of the basin (e.g., Magesh et al., Citation2011; Resmi et al., Citation2019; Singh et al., Citation2014).
Quantitative morphometric analysis of a basin requires the measurements of the linear, relief/aerial and gradient of the channel network as well as the evaluation/measurement of drainage density, network diameter, basin area, etc. are now being engaged in a GIS environment (e.g., Harvey & Eash, Citation1996; Mesa, Citation2006; Rai et al., Citation2017; Rajasekhar et al., Citation2020; Resmi et al., Citation2019; Saha et al., Citation2017; Thomas et al., Citation2012), which are different from the conventional methods (Horton, Citation1945; Strahler, Citation1952, Citation1964). Morphometry of any drainage basin or river system fundamentally focuses on the mathematical quantification of the physiography and hydro-geomorphic evolution of the drainage or river basin (Clarke, Citation1966; Swarnkar et al., Citation2020). This form of drainage basin analysis is very essential in the development of an integrated understanding of i) the hydro-geomorphic systems of the basin (Swarnkar et al., Citation2020; Yang & Shi, Citation2017); ii) the geomorphic response of the basin to various processes and their driving factors (Bahrami et al., Citation2020; Gregory & Walling, Citation1968); iii) the assessment of tectonically controlled landscapes (Pedrera, Pérez-Peña, Galindo-Zaldívar, Azañόn & Azor, Citation2009; Bahrami et al., Citation2020; Faghih & Nourbakhsh, Citation2015; Rahimzadesh et al., Citation2019); iv) the quantitative evaluation of sediment yields, and the relationship between the sediment yields records and the river basins (Ludwig & Probst, Citation1998; Verstraeten & Poesen, Citation2001); and, v) anthropogenic impacts of humans on the basins and that of the basins on human societies (Keller & Pinter, Citation2002).
Lake Chaohu, the fifth largest freshwater lake in China, is a shallow eutrophic lake with catchment areas of 13,350 km2 and it major inflowing rivers in the basin accounting for over 80% total runoff that feeds the lake with only one outlet (Jiang et al., Citation2014; Oyedotun, Citation2019; Xue et al., Citation2017). The importance of the Lake and its basin area to the ancient and recent civilizations have made it to be the subject of diverse academic studies and investigations. The focus of these studies varied but most are on the impact of land-use activities, especially agricultural activities, on the pollution of sediments and Rivers of the basin (e.g., Jiang et al., Citation2014; Kong et al., Citation2013; Shau et al., Citation2016; Wen et al., Citation2012; Zan et al., Citation2011). Other studies examined the outbreak of cyanobacteria bloom (Shang & Shang, Citation2005); Spatio-temporal variations of the bacterioplankton community composition of the lake (Wei et al., Citation2008); and the implication/benefits of land-use changes and human activities on the Lake Chaohu and its environment (e.g., Chen et al., Citation2013; Huang et al., Citation2013; J-H. Wang et al., Citation2012; Kang et al., Citation2016; Li et al., Citation2009; Liu et al., Citation2012; Oyedotun, Citation2019; J. Tang et al., Citation2015; Wu et al., Citation2010; Xue et al., Citation2017; Yang et al., Citation2011; Yu et al., Citation2011; W. Z. Tang et al., Citation2010; Zan et al., Citation2011; Zwisler et al., Citation2003). Despite these wider studies on various parameters of the basin, no detailed morphometric analysis of the rivers and stream systems in the basins has been considered. Hence this present study aims to evaluate and delineate the morphometric parameters of Chaohu Lake basin using GIS techniques. It is hoped that the evaluation of morphometric parameters and flow characteristics of this basin will also aid in the understanding of the influence of the basin on land-use changes in the area and also contribute to the wider understanding of the basin. Specifically, the objective of this study is to evaluate the linear, areal, and relief morphometric characteristics of the Chaohu Lake basin in a GIS environment to give an overview of different geo-hydrological features of the drainage basin.
2. Materials and methods
2.1 Description of the study area
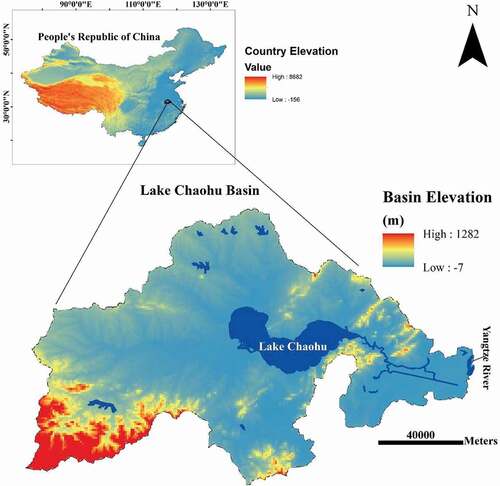
The Lake Chaohu watershed is on the left bank of the Yangtze River and covers a catchment area of 13,350 km2 . The catchment is subjected to the transitional subtropical warm temperate monsoon climate associated and thereby exposed to 1000–1158 mm annual mean precipitation (Ji, Citation2009; Wen et al., Citation2012). The basin is located in the central part of Anhui Province and between 117°16’46’16” – 117°51’54’ 51” E, 30°43’28’ 43” – 31°25’28’ 25” N in the southeast, China . The watershed belongs to the drainage system in the lower reaches of the Yangtze River, and it is the fifth-largest freshwater lake (at 13,350 km2) in China (Huang et al., Citation2013). The Lake Chaohu with the surface area of 770 km2 has the total annual inflow of 4.8 × 10⁹ × m3 from the approximately 33 main rivers that drain into the lake and the total outflow of 3.4 × 10⁹ × m3 year−1 (Huang et al., Citation2013). The riverine runoff has been noted to be the important route for the transport of contaminants to the Lake (J. Tang et al., Citation2015; X. Wang et al., Citation2013). It is a typical shallow lake with a mean depth of 3 m (X. Wang et al., Citation2013). The mean annual temperature for the basin area ranges between 15°C and 16°C (Huang et al., Citation2013) and the hydro-ecological environment of the basin area made it suitable for the production of rice and fish (Huang et al., Citation2013; Shang & Shang, Citation2005; Zwisler et al., Citation2003). In terms of human population and economic activities, the Chaohu Lake basin area remains one of the most densely populated in the Anhui Province with a total population of more than 9.65 million which support the local economic developments of the area accounting for approximately 25% of the Province’s Gross Domestic Products (Huang et al., Citation2013; Jiang et al., Citation2014; Xue et al., Citation2017).
Figure 1. The study area showing the relative elevation/relief of the basin topography (inset: its location in the Federal Republic of China).
2.2 Data source and analytical approach
Detailed drainage morphometric features of Chaohu Basin are of importance in the understanding of the hydrological parameters of the surface runoff of the basins. These hydrological features are examined by analyzing the Digital Elevation Model (DEM) in a Geographic Information System (GIS) Environment. The detail of the data used, and the methodology adopted are briefly discussed below:
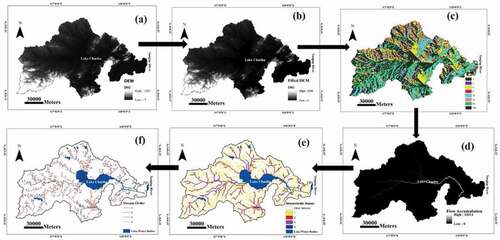
2.2.1Data Source: DEM Data: Georeferenced Digital Elevation Model (DEM) data of 30 m spatial resolution was obtained from Shuttle Radar Topographic Mission (SRTM) from http://srtm.csi.cgiar.org/ and was consequently developed and analyzed for the preparation of digital elevation model used in streams and morphometric parameters extractions, slope and aspect map of the area and other important basin morphometric characteristics about three-dimensional surfaces that can be extracted from digital elevation (after Rai et al., Citation2017). The more dependable and consistent Arc Hydro tools in ESRI © ArcGIS version 10.6.3 was used for drainage extraction, which is better than using manual methods (Akram et al., Citation2012).
Landsat Satellite data: Multi-Spectral Scanner (MSS) and Operational Land Imager (OLI) – Thermal Infrared Sensor (TIRS) for the year 1979 and 2015 of spatial resolution f 79 m and 30 m, respectively, were sourced from the US Geological Survey (USGS) depository (https://earthexplorer.usgs.gov) and these were used for Land Use/Land Cover (LULC) classification. These imageries were registered in the same projection, the Universal Transverse Mercator (UTM) projection World Geodetic System (WGS) 1984 Zone 50 N and the Spectral Bands Green (0.5–0.6 µm), Red (0.6–0.7 µm), and Near Infrared (0.8–1.1 µm) as composite images were used for the classification (Oyedotun, Citation2019). Landsat images are known to be very vital in the classification of different landscape categories and components at a larger scale (Butt et al., Citation2015).
2.2.2Drainage network and morphometric analysis: The drainage system of the Chaohu Lake basin was extracted using a series of geoprocessing tools in ArcGIS 10.6.3 . The extracted drainage systems/lines/rivers were then ordered based on Strahler (Citation1952)’s system of stream classification. For stream ordering, Horton’s law was followed by describing the unbranched stream as the first-order stream, and when the first-order streams meet it is labeled as the second-order stream. The linking together of the two second-order streams results in the formation of the third-order stream, etc. (after Horton, Citation1945). The number of each order is calculated and recorded. The hierarchical orders of the basin’s drainage networks from the DEM were based on the D8 (multi-directional method) in the ArcGIS. These morphometric parameters are calculated based on the widely reported standard methods and formulae (e.g., Black, Citation1972; Chorley et al., Citation1957; Hack, Citation1975; Horton, Citation1945; Patton & Baker, Citation1976; Rai et al., Citation2017; Resmi et al., Citation2019; Saha et al., Citation2017; Singh & Dubey, Citation1994; Smart & Surkan, Citation1967; Sreedevi et al., Citation2005; Strahler, Citation1952, Citation1964).
The hydrology tools in ArcGIS facilitated the processing of the vital stream parameters including flow direction, flow accumulation, and stream order . The stream feature tool was used to evaluate the linear hydrological parameter of the drainage network through the computation of the channel features, the spread of drainages, and the drainage network. The basin boundary was utilized in the determination of stream branches, average slope, drainage density, stream number and order, bifurcation ratio, stream ratio, length of the stream, etc. The areal parameters of the basin network were analyzed through the X and Y axes computations of the basin. The specific areal parameters considered here are basin length, perimeter, area, form factor, circulatory ratio, and density – which are all calculated using standard methods identified in the literature sample above.
Figure 2. Extraction of drainage networks from DEM – (a) DEM -> (b) Filled DEM -> (c) Flow Direction -> (d) Flow Accumulation -> (e) Stream Order Raster -> (f) Stream Order Vector.
2.2.3Focal statistics: The statistical relations between different stream parameters were also analysed in ArcGIS. Here, the focal statistics enhancement technique was applied to the rasterized derived stream network to increase the visual interpretability of the spread of the streams in the basin and also to facilitate their visual delineation. For the delineation, focal statistics calculation was run to identify and locate the point of basin’s highest stream deposit throughout the basin by using the settings of the neighborhood, and the circular the radius of 20 km at sum statistics type. Secondly, the focal statistics mean function was also used to average out and map out the zones of high and low mean stream networks (settings used for this is neighborhood, circular radius of 20 km, and mean as the statistical type). The focal statistics used here performed a neighborhood operation whereby the output of the raster value for each cell is a function of the values of all the input cells that are in a specified neighborhood around that location (after Bryn et al., Citation2013; Ghadiry et al., Citation2012). The focus statistics here are used to produce the sum, mean, and standard deviation of the stream network in the Chaohu Lake basin. A standard deviation from the mean is often used to push the tails of histograms beyond their original minimum-maximum values (after Salem et al., Citation2010) and this was also applied to the mean of the spread of stream network in Chaohu Lake basin.
2.2.4Image classification: Image classification is the mostly-used conventional method in land-use change observation, especially for any Land Use/Land Cover (LULC) delineation activities because of its ability to create series of land cover maps (El Garouani et al., Citation2017). Here, the Maximum Likelihood Classification (MLC) supervised method in ArcGIS was applied to classify Landsat bands for 1979 and 2015 images, after they have been pre-processed, geo-referenced, mosaicking and sub-setting to the Area of Interest (AoI) (from Oyedotun, Citation2019). This classification method (MLC) is based on the likelihood of a pixel (Picture element) that belong to a class is assumed (in theory) to be the representative of the classes that are evenly and equally distributed with the certainty of maximum likelihood of the distribution (El Garouani et al., Citation2017). The steps taken for image classification here have been well detailed in the open access published work on the Lake and it is hereby referred for full description and explanation (Oyedotun, Citation2019). The approach used in the previous study and also here has been the most widely used in LULC change assessment with greater acceptable accuracies (e.g., Butt et al., Citation2015; El Garouani et al., Citation2017; Islam et al., Citation2018). It works on the basis that a satisfactory spectral significance is the one with “minimal confusion” from the land covers being mapped (Butt et al., Citation2015). For the land classification reported here (and following the previous study), four (4) classes are identified. These are (1) Water, which are the rivers, open/surface water, streams, reservoirs, lakes; (2) Built-up Areas – indicates the areas with built-up residential, commercial, industrial, and mixed-up settlements including road networks, transportation services, and other visible evidence of human constructions; (3) Vegetation, as identified in the image classification, constitute both mixed and uncultivated forested areas; and, (4) Agricultural Land represents the agricultural practices, whether organized or unorganized, crops fields, cultivated and fallow lands, etc., that can be classified in the remotely sensed images.
3. Results and discussion
The results of different morphometric analyses of the data are presented in this section.
3.1 Drainage
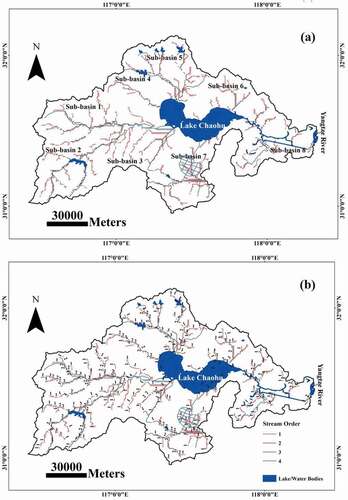
The total drainage for Lake Chaohu basin was 13,350 km2 and eight (8) sub-basins are identified . The dendritic drainage pattern is the dominant system of the river system of the Chaohu basin, although other drainage types/patterns are observed which indicate the possible impact of lithological, tectonic, and/or geomorphological influence on the streams systems. The majorly dendritic pattern observed here is as a result of the majorly homogenous strata of the study area and this is characterized by the spreading, tree-like pattern with irregular branching in many directions and angles . Apart from the dendritic pattern, rectangular to sub-rectangular patterns at a higher elevation and zigzag to the angular pattern is noticeable with the minor channels/streams. At the lower altitude, linear to parallel/sub-parallel forms of drainage patterns can be identified . In terms of stream order, the Chaohu Lake basin can be categorized as a four-order stream . This hierarchical ordering and segmentation of the streams in the basin are essential in the understanding of the hydrodynamic of the basin (e.g., Rai et al., Citation2017). The stream order here directly corresponds with the size of the channel dimensions, the subsidizing sub-basins, and the river discharge. In this study, the stream order is ranked based on the method suggested by Strahler (Citation1964) and as described in Section 2.2.2, using the extracted SRTM data. The figure of the stream order is presented in ) while the ordering linear characteristics are presented. As the rivers runoff from the headwater towards the mouth of the streams and eventually the Lake, the rivers and the streams progressively increase their thickness, width, and volume of discharge to the Lake (similar to Sarmah et al., Citation2012). The basin could, however, be described and designated as maximum fourth-order stream with the higher-order streams having their larger discharge and velocity of flow discharging into the Lake Chaohu.
Figure 3. The drainage network system and sub-basin of Lake Chaohu (a) and the stream order of the Lake (b).
3.2 Linear morphometric parameters of the Chaohu Lake basin
The linear morphometric parameters of a drainage network reveal the morphologic dynamics of the rivers and their tributaries, from the source or headwater to the mouth or the waterbody. They also reveal the influence of lithological, geological, accommodation space, and structural controls of the basin (Resmi et al., Citation2019). The morphological characteristics of streams for Chaohu Lake basin, as derived from the DEM and considered here, consist of the stream number, stream length, stream order, mean stream length, and bifurcation ratio . Stream number, here, accounts for the total number of streams delineated from the DEM as present in the basin. About 1,814 of streams of different lengths could be accounted for in the basin, with variations in their length, coverage, and order. For this identified total stream number, 57.3% are classified as stream order one, 27.1% as stream order two, 12.7% as stream order three, and the remaining 2.9% classified as the fourth-order stream, respectively, . However, the minimum length of the stream is ~0.0059 km while the maximum is at 0.058 km . The variations in the stream length and order in the entire basin could be attributed to structural and physiographic conditions of the basin in addition to artificial anthropogenic intervention of channel modification and construction to support the growing agricultural activities in the basin Section 3.5.
Table 1. Linear morphometric parameters for Chaohu Basin.
Table 2. Stream order and the stream order parameters.
The river and stream length of the maximum area of the basin follows a particular order and these are presented in . The extraction of the streams network from the DEM is the indication of drainage extent suggesting the influence of accommodation space and bedrock control in the determination of stream drainage density . Specifically, stream order and different line density can be linked to the differences in topographic (elevation) and slope conditions which suggest that there is a positive relationship between the surface flow discharge (runoff) and the concentration of the drainage density. Here the total stream channels in each of the orders are called stream number and these stream numbers are directly proportional to the size of the contributing watershed area and channel extents . The higher stream number could be an indication of less infiltration, porosity, or permeability in the basin as the maximum frequencies of the first-order stream are not clear in all of the order.
The stream lengths of each of the orders in the Chaohu basin are shown in . The cumulative stream length of the first-order stream (10.77 km) is higher than that of the second, the third and the fourth-order stream at 4.68 km, 2.27 km, and 0.50 km, respectively. This observation corroborates Horton’s (Citation1945) that the length of the stream segments of the first-order stream is maximum and decreases as the stream order increases, except where the nonconformity in general behavior is characterized by high elevation, moderately steep slope or variable bedrock/beyond the surface lithology (Singh et al., Citation2014).
Bifurcation Ratios (Rb) for the Chaohu basin range from 2.11 to 4.34 with the mean bifurcation ratio (Rbm) at 2.15 . It has been stated that where bifurcation ratios of any basin range between 3.0 and 5.0, such basin has the potential of deformation of drainage pattern through geological control or structures (Resmi et al., Citation2019) whereas if the mean of the bifurcation ratio (Rbm) range from 3.0 to 5.0, the geological structures would not influence on the drainage pattern (Resmi et al., Citation2019; Romshoo et al., Citation2012; Verstappen, Citation1983). With the derived values for bifurcation ratio (Rb = 2.11–4.34) and mean bifurcation ratio (Rbm = 2.15) , these indicate that the geological control may have been playing a crucial role in the drainage networks, systematic stream branching, and variations in stream frequency of each stream order of Chaohu Lake basin.
The Drainage Density (DD) represents the measurement of the total stream lengths in the basin to the area of the basin (Strahler, Citation1964), and this is associated with several features of landforms segmentations. Examples of such segmentations include channel head source area, valley density, the elevation/relief (Montgomery & Dietrich, Citation1989); soil and rock features (Kelson & Wells, Citation1989); climate and vegetation features (Moglen et al., Citation1998); and landform developments (Rai et al., Citation2017). The drainage density (DD) of the basin at 670.85 km2 suggests that the basin area is connected with the intermediate drainage and low to moderate relief (elevation) and this is indicated in . , here, however, presents the drainage density distribution of each stream in the basin. The higher drainage density suggests that the stream is connected with fine drainage texture, high runoff, and erosional potential while the relatively low drainage density would suggest coarse drainage texture (Strahler, Citation1964).
Figure 4. Drainage density distribution of streams in Chaohu Basin.
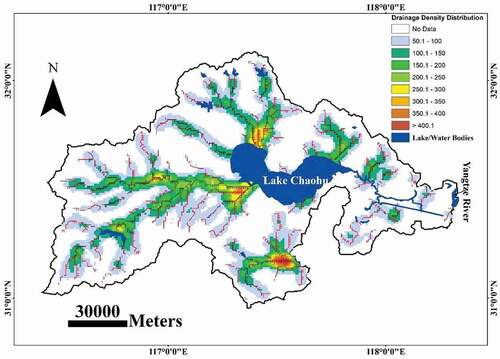
Table 3. Areal and relief morphometric parameters for Chaohu Basin.
3.3 Areal and relief morphometric parameters of the Chaohu basin
The areal and relief characteristics of a drainage network indicate the morphometric features such as structural setting, the elevation differences, geology, lithology, and erosional condition of the basin. Some of the main factors that influence the areal morphometric parameters of the drainage basins are basin length or perimeter, drainage area density, size, etc. which are all indications of bedrock geomorphology, runoff of dynamics or vegetation distribution. The relief morphometric parameters represented by the differences in slope aspects of the Chaohu Lake basin are presented in while presents the areal morphometric parameters derived from the analyzed DEM.
In geomorphic investigations, slope analysis is very important in the understanding of the speed of flow of runoff, the influence of sub-surface beds, the alteration of the basin and the climatomorphogenic processes in areas having different forms of rock resistance (Yeh et al., Citation2006 ; Gayen et al., Citation2013; Rai et al., Citation2017). shows the slope value of Chaohu Lake Basin which indicates the moderate to high slope angles around the lake while the Lake occupies the low angle position. This suggests high runoff from around the basin towards the Lake and a possibility of minimal infiltration.
Figure 5. Slope aspect (in degrees) of Chaohu basin.
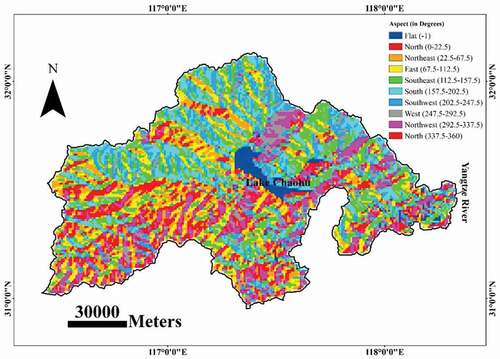
The aspect of a basin slope is also very important in the understanding of the topography of a basin area. Aspects indicate the compass direction to which the topography faces (Magesh et al., Citation2013) and it is very important in the determination of vegetation type, precipitation systems, and wind pattern (Rai et al., Citation2017). The aspect of the Chaohu basin, as calculated from SRTM DEM data, is shown in . It is seen here that different patterns of topography direction is observed in the basin with North and Northwest as well as South and Southeast facing slopes mainly occur in the basin, respectively. Southeast facing slopes mainly occur in the North-east of the basin while the north-west facing slopes occur in the southern part of the basin. The maximum part of the basin shows northeast facing. This pattern implies that these slopes have the potential for higher moisture content and lower evaporation rate than if the basin’s slope is principally west facing. This might have been responsible for the pattern of vegetation distribution, and agricultural development of the basin which is concentrated in the Northwestern and southern parts of the basin (See Section 3.5).
The other calculated values for the areal aspects of the Chaohu Lake basin are presented in . The total basin area (A) is 13,350 km, the perimeter (P) is ~ 790 km, and the drainage density (DD) is 670.85 km2.
One of the very important morphometric variables that are significant in the assessment of any morphological characteristics of any landform is the elevation (Gayen et al., Citation2013; Rai et al., Citation2017). In Chaohu Lake basin, the highest elevation is 1282 m while the lowest calculated value is at −7 m (Ref. to ). The low elevation of the basin indicates that most of the basin area is of flat to gentle slope type, and the far south-western part of the basin indicates a steep slope. The low relative position of the area suggests the suitability of the area for agricultural activities, especially around the Chaohu Lakesides because of the flat nature of the basin and its accessibility to water from the streams.
3.4 Focal statistics of the streams in Chaohu basin
The focal statistics tool in ArcGIS Spatial Analyst was used to perform a neighborhood circular radius function and operation that computes the output raster results where the value for each output cells are functions of the values of the input cells (streams) in the streams’ specified locations and neighborhood. The resultant image of the processes is presented in Figure 7, and these calculated values are based on the sum, mean, standard deviation, and range of the stream’s concentration in the basin. In terms of the sum of the concentration of the bulk of water in the streams, the highest in the basin are found in the streams or rivers that empty themselves into the Lake. Here, specifically, the streams/rivers with over 500 m3 of water concentration are found in the mouth of Nanfei, Hangbu, and Shiwuli rivers which are at the point of discharge to Chaohu Lake. As the source of many rivers and streams in the basin are at the upper course, these are the locations with the lowest concentrations of the volumes of water (> 200 m3), (Figure 7a). The middle course of the main rivers, however, indicate the mid-relatively concentration of water volumes.
Figure 6. Focal statistics for the streams/rivers in Chaohu Lake Basin: (a) Sum; (b) Mean; (c) Standard Deviation; and (d) Range.
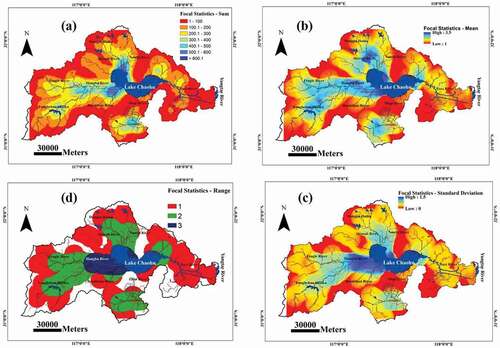
The focal statistics mean function was utilized to average out and classify the amount of stream concentration in the basin into the location of a high or low concentration neighborhood . The region of high concentration is found on the Shiwuli and Hangbu Rivers, respectively, especially at the neighborhood location where they both became the fourth-order streams/rivers. To understand the spread of streams within the basin further, the standard deviation function of the focal statistics was performed on the data, and the result indicates that the streams around and adjoining Hangbu main rivers are the most spread out in the basin . Again, where this form of streams spread, or concentration is observed is at where the stream becomes a fourth-order stream. The range function of the focal statistics neighborhood operation in ArcGIS Spatial Analyst was used to compute the indication of statistical dispersion of the streams in the basin. The amount of streams concentration or dispersion was ordered from lowest (1) to the highest (3). The streams are highly concentrated in the Hangbu river neighborhood, followed by Nanfei and Shiwuli rivers, respectively, . The location of the lowest concentrations is where there predominant first-order streams . Identifying the vulnerability of a basin to soil erosion and flooding are very essential basin management. The focal statistics presented here have shown the potential locations that are susceptible to soil erosion and flooding potential at the basin. So, with this reconnaissance analysis, there is the need to critically consider soil and water conservation practices to prevent the loss of materials in suspected areas, especially around Hangbu and Shiwuli river areas, to curtail any of such vulnerability.
3.5 Influence of the drainage on land use changes in the basin
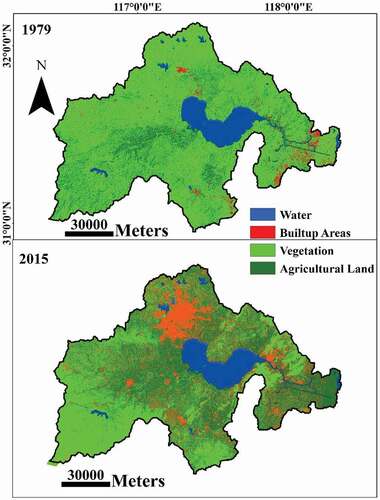
The detailed classified land-use dynamics in the Chaohu Lake basin from 1979 to 2015 have already been presented in Oyedotun (Citation2019). In this study, the analyses and understanding of the dynamics of the different streams in the basin have shown the easy accessibility to the abundant water systems in the basin, especially to the streams, the rivers, and the Lake itself. The resultant effect of this is that it has contributed to the changes in land uses between 1979 and 2015 (Figure 7). There has been an increase in the land being used for agricultural and urban use purposes within the last five decades at the basin, principally to cater for the growing population who have migrated to the area (Huang et al., Citation2013; Jiang et al., Citation2014; Zan et al., Citation2011). Built-up areas in the basin increased from about 3.5% of the total area in 1979 (area of 477.15 km2) to 25.1% (an area of ~ 3362.97 km2) in 2015 while land used for agricultural purposes, with a total coverage area of 29.8% (area of 3,974.58 km2) in 1979 to 45.2% (an area of ~ 6037.79 km2) in 2015 respectively . With the increase in the two land uses (Built-up/urban areas and the agricultural land uses) is the observed decrease in the uncultivated vegetated land areas. By 1979, the uncultivated forested areas of the basin occupied about 59.8% (7983.21 km2) which is starkly different to the 22.9% the areas covered in 2015 (at 3058.78 km2) (Oyedotun, Citation2019). The shrinking of vegetated land can be attributed to the conversion of the huge portions of the basin to agricultural, settlements, and other urban use purposes. These are land use activities that are driven by the rapid economic developments of the Hefei and Chaohu cities and the direct/indirect influence of the abundance of water resources to sustain the crop growing and increasing population (e.g., J-H. Wang et al., Citation2012; Oyedotun, Citation2019)
Figure 8. Classified map of land uses in Chaohu Lake Basin for 1979 and 2015 (after Oyedotun, Citation2019).
4. Conclusion
In this study, the quantitative assessment and analyses of the linear and area distributional patterns of the major morphometric parameters presented have provided a diverse picture of the dynamics of the streams’ attributes in the Chaohu Lake basin. This study has also shown that analysing remotely sensed data in a GIS environment is effective in evaluating drainage morphometric parameters and in exploring the relationship between the drainage morphometric, landform/basin properties and land uses. The network of streams in the Chaohu Lake basin is categorized as a fourth-order stream with a dendritic pattern as a dominant drainage pattern. Similarly, a rectangular and sub-rectangular pattern of drainage was also observed at the higher elevation of the basins. The differential pattern of drainage network observed could be linked to the possibility of structural and geomorphological features of the basin. The linear and areal patterns of the results of the streams observed in this study also indicated the impacts of geological, accommodation space, and/or structural controls in the morphological dynamics of the streams/river system in the basin. The analyses and understanding of the dynamics of the different streams in the basin have shown, here, the easy accessibility to the abundant water systems in the basin, especially to the streams, the rivers, and the Lake itself. This accessibility has contributed to changes in land-use patterns over the last five decades in the basin. Indeed, the drainage network characteristics here provide the clue to the understanding of hydrological behavior of the Chaohu Lake basin, and this is a big prerequisite for any watershed or basin management. The observation of drainage network behavior presented here also indicated that there is a variation (though not hugely significant) in the hydrological characteristics in the fourth-order Chaohu Lake basin. In conclusion, the present study has not only added to the existing body of knowledge on the Chaohu Lake basin, but it has also demonstrated the capability of using GIS techniques in evaluating and delineating the morphometric parameters and the flow characteristics of the basin. The impacts of a drainage basin on water quality parameters in the system and/or on geomorphic and/or tectonic activities are other areas of research that can be considered in the future.
Disclosure statement
No potential conflict of interest was reported by the author.
References
- Abdoud, I. A., & Nofal, R. A. (2017). Morphometric analysis of wadi Khumal basin, western coast of Saudi Arabia, using remote sensing and GIS techniques. Journal of African Earth Sciences, 126, 58–74. https://doi.org/https://doi.org/10.1016/j.jafrearsci.2016.11.024
- Akram, F., Rasul, M. G., Khan, M. M. K., & Amir, M. S. I. I. (2012). Automatic delineation of drainage networks and catchments using DEM data and GIS capabilities: A case study. 18th Australasian Fluid Mechanics Conference Launceston, Australia, 4 p
- Bahrami, S., Capolongo, D., & Mofrad, M. R. (2020). Morphometry of drainage basins and stream networks as an indicator of active fold growth (Gorm anticline, Fars Province, Iran). Geomorphology, 355, 107086. https://doi.org/https://doi.org/10.1016/j.geomorph.2020.107086
- Black, P. E. (1972). Hydrograph responses to geomorphic model watershed characteristics and precipitation variables. Journal of Hydrology, 17(4), 309–329. https://doi.org/https://doi.org/10.1016/0022-1694(72)90090-X
- Bryn, A., Dourojeanni, P., Hemsing, L. Ø., & O’Donnel, S. (2013). A high resolution GIS null modek of potential forest expansion following land use changes in Norway. Scandinavian Journal of Forest Research, 28(1), 81–98. https://doi.org/https://doi.org/10.1080/02827581.2012.689005
- Butt, A., Shabbir, R., Ahmad, S. S., & Aziz, N. (2015). Land use change mapping and analysis using remote sensing and GIS: A case study of Simly Watershed, Islamabad, Pakistan. The Egyptian Journal of Remote Sensing and Space Sciences, 18(2), 251–259. https://doi.org/https://doi.org/10.1016/j.ejrs.2015.07.003.
- Chen, X., Yang, X., Dong, X., & Liu, E. (2013). Environmental changes in chaohu lake (southeast china) since the mid 20th century. The interactive impacts of nutrients, hydrology and climate. Limnologica, 43(1), 10–17. https://doi.org/https://doi.org/10.1016/j.limno.2012.03.002
- Chorley, R. J., Donald, M. E. G., & Pogorselski, H. A. (1957). A new standard for estimating drainage basin shape. American Journal of Science, 255(2), 138–141. https://doi.org/https://doi.org/10.2475/ajs.255.2.138
- Chorley, R. J., Schumm, S., & Sugden, D. E. (1984). Geomorphology . Methuen and Co.
- Clarke, J. I. (1966). Morphometry from maps, Essays in Geomorphology. R Elsevier.
- Cox, R. T. (1994). Analysis of drainage basin asymmetry as a rapid technique to identify areas of possible Quaternary tilt-block tectonics: An example from the Mississippi embayment. Geological Society of American Bulletin, 106(5), 571–581. https://doi.org/https://doi.org/10.1130/0016-7606(1994)106<0571:AODBSA>2.3.CO;2
- Dubey, S. K., Sharma, D., & Mundetia, N. (2015). Morphometric analysis of the Banas River Basin using the geographical information system, Rajasthan, India. Hydrology, 3(5), 47–54. https://doi.org/https://doi.org/10.11648/j.hyd.20150305.11
- El Garouani, A., Mulla, D. J., El Garouani, S., & Knight, J. (2017). Analysis of urban growth and sprawl from remote sensing data: Case of Fez, Morocco. International Journal of Sustainable Built Environment, 6(1), 160–169. https://doi.org/https://doi.org/10.1016/j.ijsbe.2017.02.003
- Faghih, A., & Nourbakhsh, A. (2015). Appraisal of relative tectonic activity along the Kazerun Fault Zone, Zagros Mountains, Iran: insight from spatial analysis of geomorphic indices. Geological Journal. 50 (6): 783–798. https://doi.org/https://doi.org/10.1002/gj.2597
- Gardiner, V. (1990). Drainage basin morphometry. In A. S. Goudie (Ed.), Geomorphological Techniques (pp. 71–81). Unwin Hyman.
- Gayen, S., Bhunia, G. S., & Shi, P. K. (2013).Morphometric analysis of Kangshabati-Darkeshar interfluves area in West Bengal, India using ASTER DEM and GIS techniques. Geology & Geosciences, 2(4), 1–10. doi:https://doi.org/10.4172/2329-6755.1000133
- Ghadiry, M., Shalaby, A., & Koch, B. (2012). A new GIS-based model for automated extraction of Sand Dune encroachment case study: Dakhla Oases, Western Desert of Egypt. The Egyptian Journal of Remote Sensing and Space Sciences, 15(1), 53–65. https://doi.org/https://doi.org/10.1016/j.ejrs.2012.04.001
- Gregory, K. J. & Walling, D. E. (1968). The variation of drainage density within a catchment. Hydrology Science Journal Des Science Hydrology, 13(2), 61–68. https://doi.org/https://doi.org/10.1080/02626666809493583
- Hack, J. (1975). Studies of longitudinal stream profiles in Virginia and Maryland. US Geological Survey Professional Paper, 294–B.
- Harvey, C. A., & Eash, D. A. (1996). Description, instructions, and verification for Basin soft, a computer program to quantify drainage basin characteristics. US Geological Survey Water Resources Investigations Report, 25, 95–4287. https://doi.org/https://doi.org/10.3133/wri954287
- Horton, R. E. (1932). Drainage basin characteristics. American Geophysical Union Transactions, 13(1), 348–352. https://doi.org/https://doi.org/10.1029/TR013i001p00350
- Horton, R. E. (1945). Erosional development of streams and their drainage basins: Hydro-physical approach to quantitative morphology. Geological Society of American Bulletin, 56(3), 275–370. h ttps:// doi.o rg/ 10.11 30/ 0016- 7606(19 45)5 6[275:EDOSAT]2.0. CO;2
- Huang, J., Zhan, J., Yan, H., Wu, F., & Denga, W. (2013). Evaluation of the Impacts of Land Use on Water Quality: A Case Study in the Chaohu Lake Basin. The Scientific World Journal, 1–7. Article ID 329187. https://doi.org/https://doi.org/10.1155/2013/329187
- Islam, K., Jashimuddin, M., Nath, B., & Nath, T. K. (2018). Land use classification and change detection by using multi-temporal remotely sensed imagery: The case of Chunati wildlife sanctuary, Bangladesh.The Egyptian Journal of Remote Sensing and Space Science.2016 2016 21.12 1.005 doi:https://doi.org/10.1016/j.ejrs.2016.12.005
- Ji, B. (2009). Anhui Water Resources Yearbook. Yangtze River Press.
- Jiang, T., Hou, S., Xi, B., Su, J., Hou, H., Yu, H., & Li, X. (2014). The influences of land-use changes on the absorbed nitrogen and phosphorus loadings in the drainage basin of Lake Chaohu, China. Environmental Earth Sciences, 71(9), 4165–4176. https://doi.org/https://doi.org/10.1007/s12665-013-2807-z
- Kang, L., He, Q.-S., He, W., Kong, X.-Z., Liu, W.-X., Wu, W.-J., Li, Y.-L., Lan, X.-Y., & Xu, F.-L. (2016). Current status and historical variations of DDT-related contaminants in the sediments of Lake Chaohu in China and their influencing factors. Environmental Pollution, 219, 883–896. https://doi.org/https://doi.org/10.1016/j.envpol.2016.08.072
- Keller, E. A., & Pinter, N. (2002). Active Tectonics: Earthquakes, Uplift, and Landscape (Second Edition): Englewood Cliffs. Prentice Hall.
- Kelson, K. I., & Wells, S. G. (1989). Geologic influences on fluvial hydrology and bedload transport in small mountainous watersheds, northern New Mexico, USA, Earth Surface Processes and Landforms, 14(8): 671–690.(ISSN)1096-9837 https://doi.org/https://doi.org/10.1002/3290140803
- Kong, X. Z., Jørgensen, S. E., He, W., Qin, N., & Xu, F. L. (2013). Predicting the restoration effects by a structural dynamic approach in Lake Chaohu, China. Ecological Modelling, 266, 73–85. https://doi.org/https://doi.org/10.1016/j.ecolmodel.2013.07.001
- Li, Y., Zhou, G., Liang, T., Wu, L., & Liu, W. (2009). Study of land use change on the gains and losses of ecosystem service function values of Chaohu Lake Basin. Geographical Research, 28(6), 1656–1664.
- Liu, E. F., Shen, J., Yang, X. D., & Zhang, E. L. (2012). Spatial distribution and human contamination quantification of trace metals and phosphorus in the sediments of Chaohu Lake, a eutrophic shallow lake, China. Environmental Monitoring and Assessment, 184(4), 2105–2118. https://doi.org/https://doi.org/10.1007/s10661-011-2103-x
- Ludwig, W., & Probst, J. L. (1998). River sediment discharge to the oceans; present-day controls and global budgets. American Journal of Science, 298(4), 265–295. https://doi.org/https://doi.org/10.2475/ajs.298.4.265
- Magesh, N. S., Chandrasekar, N., & Soundranayagan, J. P. (2011). Morphometric evaluation of Papanasam and Manimuthar watersheds, parts of Western Ghats, Tirunelveli district, Tamil Nadu, India: A GIS approach. Environmental Earth Science, 642(2), 373–381. https://doi.org/https://doi.org/10.1007/s12665-010-0860-4
- Magesh, N. S., Jitheshal, K. V., Chandrasekar, N. & Jini, K. V. (2013). Geographical information system based morphometric analysis of Bharathapuzha River Basin, Kerla, India. Appl Water Sci:1–11. doi:https://doi.org/10.1007/s13201-013-0095-0
- Mahmood, S. A., & Gloaguen, R. (2012). Appraisal of active tectonics in Hindu Kush: Insights from DEM derived geomorphic indices and drainage analysis. Geoscience Frontiers, 3(4), 407–428. https://doi.org/https://doi.org/10.1016/j.gsf.2011.12.002
- Markose, V. I., Dinesh, A. C., & Jayappa, K. S. (2014). Quantitative analysis of morphometric parameters of Kali River basin, southern India, using bearing azimuth and drainage (bAd) calculator and GIS. Environmental Earth Science, 72(8), 2887–2903. https://doi.org/https://doi.org/10.1007/s12665-014-3193-x
- Merritts, D., & Vincent, K. R. (1989). Geomorphic response of coastal streams to low, intermediate, and high rates of uplift, Mendocino junction region, northern California. Geological Society of American Bulletin, 101(11), 1373–1388. https://doi.org/https://doi.org/10.1130/0016-7606(1989)101<1373:GROCST>2.3.CO;2
- Mesa, L. M. (2006). Morphometric analysis of a subtropical Andean basin (Tucuman, Argentiana). Journal Environmental Geology, 50(8), 1235–1242. https://doi.org/https://doi.org/10.1007/s00254-006-0297-y
- Miller, V. C. (1953). A quantitative geomorphic study of drainage basin characteristics in the Clinch Mountain area Virginia and Tennessee (pp. 189–200). Department of geology, columbia university (onr project tech – report NT 389–042, No. 3).
- Moglen, G. E., Eltahi, E. A., & Bras, R. L. (1998). On the sensitivity of drainage density to climate change. Water Resource Research, 34(4), 855–862. https://doi.org/https://doi.org/10.1029/97WR02709
- Montgomery, D. R., & Dietrich, W. E. (1989). Source areas, drainage density, and channel initiation. Water Resources Research, 25(8), 1907–1918. https://doi.org/https://doi.org/10.1029/WR025i008p01907
- MR, M. R., C, B., & Achyuthan, H. (2019). Quantitative analysis of the drainage and morphometric characteristics of the Palar River basin, Southern Peninsular India; using bAd calculator (bearing azimuth and drainage) and GIS. Geology, Ecology, and Landscapes. 3(4): 295–307. https://doi.org/10.1080 1080 3/24749508.2019 doi:https://doi.org/10.1080/24749508.2018.1563750
- Oguchi, T. (1997). Drainage density and relative relief in humid steep mountains with frequent slope failure. Earth Surface Process Ad Landforms, 22(2), 107–120. https://doi.org/https://doi.org/10.1002/(SICI)1096-9837(199702)22:2<107::AID-ESP680>3.0.CO;2-U
- Oyedotun, T. D. T. (2019). Land use change and classification in Chaohu Lake catchment from multi-temporal remotely sensed images. Geology, Ecology, and Landscapes, 3(1), 37–45. https://doi.org/https://doi.org/10.1080/24749508.2018.1481657.
- Ozdemir, H., & Bird, D. (2009). Evaluation of morphometric parameters of drainage networks derived from topographic maps and DEM in point of floods. Environmental Geology, 56(7), 1405–1415. https://doi.org/https://doi.org/10.1007/s00254-008-1235-y
- Patton, P. C., & Baker, V. R. (1976). Morphometry and floods in small drainage basins subject to diverse hydrogeomorphic contros. Water Resources Research, 12(5), 941–952. https://doi.org/https://doi.org/10.1029/WR012i005p00941
- Pedrera, A., Pérez-Peña, J.V., Galindo-Zaldívar, J., Azañόn, J.M., Azor, A. (2009). Testing the sensitivity of geomorphic indices in areas of low-rate active folding (eastern Betic Cordillera, Spain). Geomorphology 105, 218–231
- Pérez-Peña, J. V., Azor, A., Azañon, J. M., & Keller, E. A. (2010). Active tectonics in the sierra Nevada (Betic cordillera, SE Spain): Insights from geomorphic indexes and drainage pattern analysis. Geomorphology, 119(1–2), 74–87. https://doi.org/https://doi.org/10.1016/j.geomorph.2010.02.020
- Pophrae, A. M., & Balpande, U. S. (2014). Morphometric analysis of Suketi River basin, Himachal Himalaya, India. Journal of Earth System Science, 123(7), 1501–1515. https://doi.org/https://doi.org/10.1007/s12040-014-0487-z
- Poyraz, M., Taşkin, S., & Keleş, K. (2011). Morphometric approach to geomorphologic characteristics of Zeytinli Stream basin. The 2nd International Geography Symposium – GEOMED2010. Procedia Social and Behavioural Sciences, 19, 322–330. https://doi.org/https://doi.org/10.1016/j.sbspro.2011.05.138
- Rahimzadesh, B., Bahrami, S., Mohajjel, M., Mahmoudi, H., & Haj-Azizi, F. (2019). Active strikes slip faulting in the Zagros Mountains: Geological and geomorphological evidence of the pull-apart Zaribar Lake basin, Zagros, NW Iran. Journal of Asian Earth Sciences, 174, 332–345. https://doi.org/https://doi.org/10.1016/j.jseaes.2018.12.017
- Rai, P. K., Mohan, K., Mishra, S., Ahmad., A., & Mishra, V. N. (2017). A GIS-based approach in drainage morphometric analysis of Kanhar River Basin, India. Applied Water Science, 7(1), 217–232. https://doi.org/https://doi.org/10.1007/s13201-014-0238-y
- Rajasekhar, M., Raju, G. S., & Raju, R. S. (2020). Morphometric analysis of the Jilledubanderu River Basin, Anantapur District, Andhra Pradesh, India, using geospatial technologies. Groundwater for Sustainable Development, 11, 100434. https://doi.org/https://doi.org/10.1016/j.gsd.2020.100434
- Romshoo, S. A., Bhatand, S. A., & Rashid, I. (2012). Geoinformatics for assessing the morphometric control of hydrological response at watershed scale in the Upper Indus Basin. Journal of Earth System Science, 121(3), 659–686. https://doi.org/https://doi.org/10.1007/s12040-012-0192-8
- Saha, A., Tomar, S., Rana, A., & Singh, P. (2017). Morphometric and hydrological analysis of Krishni River watershed, Utar Pradesh, India: Using Remote Sensing and GIS Techniques. 18th ESRI India User Conference.
- Salem, S. A., Kalyankar, N. V., & Khamitkar, S. D. (2010). Linear and non-linear contrast enhancement image: IJCSNS. International Journal of Computer Science and Network Security, 10(2), 139–143.
- Sarmah, K., Jha, L. K., & Tiwari, B. K. (2012). Morphometric analysis of a highland microwatershed in East Khasi Hills Districts of Meghalaya, India: Using remote sensing and geographic information systems (GIS) techniques. Journal Geography Region Plant, 5(5), 142–150. https://doi.org/https://doi.org/10.5897/JGRP11.120.
- Schumm, S. A. (1956). Evolution of drainage systems and slopes in badlands at Perth Amboy, New Jersey. Geological Society of America Bulletin, 67(5), 597–646. h ttps:// doi.o rg/ 10.11 30/00 16-760 6(195 6)67[5 97:EODSAS]2.0. CO;2
- Seta, D. M., Monte, D. M., & Pascoli, A. (2005). Quantitative geomorphic analysis to evaluate flood hazards. Geografia Fisicae Dinamica Quaternaria, 28, 117–124.
- Shang, G., & Shang, J. (2005). Causes and control countermeasures of euthrophication in Chaohu Lake, China. Chinese Geographical Science, 15(4), 348–354. (in Chinese). https://doi.org/https://doi.org/10.1007/s11769-005-0024-8
- Shau, N., Reddy, O., Kumar, N., Nagaratu, M., Srivastava, R., & Singh, K. S. (2016). Morphometric analysis in basaltic terrain of central India using GIS techniques: A case study. Applied Water Science, 7(5), 2493–2499. https://doi.org/https://doi.org/10.1007/s13201-016-0442-z
- Singh, P., Gupta, A., & Singh, M. (2014). Hydrological inferences from watershed analysis for water resource management using remote sensing and GIS techniques. Egypt Journal of Remote Sensing and Space Science, 17(2), 111–121. https://doi.org/https://doi.org/10.1016/j.ejrs.2014.09.003
- Singh, S., & Dubey, A. (1994). Geo-environmental planning of watersheds in India. Clough Publications.
- Smart, S., & Surkan, A. J. (1967). The relation between main stream length and area in drainage basins. Water Resources Research, 3(4), 963–973. https://doi.org/https://doi.org/10.1029/WR003i004p00963
- Sreedevi, P. D., Subrahmanyam, K., & Ahmed, S. (2005). Integrated approach for delineating potential zones to explore for groundwater in the Pageru River basn, Kuddapah District, Andhra Pradesh, India. Hydrogeology Journal, 13(3), 534–545. https://doi.org/https://doi.org/10.1007/s10040-004-0375-8
- Strahler, A. N. (1952). Hypsometric (area-altitude) analysis of erosional topography. Bulletin of Geological Society of America, 63(11), 1117–1142. h†ttps://†do†i.o†rg/10.11†30/001†6-760†6(19†52)6†3[111†7:HAAOET]2.0.†CO;2
- Strahler, A. N. (1964). Quantitative geomorphology of drainage basin and channel networks. In V. T. Chow (Ed.), Handbook of Applied Hydrology (pp. 4–76). McGraw Hill Book Co.
- Swarnkar, S., Sinha, R., & Tripathi, S. (2020). Morphometric diversity of supply-limited and transport-limited river systems in the Himalayan foreland. Geomorphology, 348, 106882. https://doi.org/https://doi.org/10.1016/j.geomorph.2019.106882
- Tang, J., Shi, T., Wu, X., Cao, H., Li, X., Hua, R., Tang, F., & Yue, Y. (2015). The occurrence and distribution of antibiotics in Lake Chaohu, China: Seasonal variation, potential source and risk assessment. Chemosphere, 122, 154–161. https://doi.org/https://doi.org/10.1016/j.chemosphere.2014.11.032
- Tang, W. Z., Shan, B. Q., Zhang, H., & Mao, Z. P. (2010). Heavy metal sources and associated risk in response to agricultural intensification in the estuarine sediments of Chaohu Lake valley, East China. Journal of Hazardous Materials, 176(1–3), 945–951. https://doi.org/https://doi.org/10.1016/j.jhazmat.2009.11.131
- Thomas, J., Joseph, S., Thrivikramji, K. P., Abe, G., & Kannan, N. (2012). Morphometrical analysis of two tropical mountain river basins of contrasting environmental settings, the southern Western Ghats, India. Environmental Earth Science, 66(8), 2353–2366. https://doi.org/https://doi.org/10.1007/s12665-011-1457-2
- Verstappen, H. (1983). The Applied geomorphology. In International Institute for Aerial Survey and Earth Science (ITC), Ensched.
- Verstraeten, G., & Poesen, J. (2001). Factors controlling sediment yield from small inten-sively cultivated catchments in a temperate humid climate. Geomorphology, 40(1–2), 123–144. https://doi.org/https://doi.org/10.1016/S0169-555X(01)00040-X
- Wang, J.-H., Zhang, K., & Liang, B. (2012). Tracing urban sewage pollution in Chaohu Lake (China) using linear alkylbenzenes (LABs) as a molecular marker. Science of the Total Environment, 414, 356–363. https://doi.org/https://doi.org/10.1016/j.scitotenv.2011.11.048
- Wang, X., Xi, B., Huo, S., Deng, L., Pan, H., Xia, X., Zhang, J., Ren, Y., & Liu, H. (2013). Polybrominated diphenyl ethers occurrence in major inflowing rivers of Lake Chaohu (China): Characteristics, potential sources and inputs to lake. Chemosphere, 93(8), 1624–1631. https://doi.org/https://doi.org/10.1016/j.chemosphere.2013.08.024
- Wei, C., Bao, S., Zhu, X., & Huang, X. (2008). Spatio-temporal variations of the bacterioplankton community composition in Chaohu Lake, China. Progress in Natural Science, 18(9), 1115–1122. https://doi.org/https://doi.org/10.1016/j.pnsc.2008.04.005
- Wen, S., Shan, B., & Zhang, H. (2012). Metals in sediment/pore water in Chaohu Lake: Distribution, trends and flux. Journal of Environmental Sciences, 24(12), 2041–2050. https://doi.org/https://doi.org/10.1016/S1001-0742(11)61065-6
- Wu, L., Wang, X., Zhou, K., Mo, D., Zhu, C., Gao, C., Zhang, G., Li, L., Liu, L., & Han, W. (2010). Transmutation of ancient settlements and environmental changes between 6000–2000 aBP in the Chaohu Lake Basin. East China. Journal of Geographical Sciences, 20(5), 687–700. https://doi.org/https://doi.org/10.1007/s11442-010-0804-7.
- Xue, K., Zhang, Y., Duan, H., & Ma, R. (2017). Variability of light absorption properties in optically complex inland waters of Lake Chaohu, China. Journal of Great Lakes Research, 43(1), 17–31. https://doi.org/https://doi.org/10.1016/j.jglr.2016.10.006
- Yang, H., & Shi, C. (2017). Basin form characteristics, causes and implications of the tenkongduis in the upper reaches of the Yellow River. Quaternary International, 453, 15–23. https://doi.org/https://doi.org/10.1016/j.quaint.2017.04.009
- Yang, L., Han, X., Sun, P., Yan, W., & Li, Y. (2011). Canonical correspondence analysis of algae community and its environmental factors in the Lake Chaohu, China. Journal of Agro-Environment Science, 30(5), 952–958.
- Yeh, P.J.F., Swenson, S.C., Famiglietti, J.S., Rodell,M. (2006). Remote sensing of groundwater storage changes in Illinois using the gravity recovery and climate experiment (GRACE). Water Resour. Res. 42, W12203. https://doi.org/http://dx.doi.org/10.1029/2006WR005374
- Yu, H. B., Xi, B. D., Jiang, J. Y., Heaphy, M. J., Wang, H. L., & Li, D. L. (2011). Environmental heterogeneity analysis, assessment of trophic state and source identification in Chaohu Lake, China. Environmental Science and Pollution Research, 18(8), 1333–1342. https://doi.org/https://doi.org/10.1007/s11356-011-0490-8
- Zan, F. Y., Huo, S. L., Xi, B. D., Li, Q. Q., Liao, H. Q., & Zhang, J. T. (2011). Phosphorus distribution in the sediments of a shallow eutrophic lake, Lake Chaohu, China. Environmental Earth Sciences, 62(8), 1643–1653. https://doi.org/https://doi.org/10.1007/s12665-010-0649-5
- Zwisler, W., Selje, N., & Simon, M. (2003). Seasonal patterns of the bacterioplankton community composition in a large mesotrophic lake. Aquatic Microbial Ecology, 31(3), 211–225. https://doi.org/https://doi.org/10.3354/ame031211