
 ?Mathematical formulae have been encoded as MathML and are displayed in this HTML version using MathJax in order to improve their display. Uncheck the box to turn MathJax off. This feature requires Javascript. Click on a formula to zoom.
ABSTRACT
The present study aims to analyse the dynamics of land use and land cover in the Melap Forest Reserve in West Cameroon on the basis of a diachronic analysis of Landsat 4 TM, Landsat 7 ETM+ and Landsat 8 OLI_TIRS images for the years 1988, 2000 and 2018 respectively. Satellite images were processed using ENVI and ArcGIS software. The results showed that The Melap Forest Reserve consists of five main classes of land use/land cover; namely, forest, savannah, bare soil, cropland and built-up area. The analysis showed an ongoing deforestation and degradation of the forest. The forest class has been steadily decreasing from 1345 ha in 1988 to 664 ha in 2018, corresponding to a total loss of 680.9 ha (around 49%) over the 30-year period. The decrease in forest has led to an increase in savannah (+ 315 ha from 1988 to 2018); cropland (+ 351 ha); as well as built-up (+ 9 ha) and bare soil (+ 6 ha). The local communities are the main actors of these changes, principally through agriculture, wood extraction and breeding. Then, the present study suggests participatory management, which includes local communities, for the restoration and the management of the study area.
Introduction and background of the study
The world’s forests cover an area of 4.06 billion hectares (ha), of which tropical forests account for 45% (FAO, Citation2020). Forest ecosystems provide several services such as climate regulation, provisioning of plant and animal resources, recreation and socio-cultural services (Carnol & Verheyen, Citation2010; Chevassus-au-louis & Pirad, Citation2011). Forests and their products play a critical role in the improvement of lives of the local communities. However, global demand for forest and food resources increase with population growth, leading to overexploitation and conversion of forest land to other uses (Temgoua, Citation2011). According to FAO (Citation2020), 10 million hectares per year of global forest cover have been lost since 2015 and Africa had the largest annual rate of net forest loss in 2010–2020, at 3.9 million ha. Anthropogenic activities are the main causes of forest lost (Harris et al., Citation2012; Malhi et al., Citation2014; Le Quéré et al., Citation2016).
In tropical regions, extensive conversion of forests and agricultural intensification are typically identified among the most proximate causes of deforestation (Geist & Lambin, Citation2002). Agricultural expansion with the degradation of natural vegetation cover, is the most dominant trajectory of land use and land cover change tropical regions. FAO (Citation2016) reports an increase in agricultural land of 6 million hectares per year in tropical countries. But other direct and indirect factors of this change are wood extraction, infrastructure extension, the development of the mining sector and other activities that change the physical attributes of the land cover (Gillet et al., Citation2016; Lambin et al., Citation2003; Momo Solefack et al., Citation2018; Temgoua et al., Citation2018a). In Congo basin, deforestation and forest degradation are concentrated around densely populated areas (Megevand, Citation2013). Changes in forest cover negatively affect the supplying of ecosystem services, such as climate regulation, biodiversity conservation, and carbon storage (Foley et al., Citation2005; Giam, Citation2017; Lucas et al., Citation2015; Pan et al., Citation2011). This land use change is one of the major causes of global climate change (IPCC, Citation2014).
The forests of the Congo basin constitute the second largest continuous forest massif after the Amazon. Despite their importance, these forests are also threatened by deforestation (Megevand, Citation2013). Between 2000 and 2005, annual net deforestation in the Congo Basin was estimated at 0.17% and annual net degradation at 0.09% over the same period (Ernst et al., Citation2013; De Wasseige et al., Citation2012). Recent studies show that even classified forests are facing many anthropogenic pressures that lead to their degradation and deforestation (Djiongo et al., Citation2020; Fokeng et al., Citation2020; Kyale et al., Citation2019; Temgoua et al., Citation2018a; Zekeng et al., Citation2019).
The Cameroonian forest, represents the second largest tropical forest of Congo basin (after those of the Democratic Republic of Congo), covers an area of 22.5 million hectares, which represents about 48% of the national territory (De Wasseige et al., Citation2009). In Cameroon, De Wasseige et al. (Citation2012) estimated the average annual rate of gross deforestation at 0.10% for the period 1990–2000 and 0.17% for the period 2000–2005. This shows that during these two periods, the rate of deforestation has increased. Between 1990 and 2010, FAO (Citation2011) estimated that Cameroon lost 4400 ha of forests. For the planning and sustainable management of the natural forest resources, detailed knowledge of land use and land cover, as well as the detection of changes, is considered as key parameter for the assessment of the environment and its evolution over time (Verburg et al., Citation2011; Usman et al., Citation2015). Thus, remote sensing emerges as a fundamental technology to assist in this spatial and temporal planning of land use types and vegetation cover evolution (Hansen et al., Citation2013; Loveland & Dwyer, Citation2012; Temgoua et al., Citation2018a; Tsayem, Citation2010).
In Cameroon, since colonial epoch, in response to forest degradation, several forest reserves and protected areas have been created in the interest of biodiversity conservation (Temgoua, Citation2011). With a view to land-use planning, a zoning plan for the southern part of Cameroon has been drawn up (Côte, Citation1993). This zoning plan divides the forest area and makes a fundamental distinction between permanent and non-permanent forests. Forest reserves are part of the permanent forest estate that is designated to remain forested over the long term. Thus, within this permanent forest estate, agriculture is prohibited and the use of forest resources is subject to restrictions. Today, however, in Cameroon, these forest reserves are undergoing significant degradation due to strong pressure on natural resources by human activities (agriculture, timber extraction, grazing, road and housing construction), causing land use change (Fokeng et al., Citation2020; Fokeng & Meli, Citation2015; Temgoua et al., Citation2010; Wafo et al., Citation2005).
Like most reserves, the Melap Forest Reserve (MFR) in West Cameroon is encroached by local populations for agriculture and wood extraction. This reserve is also the main source of firewood supply of the surrounding cities and gradually the activities carried out there have led to its degradation (Chako, Citation2016). Due to the failure of the management of forest reserves by the government in Cameroun, the state decided to entrust decentralized entities such as non governmental Organizations (NGOs). Thus, the MFR, which was created in 1947, was retroceded in 2015 to the National Forest Development Support Agency (ANAFOR). However, this transfer of management requires the elaboration of a management plan. On the same line, evaluating forest cover loss in forest reserves can provide a baseline for sustainable forest management and conservation. The MFR has a lack of studies on land cover change and factors of deforestation and forest degradation. In fact, no monitoring of vegetation dynamics has been carried out in the reserve since his creation. Therefore, this study which aims at assessing the evolution of land use and land cover in the reserve through a diachronic analysis of satellite images over three different periods (1988; 2000 and 2018). In addition, the activities and the perceptions of the surrounding populations on the changes that this reserve has undergone over the years have been assessed. This constitutes a basic element for the new orientations of strategies and policies for the management of forest reserves in general and the MFR reserve in particular.
Material and methods
Study site
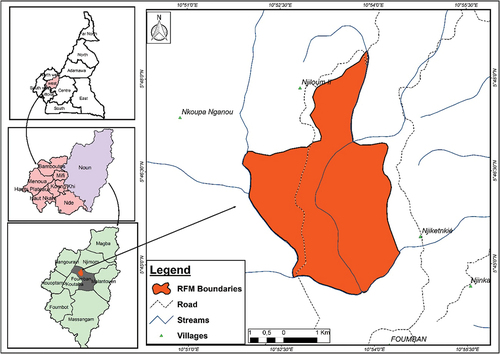
The Melap Forest Reserve is located in the Foumban Sub-division, Noun Division and West Cameroon region. It is located between latitudes 5° 44’ 30”-5° 48’ 30”N and longitudes 10° 52’ 0”- 10° 54’ 30”E (). The climate is tropical sudano-guinean type characterized by two seasons; one rainy season from mid-March to mid-November and one dry season from mid-November to mid-March. The average rainfall is 1907 mm/year and the average annual temperature is 21.4°C (Njoukam et al., Citation1996). The soils fall into two main categories: poorly evolved soils (low proportion of lithosols and alluvial soils), which are mainly found along the Nchi River; and ferralitic soils, which occupy most of the reserve (Faure, Citation1986). The natural vegetation is dominated by shrub savannah characterised by the presence of Terminalia glaucescens, Annona senegalensis and Daniellia oliveri. However, the MFR has been reforested with exotic species, Pinus (about 15 species) and Eucalyptus (about 30 species) by the forest services (Njoukam et al., Citation1996). The population living around the reserve is mainly composed of Bamoun tribe. This population mainly practices agriculture, handicraft and petty trade.
Figure 1. Localization of study site in the Western Region of Cameroon.
Data collection and analysis
Land use/land cover change
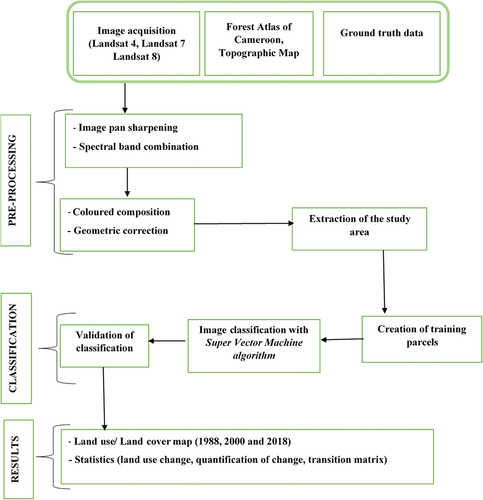
The study was based on the Landsat 4 TM, Landsat 7 ETM+ and Landsat 8 OLI_TIRS satellite images of the study site for the years 1988, 2000 and 2018, respectively. These images were downloaded via http://glovis.usgs.gov website of the United States Geological Survey-Global Visualization Viewer’s. In order to reduce cloud cover, images from the dry season period were selected. ENVI 5.2 and ArcGIS 10.5 software were used to perform image processing. These images have been pre-processed to facilitate classification. This consisted in combining the spectral bands to obtain a multispectral image, resampling of the pixels to overlay and combine the images (Mama et al., Citation2013), enhancing of images to improve its appearance and facilitate the visual interpretation and analysis of the scenes by playing on the dynamics of the radiometric values in the frequency histogram(Donnay, Citation2000), colour composition, geometric correction and extraction of the study area.
The Super Vector Machine (SVM) algorithm was used for the supervised classification of Landsat scenes. SVM works by considering each pixel as a two-dimensional system vector, where each class has a pixel as a support vector to establish the class boundary (Boser et al., Citation1992; Cortes & Vapnik, Citation1995). In fact, several authors have demonstrated that the SVM algorithm is more accurate than the Maximum Livelihood Classification (MLC) and Neural Network (NN) algorithms (Arun et al., Citation2012; Naguib et al., Citation2009).
Subsequently, the classification results were compared with GPS points collected in the field. Thus, in order to evaluate the accuracy of the classification, two classification validation indices were determined: the overall accuracy (proportion of well-classified pixels, calculated as a percentage) and the Kappa index (ratio of well-classified pixels to the total number of surveyed pixels). The finalization, perfection and cartographic layout of the land cover maps resulting from the processing of satellite images were carried out using ArcGIS 10.5 software. The different steps of satellite images and production of maps are shown in .
Figure 2. Flowchart showing the different stages of satellite images processing to obtain the land cover map.
Change detection consisted in highlighting the change in land cover, quantifying the land cover change and developing the transition matrix. The simultaneous image analyses of the three studied years (1988, 2000 and 2018), using the spatial analysis functions of the GIS (Spatial analyst extension of the ArcGIS software), made it possible to develop the Land use/Land cover change matrix.
The quantification of the annual change was based on the calculation of the annual rate of change (R) given by Peng et al. (Citation2008) formula below:
where R is the annual rate of land cover dynamic, measuring the change rate of the target land cover type; A1 and A2 are the area of the target land cover type at the beginning and end of the study period, respectively and T is the study period, which is usually measured in year.
Activities and perception of the degradation of the forest reserve by local populations
In order to assess the perception of the local populations on the state and the management modalities of the reserve, semi-structured interviews were conducted and mainly involved 42 household heads including village Chiefs. The interviews were conducted in five villages: Mfentame, Njiketnkiet, Njiloum, Njinka and Njintout. They were selected because of their proximity to the forest reserve. The household heads were interviewed on their activities carried out in the reserve and the current state of the reserve, in order to get their perception of the changes that have taken place over time. These changes refer to the evolution of land use patterns. The interviews were supplemented by participatory observations. The difference in perceptions between respondents was tested using the kruskal-wallis ANOVA test with the STATISTICA 12 software. In case of significant differences between the tested variables, the Mann–Whitney U Test was used to separate the means.
Results
Image classification accuracies
The computed error matrices for the classified images revealed an overall accuracy of more than 80% for the three classification dates (). The classification of LULC using the Landsat 8 OLI for the year 2018 showed the highest classification accuracy (90%) and kappa index (0.83) compared to the Landsat 4 TM images used for the years 1988 which gave the lowest values (85% for accuracy and 0.80 for kappa index).
Table 1. Values of overall accuracies and Kappa index.
Land use/land cover dynamics from 1988 to 2018
In 1988, the land cover mapping identified four classes: bare soil, built up area, savannah and forest. These different land cover classes have evolved in size over the years, either by gaining or by losing surface area to give way to other land cover such as croplands that appeared only in 2000 and 2018 (). Out of the four classes of land cover of 1988 (), the forest occupied 1345.2 ha, corresponding to 77.31% of the total surface area of the reserve, followed by savannah with 246.21 ha (14.15%), bare soils with 145.39 ha (8.36%), and traces of human activities (mainly built up areas) with 3.2 ha (0,18%) (). Cropland areas were absent ( and ).
Figure 3. Land use/land cover dynamics of Melap Forest Reserve from 1988 to 2018.
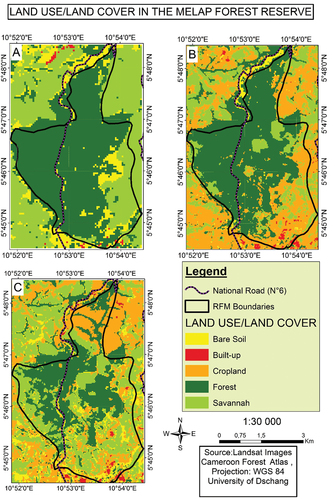
Table 2. Change in land use /land cover from 1988 to 2018 in Melap Forest Reserve.
Changes in land cover became noticeable from the year 2000 (). The forest gradually decreased from 1345.20 ha in 1988 to 1103.77 ha in 2000 to reach 664.29 ha in 2018. Between 1988 and 2000, the forest cover decreased from 77.31% to 63.44% (corresponding to an annual change of −1.50%). Similarly, and during the same period, the bare soil decreased from 8.36% to 1.10% (annual change of −7.23%) while the built up area showed an exponential increase with an annual change of 20.81%. Cropland which did not exist in 1988, gained 372.23 ha corresponding to 21.39% of the total surface area of the reserve in 2000; then, a slight regression was observed in 2018 with an annual change of −0.32%. Between 2000 and 2018, the forest lost 11% of its surface, corresponding to an annual change of −2.21%. This forest lost occurred simultaneously with an increase of bare soils and savannah which presented the annual changes of 38.12% and 7.79% respectively.
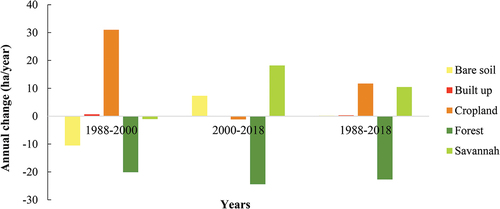
The annual rate of change was negative in all periods for forest cover (). Built up showed a continuous positive dynamic which was much more marked between 1988 and 2018 (). Considering the whole period 1988–2018, the forest was the only land use class whose surface area regressed: 22.7 ha/year corresponding to a total loss of 680.9 ha over the 30-year period
Figure 4. Annual rate of land use/land cover change in Melap Forest Reserve between 1988 and 2018.
The transition matrices () highlight the different forms of conversion that land use classes have undergone between 1988 and 2018.
Table 3. Land use/Land cover change matrix in Melap Forest Reserve from 1988 to 2018.
The transition matrix for the period 1988–2000 shows that 3.82 ha (0.22%) of estimated 8.36% (145.39 ha) bare soil remained intact and 8.13% underwent conversion to other forms of land use. Similarly, 1.76 ha (0.10%) of built up area remained unchanged and 0.8% (1.44 ha) underwent conversion to other forms of land use. Cropland is the new form of land use (21.38%) and was created during this period as a result of the conversion of the other categories. The forest was subject to degradation of 17.53%, since out of the 77.31% of the area occupied by this category in 1988, only 59.78% remained unchanged in 2000. 8.26% was converted into cropland, 8.29% into savannah, 0.13% into built up area and 0.85% into bare soil. As for the savannah zone, 4.22% remained intact and 9.48% were converted into cropland, 0.3% into forest, 0.13% into built up area and 0.03% into bare soil.
Between 2000 and 2018, 0.21% of bare soil remained in this category and 0.89% was converted to other forms of land use. 0.33% of built up area remained unchanged and 0.31% was converted to other categories. Cropland area underwent a change of 12.68% to other forms of land use. With regard to the forest, of the 63.44% in 2000, 26.5% was converted to other forms of land use and mainly to savannah (14.48%). 10.21% of the savannah zone remained unchanged against 3.22% that were converted into other forms of land use.
Local perception of degradation of Melap Forest Reserve
An analysis of respondents’ perceptions about changes in the MFR reveals that for only 7.14% of respondents, the reserve has changed over the years compared to 78.58% who did not perceive any change. Besides, 14.29% of respondents have no opinion on changes in the reserve. Statistical analysis shows that there is a significant difference in the mean of respondents’ perceptions about changes in the MFR (p = 0.0069). The proportion of respondents who say that the MFR has remained intact is higher than those who say they have no idea (p = 0.012) on one hand; and also higher than those who say there have been changes (p = 0.010) on the other hand.
The explanation of those who don’t perceive the change is that, the MFR continues to provide goods and services as before. The changes observed and evoked by a low proportion of respondents is the reduction of the forest cover due to the earthworks carried out for the asphalting of the national road number 6 (Foumban-Manki section), which crosses the MRF for 5 km. In addition, other reasons were raised to justify change cover, there were the cut down of trees for firewood and the increase in agricultural areas inside the reserve.
Activities practiced within the Melap Forest Reserve
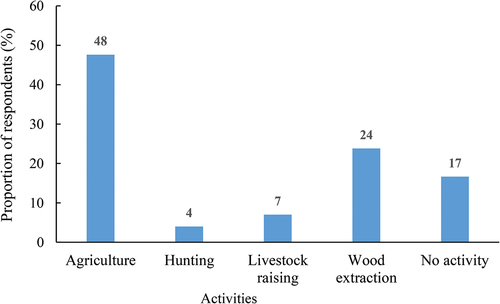
Respondents reported the main activities practiced in the forest reserve. As shown in , agriculture is the most common activity, cited by 48% of respondents, followed by wood extraction (24%), livestock raising (7%), and hunting (5%). 17% of respondents stated that they do not carry out activities in the reserve.
Figure 5. Activities carried out in the Melap Forest Reserve by local communities.
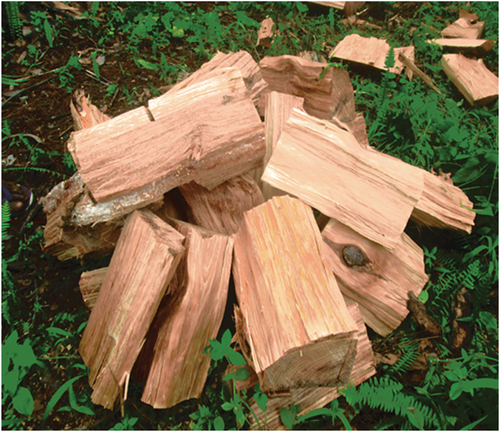
Forest cover in the reserve has been degraded largely due to agricultural activities. In 2018, 351.11 ha or 20.18% of the area was under cultivation. The main crops were maize (Zea mays), groundnuts (Arachis hypogaea), potato (Ipomoea batatas) and cassava (Manihot esculenta). The extraction of wood is the second most important activity practiced within the forest reserve (Plate 1). Concerning livestock raising, the nomadic herders in search of pasture, graze their animals in the reserve. They are also responsible for bush fires which they use to renew the pasture.
Plate 1. Logged pine for cambium extraction.
Discussion
Error matrices calculated for the classified images showed a general confusion of less than 15% with the accuracy and degree of representation of ground truths (Kappa index) varying from 0.80% to 0.83%. The classifications performed are reliable if we refer to the scale of Landis and Koch (Citation1977). Results on land cover change analysis show an ongoing deforestation process within the Melap Forest Reserve. From 1988 to 2018, the forest class lost 680.9 ha corresponding to 50.62% of its original surface area. Analysis of deforestation rates for the considered time periods 1988–2000 and 2000–2018 reveals deforestation rates of 1.5% per year and 2.21% per year respectively. This high rate of deforestation, mostly observed for the second period, shows that the forest reserve is under increasing pressure over time. The rate of deforestation observed in our study area is higher than those reported on one hand, by De Wasseige et al. in 2012 (0.10%) for the period of 1990–2000 in Cameroon, and on the other hand, by Ernst et al in 2013 (0.26%) for the Congo basin during the 2000–2005 period.
While forests decreased, other land use classes increased in the study area. Cropland and savannah are the classes with the highest increases: 11.7 ha/year and 10.5 ha/year, respectively. This trend of decreasing forest cover in favour of other land use types was observed by many authors in other protected areas in Cameroon; some of these authors are Wafo et al. (Citation2005) in Laf-Madjam forest reserve; Fokeng and Meli (Citation2015) in Santchou wildlife reserve; Temgoua et al. (Citation2018b) in the teaching and research forest of Dschang’s University; Djiongo et al. (Citation2020) in Bouba Ndjidda national park and Fokeng et al. (Citation2020) in Metchie-Ngoum forest reserve. However, this is not specific to Cameroon, as similar observations have also been made in the classified forest of Tiogo in Burkina Faso by Tankoano et al. (Citation2016); in the Manda national park in Chad by Benoudjita and Djinet Ignassou (Citation2017); in the Djoli-Kera classified forest in Chad by Temgoua et al. (Citation2018b); in the Yangambi Biosphere Reserve in the Democratic Republic of Congo by Kyale et al. (Citation2019) and in Katimok Forest Reserve in Kenya by Jebiwott et al. (Citation2020).
Increasing anthropisation is the cause of the changes in land cover and land use that have occurred in the Melap Forest Reserve over the last 30 years. We can note that in 1988, there were no croplands in the reserve. However, this class is present in the 2000 and 2018 images. The practice of agriculture in the reserve can be explained by the relaxation of controls in the early 1990s, which facilitated its encroachment by local people. This situation was also exacerbated by the economic crisis and the decline in civil servants’ salaries in the 1990s. In Cameroon, with population growth and in the absence of a real strategy to control and secure reserves and wooded areas, the phenomenon of illegal occupation has developed throughout the decades. Despite the fact that access to the forest reserve is prohibited, local people carry out several activities there, including agriculture but also wood extraction. This situation was also reported by Fokeng and Meli (Citation2015) in the Santchou forest reserve, Temgoua et al. (Citation2010) in the Mbalmayo forest reserve and Fokeng et al. (Citation2020) in Metchie-Ngoum forest reserve. Indeed most forest reserves of Cameroon are being transformed by rising population growth from within and without alongside settlement related activities like firewood harvesting, logging, farming and grazing (Fokeng et al., Citation2020). In fact in the Congo basin in general, deforestation is linked to increasing slash-and-burn agricultural activities, artisanal timber logging, firewood collection and charcoal production (Declée et al., Citation2014; Megevand, Citation2013). Kissinger et al. (Citation2012) showed that agriculture is the main cause of deforestation in tropical areas, contributing to 35% of forest destruction in Africa.
In MFR, the extraction of wood is the second most important activity practiced within the forest reserve. The wood is intended for personal household use but also for sale. This sale is facilitated by the national road number 6 which crosses the reserve in its western part, but also by the proximity of Foumban city. Villages surrounding the classified forest largely depend on firewood as their main source of energy. Eucalyptus and Pine trees are the most exploited species. These species are used for firewood, but also for the construction of houses (poles and slats). Pine is also used to make indoor furniture and panelling. In recent years, logging of pine tree for cambium extraction has intensified in the reserve, creating a little more damage to the forest vegetation. The rehabilitation of the national road number 6 which passes inside the reserve would have also had an impact on the degradation of the vegetation cover. According to Gillet et al. (Citation2016), the development of road networks is most often accompanied by negative impacts on forest cover.
An analysis of respondents’ perceptions of changes in the MFR reveals that 78.58% don’t perceive the degradation. This can be explained by the fact that, local populations don’t yet feel any concrete impact in their activities of agriculture and wood extraction that they carry out in the reserve. This may also reflect an implicit refusal by local people to acknowledge that their illegal activities have a negative impact on the forest reserve.
Since 2015, the management of the reserve has been transferred to ANAFOR with the objective of restoring degraded forest cover. However, surveys show that only 59.52% of people are aware of this management entity. This reflects the lack of awareness, but also the fact that these restoration actions are not yet perceptible on the field and does not yet have an impact on forest cover, as the project only started in 2017. In the next few years, this project, if well carried out, could help restore the forest cover. As an example, Gbedahi et al. (Citation2019) reports on the reconstitution of vegetation cover in the commune of Bassila in northern Benin through the implementation of a forest resource restoration project.
Since its creation, the management methods of the Melap Forest Reserve were based on repression characterized by strict control and exclusion of local communities that were not involved in the management (Njoukam et al., Citation1996). This management approach focussed on the central administration has shown its limits and local communities continue to invade the reserve as the State no longer has the means to ensure control. It would be unrealistic today to envisage sustainable management of the MFR without taking into account the presence and interests of the various stakeholders involved in the forest, including local communities. It is essential to involve them in the planning and the management processes of the reserve as they can play an important role in land use/land cover change. Then, we strongly recommend that local communities of the MFR should be associated in the restoration project, and encouraged to set up individual or community afforestation of the reserve.
Conclusion
Land cover and land use dynamics between 1988 and 2018 in the Melap Forest Reserve is characterized by a significant and continuous regression of the forest area in favour of other types of land use, particularly cropland and savannah. The change is mainly due to the weakening of state control of the reserve, which has led to its anarchic invasion by local communities. Agriculture and wood extraction are the main activities at the base of this change. Livestock raising, leading to bush fires, is also carried out in the reserve. Since local communities are the main actors in the degradation of the reserve, it is important that they should be involved in the management and restoration through participatory management.
Acknowledgments
We wish to thank the populations of surveyed villages for their collaboration.
Disclosure statement
No potential conflict of interest was reported by the author(s).
References
- Arun, M., Sananda, K., Surendra, K. C., Rituraj, S., & Mishra, P. K. (2012). Comparison of support vector machine and maximum likelihood classification technique using satellite Imagery. International Journal of Remote Sensing and GIS, 1(2), 116–123.
- Benoudjita, N., & Djinet Ignassou, A. (2017). Comment les aires protégées structurent les écosystèmes des périphéries. International Journal of Biological Chemical Sciences, 11(5), 2225–2242. https://doi.org/10.4314/ijbcs.v11i5.22
- Boser, B. E., Guyon, I., & Vapnik, V. (1992). A training algorithm for optimal margin classiers. In Proceedings of the Fifth Annual Workshop on Computational Learning Theory, 144–152. Pittsburgh: ACM Press.
- Carnol, M., & Verheyen, K. (2010). Les services écosystémiques dans les forêts mélangées et pures. Forêt Wallonne, 106, :49–59.
- Chako, S. M. (2016). Evaluation des opportunités de restauration des paysages forestiers : Cas de la Réserve Forestière de Melap à Foumban. Mémoire d’Ingénieur des Eaux, Forêts et Chasses, FASA.
- Chevassus-au-louis, B., & Pirad, R. (2011). Les services écosystémiques des forêts et leur rémunération éventuelle (Vol. LXIII). Revue Forestière Française.
- Côte, S. (1993). Plan de zonage du Cameroun forestier méridional : Objectifs, méthodologie, plan de zonage préliminaire. MINEF-ACDI-PTI.
- Cortes, C., & Vapnik, V. (1995). Support-vector networks. Machine Learning, 20(3), 273–297. https://doi.org/10.1007/BF00994018
- De Wasseige, C., Devers, D., Marcken, P., Eba’a Atyi, R., Nasi, R., & Mayaux, P. (2009). Les forêts du Bassin du Congo – État des forêts 2008. Office des publications de l’Union Européenne.
- De Wasseige, C., Marcken, P., Bayol, N., Hiol Hiol, F., Mayaux, P., Desclée, B., Nasi, R., Billand, A., Defourny, P., & Eba’a Atyi, R. (2012). Les forêts du Bassin du Congo – État des forêts 2010. Office des publications de l’Union européenne.
- Declée, B., Mayaux, P., Hansen, M., Amani, P. L., Sannier, C., Mertens, B., Hӓusler, T., & Lubamba, J.-P. K. (2014). Evolution of forest cover at a national and regional scale and drivers of change. In C. De Wasseige, J. Flynn, D. Louppe, F. Hiol Hiol, & P. Mayaux (Eds.), Forest of the Congo Basin - State of the Forest 2013 (pp. 21–46). Weyrich, Belgium.
- Djiongo, J. E. B., Desrochers, A., Avana, M. L. T., Khasa, D., Zapfack, L., & Fotsing, E. (2020). Analysis of spatio-temporal dynamics of land use in the Bouba Ndjidda National Park and its adjacent zone (North Cameroun). Open Journal of Forestry, 10(1), 39–57. https://doi.org/10.4236/ojf.2020.101004
- Donnay, J. P. (2000). Les spartiocartes en composition colorée. Bulletin de la Société Géographique de Liège, 38(1), 43–61. https://popups.uliege.be/0770-7576/index.php?id=2506&file=1
- Ernst, C., Mayaux, P., Verhegghen, A., Bodart, C., Christophe, M., & Defourny, P. (2013). National forest cover change in Congo Basin: Deforestation, reforestation, degradation and regeneration for the years 1990, 2000 and 2005. Global Change Biology, 19(4), 1173–1189. https://doi.org/10.1111/gcb.12092
- FAO. (2011). La situation des forêts dans le bassin amazonien, le bassin du Congo et l’Asie du Sud-Est. Rapport préparé pour le Sommet des trois bassins forestiers tropicaux Brazzaville. 31 mai-3 juin, 2011.
- FAO. (2016). Global forest resource assessment 2015. How are the world’s forests changing? (Second ed.). Food and Agricultural Organization of the United Nations.
- FAO. (2020). Global forest resources assessment 2020. Key findings. Food and Agriculture Organization of United Nation. http://www.fao.org/3/CA8753EN/CA8753EN.pdf
- Faure, J. J. (1986). Réserve forestière de Melap. Plan d’aménagement (1987-1996).MINAGRI/MESIRES.
- Fokeng, M. R., Forje, W. G., Meli, M. V., & Bodzemo, B. N. (2020). Multi-temporal forest cover change detection in the Metchie-Ngoum protection forest reserve, West Region of Cameroon. The Egyptian Journal of Remote Sensing and Space Sciences, 23(1), 113–124. https://doi.org/10.1016/j.ejrs.2018.12.002
- Fokeng, M. R., & Meli, M. V. (2015). Modelling drivers of forest cover change in the Santchou Wildlife Reserve, West Cameroon using remote sensing and land use dynamic degree indexes. Canadian Journal of Tropical Geography, 2(2), 29–42.
- Foley, J. A., De Fries, R., Asner, G. P., Barford, C., Bonan, G., Carpenter, S. R., Stuart, C., & Snyder, P. K. (2005). Global consequences of land use. Science, 309(5734), 570–574. https://doi.org/10.1126/science.1111772
- Gbedahi, O. L. C., Biaou, S. S. H., Mama, A., Gouwakinnou, G. N., & Yorou, N. S. (2019). Dynamique du couvert végétal à Bassila au nord Bénin pendant et après la mise en œuvre d’un projet d’aménagement forestier. International Journal of Biological and Chemical Sciences, 13(1), 311–324. https://doi.org/10.4314/ijbcs.v13i1.25
- Geist, H. J., & Lambin, E. F. (2002). Proximate causes and underlying driving forces of tropical deforestation. BioScience, 52(2), 143–150. https://doi.org/10.1641/0006-3568(2002)052[0143:PCAUDF]2.0.CO;2
- Giam, X. (2017). Global biodiversity loss from tropical deforestation. Proceedings of the National Academy of Sciences USA, 114(23), 5775–5777. https://doi.org/10.1073/pnas.1706264114
- Gillet, P., Vermeulen, C., Feintrenie, L., Dessard, H., & Garcia, C. (2016). What are the causes of deforestation in the Congo Basin? Literature review and case studies. Biotechnologie Agronomie Société Environnement, 20(2), 183–194. https://popups.uliege.be/1780-4507/index.php?id=13022
- Hansen, M. C., Potapov, P. V., Moore, R., Hancher, M., Turubanova, S. A., Tyukavina, A., Thau, D., Stehman, S. V., Goetz, S. J., Loveland, T. R., Kommareddy, A., Egorov, A., Chini, L., Justice, C. O., & Townshend, J. R. G. (2013). High-resolution global maps of 21st-century forest cover change. Science, 342(6160), 850–853. https://doi.org/10.1126/science.1244693
- Harris, N. L., Brown, S., Hagen, S. C., Saatchi, S. S., Petrova, S., Salas, W., Hansen, M. C., Potapov, P. V., & Lotsch, A. (2012). Baseline map of carbon emissions from deforestation in tropical regions. Science, 336(6088), 1573–1576. https://doi.org/10.1126/science.1217962
- IPCC. (2014). Summary for policymakers. In C. B. Field, V. R. Barros, D. J. Dokken, K. J. Mach, M. D. Mastrandrea, T. E. Bilir, M. Chatterjee, K. L. Ebi, Y. O. Estrada, & R. C. Genova (Eds.), Climate change 2014: Impacts, adaptation, and vulnerability (pp. 1-32). Cambridge University Press.
- Jebiwott, A., Ogendi, G. M., Makindi, S. M., & Esilaba, M. O. (2020). Forest cover change and its impacts on ecosystem services in Katimok forest reserve, Baringo County, Kenya. In W. Leal Filho, (Ed.), Handbook of Climate Change Resilience (pp. 515–536). Springer Nature. https://doi.org/10.1007/978-3-319-93336-8_155
- Kissinger, G., Herold, M., & De Sy, V. (2012). Drivers of Deforestation and Forest Degradation: A Synthesis Report for REDD + Policymakers. Lexeme Consulting.
- Kyale, J. K., Wardell, D. A., Mikwa, J.-F., Kabuanga, J. M., Monga, N. A. M., Oszwald, J., & Doumenge, C. (2019). Dynamique de la déforestation dans la Réserve de biosphère de Yangambi (République démocratique du Congo) : Variabilité spatiale et temporelle au cours des 30 dernières années. BOIS & FORETS DES TROPIQUES, 341(3), 15–28. https://doi.org/10.19182/bft2019.341.a31752
- Lambin, E. F., Geist, H. J., & Lepers, E. (2003). Dynamics of land-use and land –cover change in tropical regions. Annual Review of Environment and Resources, 28, 205–241. http://dx.doi.org/10.1146/annurev.energy.28.050302.1054591
- Landis, J. R., & Koch, G. G. (1977). The measurement of observer agreement for categorical data. Biometrics, 33(1), 159–174. https://doi.org/10.2307/2529310
- Le Quéré, C., Andrew, R. M., Canadell, J. G., Sitch, S., Korsbakken, J. I., Peters, G. P., Manning, A. C., Zaehle, S., Tans, P. P., Houghton, R. A., Keeling, R. F., Alin, S., Andrews, O. D., Anthoni, P., Barbero, L., Bopp, L., Chevallier, F., Chini, L. P., Ciais, P., Currie, K., & Zaehle, S. (2016). Global carbon budget 2016. Earth System Science Data, 8(2), 605–649. https://doi.org/10.5194/essd-8-605-2016
- Loveland, T. R., & Dwyer, J. L. (2012). Landsat: Building a strong future. Remote Sensing of Environment, 122, 22–29. https://doi.org/10.1016/j.rse.2011.09.022
- Lucas, R., Blonda, P., Bunting, P., Jones, G., Inglada, J., Arias, M., Kosmidou, V., Petrou, Z. I., Manakos, I., Adamo, M., Charnock, R., Tarantino, C., Mücher, C. A., Jongman, R. H. G., Kramer, H., Arvor, D., Honrado, J. P., & Mairota, P. (2015). The earth observation data for habitat monitoring (EODHaM) system. International Journal of Applied Earth Observation and Geoinformation, 37, 17–28. http://dx.doi.org/10.1016/j.jag.2014.10.011
- Malhi, Y., Gardner, T. A., Goldsmith, G. R., Silman, M. R., & Zelazowski, P. (2014). Tropical forests in the anthropocene. Annual Review of Environment and Resources, 39(1), 125–159. https://doi.org/10.1146/annurev-environ-030713-155141
- Mama, A., Sinsin, B., De Canniere, C., & Bogaert, J. (2013). Anthropisation et dynamisation des paysages en zone soudanienne au nord du Bénin. Tropicultura, 31(1), 78–88. http://www.tropicultura.org/text/v31n1/78.pdf
- Megevand, C. (2013). Deforestation trend in the Congo bassin. Reconciling economic growth and forest protection. World Bank.
- Momo Solefack, M. C., Njouonkouo, A. L., Temgoua, L. F., Djouda Zangmene, R., Wouokoue Taffo, J. B., & Ntoukpa, M. (2018). Land use/land cover change and anthropogenic causes around Koupa-Matapit gallery forest, West-Cameroon. Journal of Geography and Geology, 10(2), 56–65. https://doi.org/10.5539/jgg.v10n2p56
- Naguib, A. M., Farag, M. A., Yahia, M. A., Ramadan, H. H., & Abd Elwahab, M. S. (2009). Comparative study between support vector machines and neural networks for lithological discrimination using hyperspectral data. Egypt Journal of Remote Sensing and Space Science, 12(1), 27–42.
- Njoukam, R., Tchouamo, I. R., & Peltier, R. (1996). SOS : La réserve forestière de Melap (Foumban). Le Flamboyant, 38, 12–16.
- Pan, Y., Birdsey, R. A., Fang, J., Houghton, R., Kauppi, P. E., Kurz, W. A., Phillips, O. L., Shvidenko, A., Lewis, S. L., Canadell, J. G., Ciais, P., Jackson, R. B., Pacala, S. W., McGuire, A. D., Piao, S., Rautiainen, A., Sitch, S., & Hayes, D. (2011). A Large and Persistent Carbon Sink in the World’s Forests. Sciences, 333(6045), 988–993. https://doi.org/10.1126/science.1201609
- Peng, J., Wu, J., Yin, H., Li, Z., Chang, Q., & Mu, T. (2008). Rural land use change during 1986–2002 in Lijiang, China, based on remote sensing and GIS data. Sensors, 8(12), 8201–8223. https://doi.org/10.3390/s8128201
- Tankoano, B., Hien, M., N’Da, D. H., Sanon, Z., Yameogo, J. T., & Somda, I. (2016). Anthropogenic pressure and vegetation dynamics in the classified forest of Tiogo in Burkina Faso: Contribution of remote sensing. Tropicultura, 34(2), 193–207. http://www.tropicultura.org/text/v34n2/193.pdf
- Temgoua, L., Peltier, R., & Owona Ndongo, P. A. (2010). La réserve forestière de Mbalmayo: Pratiques et mode d’accès des populations locales. Le Flamboyant, 66, 25–29.
- Temgoua, L. F. (2011). Déterminants socio-économiques et écologiques de la plantation d’arbres producteurs de bois d’œuvre et d’artisanat dans l’Ouest Cameroun. Thèse de Doctorat. Université de Bordeaux 3.
- Temgoua, L. F., Allaissem, B., Tchamba, M., Saradoum, G., Osée, M. M., & Momo Solefack, M. C. (2018b). Spatio-temporal dynamic of land use and land cover in the classified forest of Djoli-Kera, South-Eastern, Chad. Open Journal of Forestry, 8(3), 283–296. https://doi.org/10.4236/ojf.2018.83019
- Temgoua, L. F., Momo Solefack, M. C., Nguimdo Voufo, V., Tagne Belibi, C., & Tanougong, A. (2018a). Spatial and temporal dynamic of land-cover/land-use and carbon stocks in Eastern Cameroon: A case study of the teaching and research forest of the University of Dschang. Forest Science and Technology, 14(4), 181–191. https://doi.org/10.1080/21580103.2018.1520743
- Tsayem, D. M. (2010). La télédétection en tant qu’outil de mesure de la réduction de la déforestation (REDD). Revue Télédétection, 9(3–4), 245–257. https://www.archivescontemporaines.com/articles/391
- Usman, M., Liedl, R., Shahid, M. A., & Abbas, A. (2015). Land use/land cover classification and its change detection using multi-temporal MODIS NDVI data. Journal of Geographical Sciences, 25(12), 1479–1506. https://doi.org/10.1007/s11442-015-1247-y
- Verburg, P. H., Neumann, K., & Nol, L. (2011). Challenges in using land use and land cover data for global change studies. Global Change Biology, 17(2), 974–989. https://doi.org/10.1111/j.1365-2486.2010.02307.x
- Wafo, T. G., Fotsing, J. M., & Huaman, D. (2005). Evolution du couvert végétal dans la réserve forestière de Laf-Madjam (Extrême nord du Cameroun) de 1976 à 2003. Anais XII Simposio Brasileiroo de Sensoriamento Remoto, INPE: 3379–3386.
- Zekeng, J. C., Sebego, R., Mphinyane, W. N., Mpalo, M., Nayak, D., Fobane, J. L., Onana, J. M., Funwi, F. P., & Abada Mbolo, M. M. (2019). Land use and land cover changes in Doume Communal Forest in eastern Cameroon: Implications for conservation and sustainable management. Modeling Earth Systems and Environment, 5(4), 1801–1814. https://doi.org/10.1007/s40808-019-00637-4