
 ?Mathematical formulae have been encoded as MathML and are displayed in this HTML version using MathJax in order to improve their display. Uncheck the box to turn MathJax off. This feature requires Javascript. Click on a formula to zoom.
ABSTRACT
The aim of this research was to assess the land use/land cover (LULC) changes and its impact on land surface temperature (LST) using remote-sensing (RS) technique in the district Khanewal, Punjab, Pakistan. Data were pre-processed using ERDAS imagine 15 and Arc GIS 10.4 software for layer stacking, mosaicking, and sub-setting of Landsat images. After pre-processing, the supervised classification scheme was applied for the years 1980, 2000, and 2020, which explains the maximum likelihood algorithm to identify LULC changes observed in the study area. “Built-up area” in 1980 occupied 1.75% but in 2020, the build-up area increased (5.27%) compared to 2020. Vegetation area was decreased by 4.12% from 1980 to 2020 in district Khanewal. It was observed that there has been a rapid change in vegetation area to build-up area. The LST values were increased by 0.50°C from 1980 to 2020 due to the increasing build-up area from East to West direction in district Khanewal. Maximum and minimum normalized difference vegetation index (NDVI) values were observed 0.72 and −0.2 for 1980 and 2020. The regression line produced a definitive explanation, showing a strong negative correlation with NDVI and LST. The outcomes of this study indicated that a dramatic transformation took place in district Khanewal regarding a decrease in greenness due to a rapid increase in population density, urban growth, and other infrastructural developments. Thus, these results will be used in regional and urban planning and will be used for managing agriculture in the coming years of rapid environmental changes.
1. Introduction
Impact of climate change directly and indirectly on agriculture worldwide (Akram et al., Citation2018; Hashim et al., Citation2020; Kawo et al., Citation2021; Nasim et al., Citation2018; Sabagh et al., Citation2020). Climatic and environmental changes negatively influenced the health of the crops with the passage of time in the following ways: variations in the rainfall (Kimuku & Ngigi, Citation2017), extreme heat stress, change in the land surface temperature (LST), and migration of the peoples from rural to urban areas (Hussain et al., Citation2020a; Mukherjee & Singh, Citation2020). The LST patterns provide helpful information about the environment and, therefore, help understand climate change (Cai et al., Citation2018; Ding & Shi, Citation2013; Sadiq Khan et al., Citation2020). Several factors influence it, such as soil content, vegetation changes, building material utilized inroads, and impervious and pervious surfaces (Athick et al., Citation2019; Chaudhuri & Mishra, Citation2016; Yamamoto & Ishikawa, Citation2020). The LST has inversely impacted green cover, and vegetation can expressively decrease LST in urban climate and make urban regions less vulnerable to climate change (Ahmed et al., Citation2009; Choudhury et al., Citation2018; Das & Angadi, Citation2020; Mubeen et al., Citation2021; Zahoor et al., Citation2019).
Land use/land cover (LULC) changes play a significant role in ecosystem services, impacting ecosystem functioning, local toward global scales (Sahana et al., Citation2016), and human variables like environment and government planning (Athick & Shankar, Citation2019; Sinha et al., Citation2012). The LULC change studies provide useful information for a better understanding of previous practices, current LULC patterns, and future LULC trajectory (Almazroui et al., Citation2017; Bhagyanagar et al., Citation2012; Zhang et al., Citation2016). The change detection technique is categorized in three levels based on pixel (M. J. Khan et al., Citation2020), features, and objects level image processing and presents a LULC classification using different techniques for change detection (Akhtar et al., Citation2017; Abdullah et al., Citation2019; Hussain et al., Citation2020b). It is noted by previous research, LULC changes have the prospective to have a significant environmental impact changing the urban climate (M. Ali et al., Citation2019). Different research has also confirmed the environmental effects on LULC changes (Cheema & Bastiaanssen, Citation2010; Das & Sarkar, Citation2019; Tan et al., Citation2020; B. Zoungrana et al., Citation2015).
Normalized difference vegetation index (NDVI) has a great ability to signal across the annual and seasonal variation in the vegetation cover activity and vegetation’s response to climate change (Hussain, Citation2018; Zaidi et al., Citation2017). The NDVI values were interlinked with the plant’s biological activities, and change in the NDVI represents the different biological activities in plants (Aredehey et al., Citation2018). The daily variations in LST can be well characterized easily through NDVI value, which indicates that vegetation cover state (Xu et al., Citation2016). The NDVI also helps to study the different vegetation phenology cycles at global and regional scales (Olmanson et al., Citation2016; Ullah et al., Citation2019). The vegetation response to climate variations, plant processes of seasonal cycles, and health of vegetation cover all of these can be monitored by NDVI (Forkel et al., Citation2013; Mohammed et al., Citation2019). The green cover growth and development stages can be monitored with the help of NDVI (Kidane et al., Citation2019; Omran, Citation2012; Yuan et al., Citation2015). The NDVI values depend on maximum reflectance in the near-infrared; reflectance in the red region (Naz & Rasheed, Citation2017). The productivity of vegetation covers relates to evapotranspiration and precipitation, and NDVI is a valuable tool to study vegetation cover performance at the landscape scale (Gilani et al., Citation2015; I. Khan et al., Citation2019; Rizvi et al., Citation2020; B. J. Zoungrana et al., Citation2018).
Geographic information system (GIS) and RS have proved to be very significant in analyzing and assessing LULC changes as well as LST (Ayele et al., Citation2018; Hc et al., Citation2020). Satellite-based RS has the ability to provide synoptic LULC data at a specific time and location (Chew et al., Citation2016; Saleem et al., Citation2020). The RS and GIS have a remarkable ability to map and identify LULC and LST changes (Aboelnour & Engel, Citation2018; Malik et al., Citation2020). From the last few decades, research studies highly relied on the satellite remote sensed spatial information to map individual vegetation species (Huyen et al., Citation2016) and describe the variation in the vegetation types (Kharazmi et al., Citation2018; Pal & Ziaul, Citation2017; Romaguera et al., Citation2018). The important objective of this research is to analyze the variations in LULC and LST patterns in district Khanewal. The main objectives of this research are:
Assess urban change by calculating LULC for the years 1980, 2000, and 2020 in the study area.
Calculate Land Surface Temperature (LST) in the study area from 1980, 2000, and 2020.
Examine vegetation change by calculating NDVI from 1980 to 2020.
Examine the relationship between LST and NDVI from 1980 to 2020 in district Khanewal.
2. Materials and methods
2.1. Study area
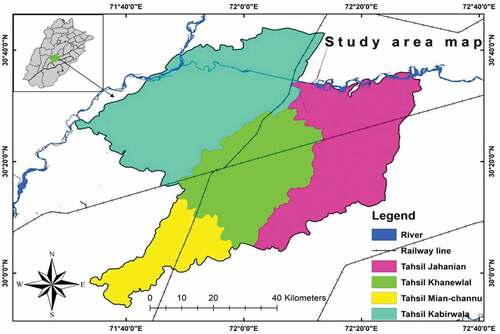
The study area was bounded by district Khanewal, located in the Southern Punjab Pakistan, selected for LULC and LST changes using RS and GIS techniques. The area of Khanewal lies between longitude 71° 56ʹ 41ʹ’ E to 72° 50ʹ 17ʹ’ E and latitude 29° 89ʹ 30ʹ’ N to 30° 72 ’85ʹ’ N. District Khanewal boundary lies on the east by Sahiwal, on the west by Multan and Muzaffargarh, on the south by Vehari and Lodhran and the north by districts of Jhang and Toba tek singh. District Khanewal has the second largest railway station in the country, the Khanewal Junction. The area of district Khanewal is an alluvial plain and flat, which is an ideal area for agricultural activities. The district Khanewal has a total area of 4,290.41 square kilometers divided into four tehsils, namely Jahanian, Mian Channu, Kabirwala, and Khanewal (Census Report 2017). Many canals are present here that irrigate this district. This irrigation network of canals makes the land very fertile. In the monsoon season, the land area close to the Chenab River is usually flooded. All areas with sweltering summers and mild winter’s features are an arid climate. The average rainfall is roughly 186 millimeters (7.3 inches). The area witnessed some of the most extreme weathers in the country with the highest recorded temperature approximately 52°C (126°F), and the lowest recorded temperature approximately −1°C (30°F). The study area map was shown in .
Figure 1. Study area map of district Khanewal.
2.2. Landsat data
Landsat-based images of 30 m × 30 m spatial resolution covering the study area were collected from for the years 1980, 2000, and 2020 downloaded from the USGS obtained by NASA’s website (https://earthexplorer.usgs.gov/.) with mixed vegetation, an agricultural area, and bare surface as mapped LULC types (Rani et al., Citation2018). For identification of LULC, LST and vegetation changes, Landsat image of Operational Land Imager (OLI), Landsat 8, Enhanced Thematic Mapper Plus (ETM+), Landsat 7, and Landsat 4, 5 Thematic Mapper (TM) was used (). The LULC pattern is characterized into four classes: vegetation area, build-up area, bare land, and waterbodies of the study area.
Table 1. Specification of Landsat satellite data.
2.3. Image processing and classification
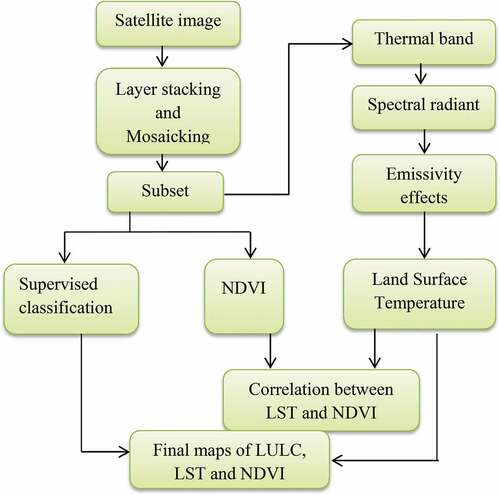
For the analysis of LULC and LST, multispectral Landsat images from satellite observatory were used. Landsat images consist of eight discrete bands; for this study, only 1–5 and 7 bands were used as band 6 is a thermal band used for LST and band 8 so it was not used for further analysis to confirm the bands and then write more. Landsat images were processed in software ERDAS imagine 15 for layer stacking (stacking the method used to produce a multiband image from discrete bands.), mosaicking (to combine the two stacked images) and sub setting (After stacking study area was extracted) of the image according to the study area (Rahman et al., Citation2017). After pre-processing, the supervised classification scheme was applied on temporal satellite datasets for the years 1980, 2000, and 2020 which explains the maximum likelihood algorithm to identify LULC changes observed in the study area. For each LULC types, training samples were selected by delimiting polygons around different demonstrative sites using software Arc GIS 10.4 (Nayak & Fulekar, Citation2017). Spectral signatures of different LULC class’s resultant from the Landsat images were noted using the pixels enclosed by these polygons. Detail methodology was represented in .
Figure 2. Flow chart for methodology.
2.4. Accuracy assessment
Accuracy assessment was considered an important phase in the valuation of several image processing processes in classification. Error matrix was the greatest mutual and general means to present accuracy assessment. Producer accuracy, user accuracy, and overall accuracy were calculated by using EquationEquation (1)(1)
(1) .
The kappa (K) values measure how well RS classification agrees or is accurate with the reference data. A statistical representation of kappa (K) is as follows: A Statistical representation of kappa (K) is as follows (Safder, Citation2019):
2.5. Estimation of NDVI
The vegetation cover, for example, NDVI was calculated for the monitoring of vegetation area. The NDVI values were estimated as follows (Mohammed et al., Citation2019):
where NIR is near-infrared band (TM and ETM band 4, OLI band 5) as well as R is the red band (TM and ETM band 3, OLI band 4).
The NDVI was estimated from Landsat images as well as have characteristic values between −1 and 1.
2.6. Estimation of LST
The LST is a general term describing the joint temperature of complete objects existing on the terrestrial. Different researchers used defined measurement on Landsat data to compute the LST. The LST values were estimated from the TM, TM+, and OLI thermal band like (band 6 and band 10). All steps for calculation of LST are given below (Bento et al., Citation2018).
Firstly, Lλ the values were estimated to spectral radiance by EquationEquation (4)(4)
(4) .
where Lλ represents spectral radiance and QCAL is quantized calibrated pixel value in DN.
Second step, the spectral radiance value was changed to temperature by using EquationEquation (5)(5)
(5) (Orimoloye et al., Citation2018).
where K1 and K2 values are 607.76 and 1260.56 for Landsat 4/5 (TM), and 772.88 and 1321.07 for Landsat 8 (OLI), respectively.
Final step, temperature which was in Kelvin was converted to Celsius (C°) through EquationEquation (6)(6)
(6) (Cristóbal et al., Citation2018).
3. Results and discussion
3.1. Land use/and cover (LULC) changes
The analysis of LULC changes using supervised classification technique from 1980 to 2020 presented that district Khanewal was covered with different land features (built-up area, vegetation area, waterbodies, and bare soil) shown in . In the year 1980, the vegetation area was 94.15% while waterbodies covered by (1.67%); the built-up area was covered by 1.75% while bare soil covered about 2.43%. In the year 2000, vegetation area was covered by 92.8%, followed by waterbodies 1.51%; the built-up area was covered by 3.5% while the area was covered by bare soil 2.19% (). On the other hand, in the year 2020, vegetation area was covered by 90.03%, followed by water (1.2%); the built-up area was covered by 7.02% while the area covered by bare soil 1.75%. The area under the built-up indicated the increasing trend from 2000 to 2020 in the study area.
Table 2. The LULC areal distribution from 1980 to 2020 in district Khanewal.
Figure 3. The LULC maps for the years 1980, 2000 and 2020 of district Khanewal.
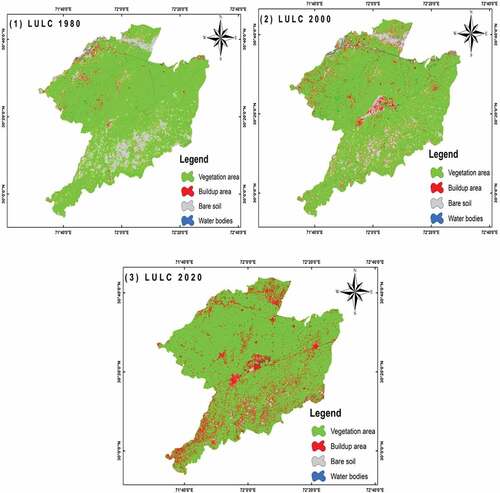
“Built-up area” in 1980 was covered 1.75% in district Khanewal. On the other hand, in 2020, the build-up area was increased (5.27%) as compared to 2020. Although there is a large increase in “building area” has practiced an important increase during 1980 to 2020 shown in . “Vegetation area” in 1980 was covered with 94.15%, but in 2000 vegetation area decreased (1.35%) as compared to 1980 and similarly “vegetation” in 2000 occupies the class with 92.8%, but in 2020 vegetation area decreased (4.12%) as compared to 2000. The total area in district Khanewal was 10578.01 ha (2.43%) under bare soil in 1980 that decreased by 2952.71 ha (10.68%) in 2020. The waterbodies decreased by 2062.16 ha (0.47%) from 1980 to 2020 in district Khanewal, as shown in . These changes occurred due to an increase in urban areas near the city in the study area. On the other word, a slight increase was perceived in the eastern and western sides. The built-up area was increased in the study area due to the construction of several new colonies in the east and western sides.
Table 3. Change analysis from 1980 to 2020 in district Khanewal.
Our results indicated that vegetation area and bare soil were converted to roads, commercial, and residential areas. In 1981, the total population was 1 Million, which increased to 2 Million in 2017, raising more than 1 Million populations from 1981 to 2017 in Khanewal district (). Due to the increasing population, the build-up area was increased in different regions of district Khanewal. Our results showed that almost 5% of the vegetation and bare soil have converted to built-up areas for 40 years. Different vegetation areas have been converted into residential colonies in the study area. The commercial area is also growing with the densification of a residential area. The objective of change detection is to know which LULC was decreased or increased from the previous few years. Change detection gives precise information about the rate at which the area is changing in LULC. By A. Ali et al. (Citation2018), the built-up area has increased, while the populated area’s increase rate was a bit less during the last few years. According to Hussain et al. (Citation2020c) found that a rapid increase in urban areas is expected; significantly impacting vegetation areas in the approaching years in district Multan. According to Usman et al. (Citation2015), LULC classes with minimum and maximum changes under a LULC were nominated as upper and lower baselines to detect the vegetation changes during the last few years.
Table 4. District Khanewal population during 1981 to 2017 (GOP, Citation2017).
3.2. Accuracy assessment
Detail of user’s and producer’s accuracy as well as kappa (K) values for different LULC classes for the years 1980, 2000, and 2020 is shown in . Average producer and user accuracies were 88.1% and 91% for 1980, 89.5% and 89.6% for 2000 and 89.7% and 87.3% for 2020, respectively. The highest and lowest producer’s accuracy as well as user’s accuracy values observed for “building area” was 95.5% (2020), 86.7% (1980) and 100% (2000), 90.8% (1980), respectively. Similarly, the highest and lowest producer’s accuracy as well as user’s accuracy values observed for “bare soil” were 88.2% (2020), 84.6% (1980), and 86% (1980) and 83.7% (2000), respectively. Overall accuracy for classification for the studied years was also reasonable 0.83%, 0.88%, and 0.86% for the years 1980, 2000, and 2020, respectively. Kappa (K) values were noted 0.80%, 0.85% and 0.82% for the years 1980, 2000 and 2020, respectively, in the study area. The producer’s accuracy is the map accuracy (the producer of the map), but the user’s accuracy is the accuracy from the map user’s point of view, not the mapmaker. In our results, the two accuracies were in a fairly well range, which showed fewer errors in classification.
Table 5. Summary of producer’s and user’s accuracy and kappa (K) coefficients in district Khanewal.
3.3. Land surface temperature (LST) changes
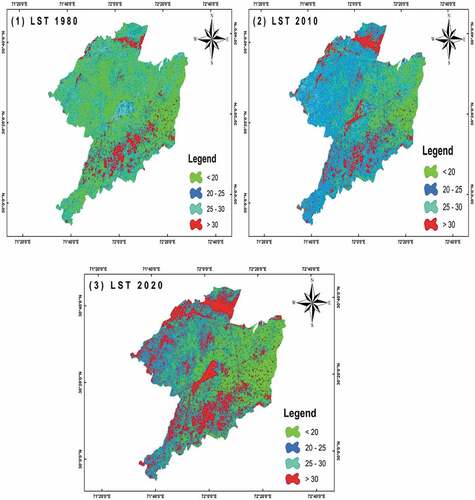
indicates a spatial pattern and areal distribution of LST in threeyears, for example, 1980, 2000 and 2020 in district Khanewal. The LST spatial patterns temporal and concentration shift LST highlight the changes in LULC classes rapidly. Generally, LST was estimated the range of 10.3–44.6°C during 1980, 10.8–45°C during 2000, and 11.2–44.7°C during 2020. This growth is wholly arithmetic; however, more accurate growth of the temperature was measured using the spatial average, and it designates that since 1980–2020, approximately 0.5°C LST has increased. The LST was increased due to increasing the build-up area in the study area from 1980 to 2020. The eastern part of the study area exhibits a lower temperature due to higher vegetation and agricultural land. In contrast, the central part (like district Khanewal) exhibits the rise in LST due to rapid urban expansion and declining waterbodies and vegetation cover. The highest deviation was noticed in maximum and minimum temperatures for the year 2020 (44.7°C) and (11.2°C), respectively. In 1980, maximum and minimum deviation in temperature was (44.6°C) and (10.3°C), respectively, shown in (). Considering all the limitations of RS derived LST estimation, the deviation between estimated and recorded LST is acceptable and can be used further analysis in the future like LST simulation and temperature condition index in the study area. Furthermore, the maximum LST values in Kanewala were estimated in the city’s central part (Khanewal), which is severely urbanized and quickly increasing, representing a positive relationship between LST and built-up areas.
Table 6. Maximum and minimum values of LST and NDVI.
Figure 4. The LST maps for the years 1980, 2000 and 2020 of district Khanewal.
3.4. Normalized difference vegetation index (NDVI) changes
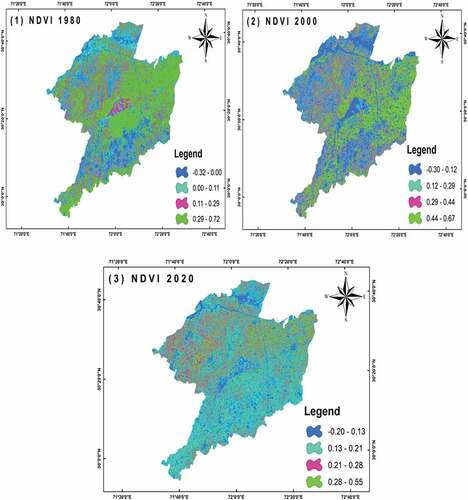
Assessment of NDVI using Landsat image is based on the spectral properties of vegetation, absorbs visible light on vegetation, energy used in photosynthesis, and reflects near-infrared (NIR) radiation. The NDVI model derived through Landsat images of 1980, 2000, and 2020 as shown in . ERDAS Imagine 2015 software was used to identify vegetation cover. The NDVI values ranges in 1980 were −0.32 to + 0.72 in the study area, while in 2000, NDVI values changed (minimum −0.3 and maximum +0.67). In 2020, NDVI values changed (minimum −0.2 and maximum +0.55) in the study area (). Higher NDVI values showed that there are most productive and productive areas, such as vegetation and forest. On the contrary, lower values of NDVI showed that there are least and less productive areas, for example, bare soil, waterbodies, and build-up area. Therefore, the NDVI map showed a major decrease in the most productive and productive area in the study area. Overall, the NDVI value is higher in forest lands than that for bare soil, and thus, the enlarged vegetation area may have its influence on satellite-observed greenness of vegetation throughout the study area. It was noted that there was a large (NDVI values) change in 1980 as compared to 2020. The finding by Ahmad (Citation2012) presented that there was an increase in NDVI values in the district Multan. According to him, one of the greatest successful methods is established on tracking the historical change of a VI like NDVI values.
Figure 5. The NDVI maps for the years 1980, 2000, and 2020 of district Khanewal.
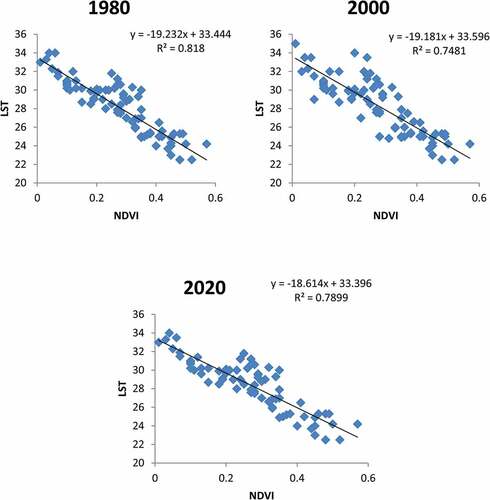
3.5. Relationship between LST and NDVI
shows the correlation between NDVI and LST. The regression line produced dramatic clarification, showing a strong negative relationship between NDVI and LST. The linear regression analysis (R2) for 3 years of the analysis indicated that LST and NDVI are negatively correlated to each other like 0.81, 0.74, and 0.78 for the years 1980, 2000, and 2020, respectively (). These results show that vegetation-covered areas can decrease due to the effects of LST. The negative relationship between NDVI and LST identifies that the greater biomass of vegetation cover has lower LST. The LST and NDVI have a direct impact on LULC changes. It also implies that the territories showing most reduced NDVI values have less vegetal spread due to the urban extension, while the higher NDVI values have thick vegetal spread, and in this way, LST increase with the abatement in vegetal density. A solid relationship is seen among LST and NDVI, which guarantees the possibility of utilizing direct relapse in foreseeing LST if the estimations of NDVI are known in the study area. From this time forward, the exact LST can be calculated by utilizing NDVI. It is perceived that the NDVI values have decreased from 1980 to 2020 due to increasing urban growth and decreasing vegetation area. The maximum LST values show the littler NDVI and vice versa as well as it additionally distinguishes the territories with high LST being bare soil and regions with low temperature secured with more vegetation.
Figure 6. Relationship between LST and NDVI for the years 1980, 2000, and 2020 of district Khanewal.
4. Conclusion
The important objective of this study was to assessment LULC changes and its impact on LST in district Khanewal using RS and GIS software. “Built-up area” in 1980 covered 1.75%, but in 2020 build-up area increased (5.27%) as compared to 2020. Vegetation area was decreased by 4.12% from 1980 to 2020 in district Khanewal. It was observed that there has been a rapid change in vegetation area to build-up area. The LST values were increased 0.5°C from 1980 to 2020 due to the increasing build-up area in district Khanewal. The regression analysis is also showing a strong negative relationship between NDVI and LST. Our results show that decrease in vegetation area and water resources has also been one of the main reasons for reducing vegetation areas. Due to these changes, we lost natural ecology and biodiversity, due to increasing build-up areas may lead to a lot of environmental problems. This study will help in improving the capacity of government in the study area to device complete strategies at the local and national level for land management. Increase in agricultural production would improve economy of the people as well as our country will progress quite rapidly.
Disclosure statement
No potential conflict of interest was reported by the author(s).
References
- Abdullah, A., Masrur, A., Adnan, M., Baky, M., Hassan, Q., & Dewan, A. (2019). Spatio-temporal patterns of land use/land cover change in the heterogeneous coastal region of Bangladesh between 1990 and 2017. Remote Sensing, 11(7), 790. https://doi.org/10.3390/rs11070790
- Aboelnour, M., & Engel, B. A. (2018). Application of remote sensing techniques and geographic information systems to analyze land surface temperature in response to land use/land cover change in greater Cairo region, Egypt. Journal of Geographic Information System, 10 (1), 57–88. https://doi.org/10.4236/jgis.2018.101003
- Ahmad, F. (2012). A review of remote sensing data change detection: Comparison of Faisalabad and Multan districts, Punjab province, Pakistan. Journal of Geography and Regional Planning, 5(9), 236–251. https://doi.org/10.5897/JGRP11.121
- Ahmed, J., Ahmed, M., Laghari, A., Lohana, W., Ali, S., & Fatmi, Z. (2009). Public private mix model in enhancing tuberculosis case detection in District Thatta, Sindh, Pakistan. Journal of the Pakistan Medical Association, 59(2), 82. http://ecommons.aku.edu/pakistan_fhs_mc_chs_chs/22
- Akhtar, F., Awan, U. K., Tischbein, B., & Liaqat, U. W. (2017). A phenology based geo-informatics approach to map land use and land cover (2003–2013) by spatial segregation of large heterogenic river basins. Applied Geography, 88, 48–61. https://doi.org/10.1016/j.apgeog.2017.09.003
- Akram, R., Turan, V., Hammad, H. M., Ahmad, S., Hussain, S., Hasnain, A., Maqbool, M. M., Rehmani, M. I. A., Rasool, A., Masood, N., & Mahmood, F. (2018). Fate of organic and inorganic pollutants in paddy soils. In Muhammad Zaffar Hashmi and Ajit Varma (Eds.), Environmental pollution of paddy soils (pp. 197–214). Springer. https://doi.org/10.1007/978-3-319-93671-0_13
- Ali, A., Khalid, A., Butt, M. A., Mehmood, R., Mahmood, S. A., Sami, J., Ali, F., Shafique, K., Ghalib, A. K., Waheed, R., Ali, F., Mukhtar, R., & Azhar, M. (2018). Towards a remote sensing and GIS-based technique to study population and urban growth: A case study of Multan. Advances in Remote Sensing, 7(03), 245. https://doi.org/10.4236/ars.2018.73017
- Ali, M., Mubeen, M., Hussain, N., Wajid, A., Farid, H. U., Awais, M., Hussain, S., Akram, W., Amin, A., Akram, R., & Imran, M. (2019). Role of ICT in crop management. In Mirza Hasanuzzaman (Ed.), Agronomic crops (pp. 637–652). Springer. https://doi.org/10.1007/978-981-32-9783-8_28
- Almazroui, M., Masshat, A., Assiri, M., & Butt, M. (2017). Application of landsat data for urban growth monitoring in Jeddah. Earth System Environment, 1(2), 25. https://doi.org/10.1007/s41748-017-0028-4
- Aredehey, G., Mezgebu, A., & Girma, A. (2018). Land-use land-cover classification analysis of Giba catchment using hyper temporal MODIS NDVI satellite images. International Journal of Remote Sensing, 39(3), 810–821. https://doi.org/10.1080/01431161.2017.1392639
- Athick, A. A. S. M., & Shankar, K. (2019). Data on land use and land cover changes in Adama Wereda, Ethiopia, on ETM+, TM and OLI- TIRS landsat sensor using PCC and CDM techniques, Data in Brief, 24, 103880. https://doi.org/10.1016/j.dib.2019.103880
- Athick, A. M. A., Shankar, K., & Naqvi, H. R. (2019). Data on time series analysis of land surface temperature variation in response to vegetation indices in twelve Wereda of Ethiopia using mono window, split window algorithm and spectral radiance model. Data in Brief, 27, 104773. https://doi.org/10.1016/j.dib.2019.104773
- Ayele, G. T., Tebeje, A. K., Demissie, S. S., Belete, M. A., Jemberrie, M. A., Teshome, W. M., & Teshale, E. Z. (2018). Time series land cover mapping and change detection analysis using geographic information system and remote sensing, Northern Ethiopia. Air, Soil and Water Research, 11, 1178622117751603. https://doi.org/10.1177/1178622117751603
- Bento, V., Trigo, I., Gouveia, C., & DaCamara, C. (2018). Contribution of land surface temperature (TCI) to vegetation health index: A comparative study using clear sky and all-weather climate data records. Remote Sensing, 10(9), 1324. https://doi.org/10.3390/rs10091324
- Bhagyanagar, R., Kawal, B. M., Dwarakish, G. S., & Surathkal, S. (2012). Land use/land cover change and urban expansion during 1983–2008 in the coastal area of Dakshina Kannada district, South India. Journal of Applied Remote Sensing, 6(1), 063576. https://doi.org/10.1117/1.JRS.6.063576
- Cai, M., Ren, C., Xu, Y., Lau, K. K. L., & Wang, R. (2018). Investigating the relationship between local climate zone and land surface temperature using an improved WUDAPT methodology–A case study of Yangtze River Delta, China. Urban Climate, 24, 485–502. http://dx.doi.org/10.1016/j.uclim.2017.05.010
- Chaudhuri, G., & Mishra, N. B. (2016). Spatio-temporal dynamics of land cover and land surface temperature in Ganges-Brahmaputra delta: A comparative analysis between India and Bangladesh. Applied Geography, 68, 68–83. https://doi.org/10.1016/j.apgeog.2016.01.002
- Cheema, M. J. M., & Bastiaanssen, W. G. (2010). Land use and land cover classification in the irrigated Indus Basin using growth phenology information from satellite data to support water management analysis. Agricultural Water Management, 97(10), 1541–1552. https://doi.org/10.1016/j.agwat.2010.05.009
- Chew, C., Shah, R., Zuffada, C., Hajj, G., Masters, D., & Mannucci, A. J. (2016). Demonstrating soil moisture remote sensing with observations from the UK TechDemoSat‐1 satellite mission. Geophysical Research Letters, 43(7), 3317–3324. https://doi.org/10.1002/2016GL068189
- Choudhury, D., Das, K., & Das, A. (2018). Assessment of land use land cover changes and its impact on variations of land surface temperature in Asansol-Durgapur development region. Egypt Journal of Remote Sensing and Space Science, 22(2), 203–218 https://doi.org/10.1016/j.ejrs.2018.05.004
- Cristóbal, J., Jiménez-Muñoz, J., Prakash, A., Mattar, C., Skoković, D., & Sobrino, J. (2018). An improved single-channel method to retrieve land surface temperature from the Landsat-8 thermal band. Remote Sensing, 10(3), 431. https://doi.org/10.3390/rs10030431
- Das, S., & Angadi, D. P. (2020). Land use-land cover (LULC) transformation and its relation with land surface temperature changes: A case study of Barrackpore subdivision, West Bengal, India. Remote Sensing Applications: Society and Environment, 19, 100322. https://doi.org/10.1016/j.rsase.2020.100322
- Das, S., & Sarkar, R. (2019). Predicting the land use and land cover change using Markov model: A catchment level analysis of the Bhagirathi-Hugli River. Spatial Information Research, 27(4), 439–452. https://doi.org/10.1007/s41324-019-00251-7
- Ding, H., & Shi, W. (2013). Land-use/land-cover change and its influence on surface temperature: A case study in Beijing city. International Journal of Remote Sensing, 34(15), 5503–5517. https://doi.org/10.1080/01431161.2013.792966
- Forkel, M., Carvalhais, N., Verbesselt, J., Mahecha, M., Neigh, C., & Reichstein, M. (2013). Trend change detection in NDVI time series: Effects of inter-annual variability and methodology. Remote Sensing, 5(5), 2113–2144. https://doi.org/10.3390/rs5052113
- Gilani, H., Shrestha, H. L., Murthy, M. S. R., Phuntso, P., Pradhan, S., Bajracharya, B., & Shrestha, B. (2015). Decadal land cover change dynamics in Bhutan. Journal of Environmental Management, 148, 91–100. https://doi.org/10.1016/j.jenvman.2014.02.014
- Government of Punjab. (2017). Pakistan bureau of statistics. http://www.pbs.gov.pk/
- Hashim, A. M., Elkelish, A., Alhaithloul, H. A., El-Hadidy, S. M., & Farouk, H. (2020). Environmental monitoring and prediction of land use and land cover spatio-temporal changes: A case study from El-Omayed Biosphere Reserve, Egypt. Environmental Science and Pollution Research, 27(34), 42881–42897. https://doi.org/10.1007/s11356-020-10208-1
- Hc, H., Srikanth, L., & Surendra, H. J. (2020). Prioritization of sub-watersheds of the Kanakapura watershed in the Arkavathi River Basin, Karnataka, India-using remote sensing and GIS. Geology, Ecology, and Landscapes, 5(2), 149–160. https://doi.org/10.1080/24749508.2020.1846841
- Hussain, S. (2018). Land use/land cover classification by using satellite NDVI tool for sustainable water and climate change in Southern Punjab [MS thesis]. COMSATS University. https://doi.org/10.13140/RG.2.2.32363.69923.
- Hussain, S., Ahmad, A., Wajid, A., Khaliq, T., Hussain, N., Mubeen, M., Farid, H. U., Imran, M., Hammad, H. M., Awais, M., Ali, A., Aslam, M., Amin, A., Akram, R., Amanet, K., & Nasim, W. (2020a). Irrigation scheduling for cotton cultivation. In Shakeel Ahmad and Mirza Hasanuzzaman (Eds.), Cotton production and uses (pp. 59–80). Springer. https://doi.org/10.1007/978-981-15-1472-2_5
- Hussain, S., Mubeen, M., Ahmad, A., Akram, W., Hammad, H. M., Ali, M., Masood, N., Amin, A., Farid, H. U., Sultana, S. R., & Fahad, S. (2020b). Using GIS tools to detect the land use/land cover changes during forty years in Lodhran district of Pakistan. Environmental Science and Pollution Research, 27(32), 39676–39692. https://doi.org/10.1007/s11356-019-06072-3
- Hussain, S., Mubeen, M., Akram, W., Ahmad, A., Habib-ur-rahman, M., Ghaffar, A., Amin, A., Awais, M., Farid, H. U., Farooq, A., & Nasim, W. (2020c). Study of land cover/land use changes using RS and GIS: A case study of Multan district, Pakistan. Environmental Monitoring and Assessment, 192(1), 2. https://doi.org/10.1007/s10661-019-7959-1
- Huyen, N. T., Tu, L. H., Liem, N. D., Tram, V. N. Q., Minh, D. N., & Loi, N. K. (2016). Assessing impacts of land use and climate change on soil and water resources in the Srepok watershed, Central Highland of Vietnam. Policy Brief Series, 2016, 1–4. https://doi.org/10.13140/RG.2.2.28700.08326
- Kawo, N. S., Hordofa, A. T., & Karuppannan, S. (2021). Performance evaluation of GPM-IMERG early and late rainfall estimates over Lake Hawassa catchment, Rift Valley Basin, Ethiopia. Arabian Journal of Geosciences, 14(4), 256. https://doi.org/10.1007/s12517-021-06599-1
- Khan, I., Javed, T., Khan, A., Lei, H., Muhammad, I., Ali, I., & Huo, X. (2019). Impact assessment of land use change on surface temperature and agricultural productivity in Peshawar-Pakistan. Environmental Science and Pollution Research, 26(32), 33076–33085. https://doi.org/10.1007/s11356-019-06448-5
- Khan, M. J., Zeeshan, M. M., & Ali, S. S. (2020). Gis-based change detection of coastal features along Karachi coast Pakistan. Pakistan Journal of Science, 72(2), 124.
- Kharazmi, R., Tavili, A., Rahdari, M. R., Chaban, L., Panidi, E., & Rodrigo-Comino, J. (2018). Monitoring and assessment of seasonal land cover changes using remote sensing: A 30-year (1987–2016) case study of Hamoun Wetland, Iran. Environmental Monitoring and Assessment, 190(6), 356. https://doi.org/10.1007/s10661-018-6726-z
- Kidane, M., Tolessa, T., Bezie, A., Kessete, N., & Endrias, M. (2019). Evaluating the impacts of climate and land use/land cover (LU/LC) dynamics on the hydrological responses of the Upper Blue Nile in the Central Highlands of Ethiopia. Spatial Information Research, 27(2), 151–167. https://doi.org/10.1007/s41324-018-0222-y
- Kimuku, C. W., & Ngigi, M. M. (2017). Study of urban heat island trends to aid in urban planning in Nakuru County-Kenya. https://doi.org/10.4236/jgis.2017.93019.
- Malik, S. M., Arshad, S., Alam, K., & Bilal, O. (2020). Monitoring urban growth and land use changes using GIS and remote sensing: A case study of Tehsil Burewala. Journal of Himalayan Earth Science, 53(1), 140.
- Mohammed, A. A. A. S., Shankar, K., & Hasan, R. N. (2019). Data on time series analysis of land surface temperature variation in response to vegetation indices in twelve Wereda of Ethiopia using mono window, split window algorithm and spectral radiance model. Data in Brief, 27, 104773. https://doi.org/10.1016/j.dib.2019.104773
- Mubeen, M., Bano, A., Ali, B., Islam, Z. U., Ahmad, A., Hussain, S., Fahad, S., & Nasim, W. (2021). Effect of plant growth promoting bacteria and drought on spring maize (Zea mays L.). Pakistan Journal of Botany, 53(2), 731–739. http://dx.doi.org/10.30848/PJB2021-2(38)
- Mukherjee, F., & Singh, D. (2020). Assessing land use–land cover change and its impact on land surface temperature using LANDSAT data: A comparison of two urban areas in India. Earth System Environment, 4(2), 385–407. https://doi.org/10.1007/s41748-020-00155-9
- Nasim, W., Amin, A., Fahad, S., Awais, M., Khan, N., Mubeen, M., Hussain, S., Rehman, M. H., Ihsan, M. Z., Ahmad, S., Hussain, S., Mian, I. A., Khan, B., & Jamal, Y. (2018). Future risk assessment by estimating historical heat wave trends with projected heat accumulation using SimCLIM climate model in Pakistan. Atmospheric Research, 205, 118–133. https://doi.org/10.1016/j.atmosres.2018.01.009
- Nayak, D. P., & Fulekar, M. H. (2017). Coastal geomorphological and land use and land cover study on some sites of Gulf of Kachchh, Gujarat, West Coast of India using multi-temporal remote sensing data. International Journal of Advanced Remote Sensing and GIS, 6(1), 2192–2203. https://doi.org/10.23953/cloud.ijarsg.273
- Naz, A., & Rasheed, H. (2017). Modeling the rice land suitability using GIS and multi-criteria decision analysis approach in Sindh, Pakistan. Journal of Basic and Applied Sciences, 13, 26–33. https://doi.org/10.6000/1927-5129.2017.13.05
- Olmanson, L. G., Brezonik, P. L., Finlay, J. C., & Bauer, M. E. (2016). Comparison of Landsat 8 and Landsat 7 for regional measurements of CDOM and water clarity in lakes. Remote Sensing of Environment, 185, 119–128. http://dx.doi.org/10.1016/j.rse.2016.01.007
- Omran, E. S. E. (2012). Detection of land-use and surface temperature change at different resolutions. Journal of Geographic Information System, 4(3), 189. https://doi.org/10.4236/jgis.2012.43024
- Orimoloye, I. R., Mazinyo, S. P., Nel, W., & Kalumba, A. M. (2018). Spatiotemporal monitoring of land surface temperature and estimated radiation using remote sensing: Human health implications for East London, South Africa. Environmental Earth Sciences, 77(3), 77. https://doi.org/10.1007/s12665-018-7252-6
- Pal, S., & Ziaul, S. (2017). Detection of land use and land cover change and land surface temperature in English Bazar urban centre. Egypt Journal of Remote Sensing and Space Science, 20(1), 125–145. https://doi.org/10.1016/j.ejrs.2016.11.003
- Rahman, M. T. U., Tabassum, F., Rasheduzzaman, M., Saba, H., Sarkar, L., Ferdous, J., & Islam, A. Z. (2017). Temporal dynamics of land use/land cover change and its prediction using CA-ANN model for southwestern coastal Bangladesh. Environmental Monitoring and Assessment, 189(11), 565. https://doi.org/10.1007/s10661-017-6272-0
- Rani, M., Kumar, P., Pandey, P. C., Srivastava, P. K., Chaudhary, B. S., Tomar, V., & Mandal, V. P. (2018). Multi-temporal NDVI and surface temperature analysis for urban heat island inbuilt surrounding of sub-humid region: A case study of two geographical regions. Remote Sensing Applications: Society and Environment, 10, 163–172. https://doi.org/10.1016/j.rsase.2018.03.007
- Rizvi, S. H., Fatima, H., Alam, K., & Iqbal, M. J. (2020). The surface urban heat island intensity and urban expansion: A comparative analysis for the coastal areas of Pakistan. Environment, Development and Sustainability, 23(4), 5520–5537. https://doi.org/10.1007/s10668-020-00828-5
- Romaguera, M., Vaughan, R. G., Ettema, J., Izquierdo-Verdiguier, E., Hecker, C. A., & Van der Meer, F. D. (2018). Detecting geothermal anomalies and evaluating LST geothermal component by combining thermal remote sensing time series and land surface model data. Remote Sensing of Environment, 204, 534–552. https://doi.org/10.1016/j.rse.2017.10.003
- Sabagh, A. E., Hossain, A., Islam, M. S., Iqbal, M. A., Fahad, S., Ratnasekera, D., & Llanes, A. (2020). Consequences and mitigation strategies of heat stress for sustainability of soybean (Glycine max L. Merr.) production under the changing climate. In Akbar Hossain (Ed.), Plant stress physiology. IntechOpen. http://dx.doi.org/10.5772/intechopen.92098
- Sadiq Khan, M., Ullah, S., Sun, T., Rehman, A. U., & Chen, L. (2020). Land-use/land-cover changes and its contribution to urban heat island: A case study of Islamabad, Pakistan. Sustainability, 12(9), 3861. https://doi.org/10.3390/su12093861
- Safder, Q. (2019). Assessment of urbanization and urban sprawl analysis through remote sensing and GIS: A case study of Faisalabad, Punjab, Pakistan. International Journal of Academic Research in Business and Social Sciences, 9(4). http://dx.doi.org/10.6007/IJARBSS/v9-i4/5811
- Sahana, M., Ahmed, R., & Sajjad, H. (2016). Analyzing land surface temperature distribution in response to land use/land cover change using split window algorithm and spectral radiance model in Sundarban Biosphere Reserve, India. Modeling Earth Systems and Environment, 2(2), 81. https://doi.org/10.1007/s40808-016-0135-5
- Saleem, M. S., Ahmad, S. R., & Javed, M. A. (2020). Impact assessment of urban development patterns on land surface temperature by using remote sensing techniques: A case study of Lahore, Faisalabad and Multan district. Environmental Science and Pollution Research, 27(32), 39865–39878. https://doi.org/10.1007/s11356-020-10050-5
- Sinha, P., Kumar, L., & Reid, N. (2012). Three-date landsat thematic mapper composite in seasonal land-cover change identification in a mid-latitudinal region of diverse climate and land use. Journal of Applied Remote Sensing, 6(1), 063595. https://doi.org/10.1117/1.JRS.6.063595
- Tan, J., Yu, D., Li, Q., Tan, X., & Zhou, W. (2020). Spatial relationship between land-use/land-cover change and land surface temperature in the Dongting Lake area, China. Scientific Reports, 10(1), 1–9. https://doi.org/10.1038/s41598-020-66168-6
- Ullah, S., Tahir, A., Akbar, T., Hassan, Q., Dewan, A., Khan, A., & Khan, M. (2019). Remote sensing-based quantification of the relationships between land use land cover changes and surface temperature over the lower Himalayan region. Sustainability, 11(19), 5492. https://doi.org/10.3390/su11195492
- Usman, M., Liedl, R., Shahid, M. A., & Abbas, A. (2015). Land use/land cover classification and its change detection using multi-temporal MODIS NDVI data. Journal of Geographical Sciences, 25(12), 1479–1506. https://doi.org/10.1007/s11442-015-1247-y
- Xu, L., Li, B., Yuan, Y., Gao, X., Zhang, T., & Sun, Q. (2016). Detecting different types of directional land cover changes using MODIS NDVI time series dataset. Remote Sensing, 8(6), 495. http://dx.doi.org/10.3390/rs8060495
- Yamamoto, Y., & Ishikawa, H. (2020). Influence of urban spatial configuration and sea breeze on land surface temperature on summer clearsky days. Urban Climate, 31, 100578. https://doi.org/10.1016/j.uclim.2019.100578
- Yuan, X., Longhui, L., Xi, C., & Hao, S. (2015). Effects of precipitation intensity and temperature on NDVI-based grass change over Northern China during the period from 1982 to 2011. Remote Sensing, 7(8), 10164–10183. https://doi.org/10.3390/rs70810164
- Zahoor, S. A., Ahmad, S., Ahmad, A., Wajid, A., Khaliq, T., Mubeen, M., Hussain, S., Din, M. S. U., Amin, A., Awais, M., & Nasim, W. (2019). Improving water use efficiency in agronomic crop production. In Mirza Hasanuzzaman (Ed.), Agronomic crops (pp. 13–29). Springer. https://doi.org/10.1007/978-981-32-9783-8_2
- Zaidi, S. M., Akbari, A., Abu Samah, A., Kong, N. S., Gisen, A., & Isabella, J. (2017). Landsat-5 time series analysis for land use/land cover change detection using NDVI and semi-supervised classification techniques. Polish Journal of Environmental Studies, 26(6). https://doi.org/10.15244/pjoes/68878
- Zhang, Z., Liu, S., Wei, J., Xu, J., Guo, W., Bao, W., Jiang, Z., & Zhu, L. (2016). Mass change of glaciers in Muztag Ata–Kongur Tagh, Eastern Pamir, China from 1971/76 to 2013/14 as derived from remote sensing data. PloS One, 11(1), e0147327. http://dx.doi.org/10.1371/journal.pone.0147327
- Zoungrana, B., Conrad, C., Amekudzi, L., Thiel, M., Da, E., Forkuor, G., & Löw, F. (2015). Multi-temporal landsat images and ancillary data for land use/cover change (LULCC) detection in the Southwest of Burkina Faso, West Africa. Remote Sensing, 7(9), 12076–12102. https://doi.org/10.3390/rs70912076
- Zoungrana, B. J., Conrad, C., Thiel, M., Amekudzi, L. K., & Da, E. D. (2018). MODIS NDVI trends and fractional land cover change for improved assessments of vegetation degradation in Burkina Faso, West Africa. Journal of Arid Environments, 153, 66–75. https://doi.org/10.1016/j.jaridenv.2018.01.005