
 ?Mathematical formulae have been encoded as MathML and are displayed in this HTML version using MathJax in order to improve their display. Uncheck the box to turn MathJax off. This feature requires Javascript. Click on a formula to zoom.
ABSTRACT
Soil moisture plays a crucial role in the assessment of weather patterns and analyzing the precipitation. The moisture analysis in the soil surface has been most efficient with passive remote sensing. The study attempts extraction of soil moisture and quantifying it with rainfall. The Marathwada division was selected as the study area, the region corresponds to low rainfall and is a drought-prone area. The data used were AMSR-E/Aqua Daily L3 gridded soil moisture and CHRS rainfall data, the daily product of 25 km×25 km resolution. The methodology was demonstrated for the years 2003, 2004, and 2005. A cumulative 122 AMSR-E daily ascending and descending scenes were retrieved and analyzed for the rainy season. The spatial analysis depicts peak soil moisture of 25% for the year 2005, greater than 20%, and 18% during 2003 and 2004, respectively. Peak moisture corresponding to all years is 20% in July compared to 13%, 17%, and 16% in June, August, and September, respectively. The temporal analysis revealed that during the onset of monsoon, soil moisture is 4% with 1.5 mm rainfall and it increases by 25% at peak rainfall of 39 mm. The soil moisture variation is in line with seasonal changes and rainfall variations.
1. Introduction
The volume fraction of water retained in the soil is known as soil moisture and is considered a fundamental concept in the hydrological cycle (Berwal et al. Citation2016). It is considered a significant parameter in numerous applications such as agriculture, water management, climate studies, and environmental risk prediction (Suri, Citation2013). The variability of soil moisture at a given location is primarily determined by the amount of precipitation measured in the area (Karthikeyan & Kumar, Citation2014). Soil moisture is a crucial climatic parameter of higher importance in the rainfall scenario, and recognizing its spatial-temporal variability across the Indian region is of greater relevance (Sathyanadh et al., Citation2016).
The soil moisture mapping has been performed adopting optical, thermal infrared, and microwaves remote sensing (Kingra et al., Citation2016). Remotely sensed soil surface moisture is immensely beneficial in the fields of irrigation, hydrogeology, and meteorology. Researchers from all over the world have recently used and explored remotely sensed satellite data items, obtained in the microwave region of the electromagnetic spectrum (Singh et al., Citation2015; Xiao et al., Citation2019). Significant efforts have been made to procure goods soil moisture from satellite data in order to satisfy the community needs for worldwide reach (daily to weekly) at a higher temporal resolution (Kolassa et al., Citation2017). Banerjee & Kumar (Citation2018) identified and estimated trend in surface soil moisture by AMSR-E dataset in Godavari and Krishna river basins and found better correlation with rainfall. Thiruvengadam & Rao (Citation2016) analysed spatio-temporal dynamics of soil moisture in India and observed that soil moisture trend has dynamic pattern and positive correlation with the precipitation data.
The comparison between soil moisture and monsoon patterns in India usually followed rainfall patterns and very good agreement between in situ and soil moisture goods (Sathyanadh et al., Citation2016). The dynamic analysis of soil moisture over any region, country, or continent is an outdating task. Knowledge of existence soil moisture of a particular region creates awareness regarding various aspects such as drought, rainfall patterns, average annual rainfall, etc.
2. Materials and methods
2.1. Study area description
The Marathwada division of Maharashtra state, India, is selected for the present study (). It is bounded by Karnataka and Telangana states on the south-east side and lies to the east of Vidarbha and Khandesh regions of Maharashtra. Marathwada corresponds eight districts viz., Aurangabad, Jalna, Beed, Osmanabad, Nanded, Latur, Parbhani, and Hingoli with 76 tehsils located at 70°5′-78°5′ E longitude and 17°5′-20°5′ N latitude. The region has a population of about 1.87 crores and has geographical area of 64,590 km2, with only 57,000 km2 area suitable for agriculture. Of the total geographical area, the net sowing area contributes only 75%.
Figure 1. Study area of Marathwada division.

2.2. Data acquisition and software used
In the present study, AMSR-E/Aqua Daily L3 surface soil moisture, daily 25 km × 25 km (gridded) dataset has been used (https://nsidc.org/data/AE_Land3). The data product corresponds to a 56 km mean spatial resolution (). A passive microwave radiometer, AMSR-E (Advanced Microwave Scanning Radiometer for the Earth Observing System), is updated from ADEOS-II, the Advanced Earth Observing Satellite-II (Dong et al., Citation2006; E. Njoku, Citation1999). The sensor detects geophysical parameters of land surface, surface soil moisture, and vegetation water content. The sun-synchronous satellite functioned in polar orbits, with the equator passing through at 1:30 A.M. (descending) and 1:30 P.M. (ascending). As a result, the data attributed two files in a hierarchical data format (.hdf) as ascending and descending scenes.
Table 1. Specifications and properties of AMSR-E.
The Center for Hydrometeorology and Remote Sensing (CHRS) portal was used for extracting gridded rainfall data (Nguyen et al., Citation2019). The CHRS developed the PERSIANN-CDR which is Precipitation Estimation from Remotely Sensed Information using Artificial Neural Networks – Climate Data Record (http://apdrc.soest.hawaii.edu/datadoc/persiann_cdr.php). The output provides daily, monthly, and yearly rainfall estimated at 0.25º × 0.25º resolution. Rainfall product covers 60º S to 60º N globally. The data are available from January – 1983 to December – 2015. The PERSIANN algorithm is developed by modifying the monthly Global Precipitation Climatology Project (GPCP) product and GridSat-B1 infrared data (Ashouri et al., Citation2015; Levizzani et al., Citation2020). The R language was used for extraction and averaging of soil moisture data. Furthermore, the Q-GIS was used for analysis and visualization. It is free and open-source software.
2.2.1. Scientific rationale for soil moisture retrieval using passive microwave sensors
The radiometers which are referred as passive sensors generally detect the radiated energy. The Rayleigh-Jeans approximation of Planck’s law is the scientific principle that functions in the process of detection by the radiometers (Singh et al., Citation2015). The activity is driven by the electromagnetic emission of the black body at a given temperature of T (°K) as prescribed by Planck’s law.
Planck’s rule is known as Rayleigh-Jeans approximation for the black body, when it is estimated for f/T⋘ given by:
The tendency to absorb or release radiation is fairly determined by Kirchhoff’s law as follows,
Where, emissivity “ε” is the ratio of the emission between the object and the blackbody governed at the similar temperature. The emissivity relies upon various parameters such as polarization, angle of incidence, temperature, and the physical properties of the surface. The atmospheric attenuation and emission of signal are expressed as Eq. 3 for radiometers functioning in shorter wavelength ranges (Engman, Citation1991; E. G. Njoku et al., Citation2003; Sharma et al., Citation2018; Singh et al., Citation2015).
Here, TB, t(H), and “r” are the brightness temperature, atmospheric transmission, and surface reflectivity. Whereas, Tsky, Tsoil, and Tatm corresponded to the temperatures of sky, soil, and atmosphere respectively (Schmugge et al., Citation1992). For standard soil moisture applications using longer microwave wavelengths, the atmosphere is clear in most environmental conditions (t(H)~1 K) and Tsky is much less (~3.5 K); hence these terms can be neglected.
In above Eq. 4, represents the emissivity depending upon medium dielectric constant (Engman, Citation1991; Singh et al., Citation2015).
2.3. Preparation and pre-processing of the datasets
The current research mostly relies on the estimation of soil moisture through AMSR-E data product and retrieval of PERSIANN-CDR rainfall data from the CHRS Data Portal, which is available in the public domain. The study is conducted for three years (2003, 2004, and 2005) during rainy season (June to September). The flowchart of the overall methodology is represented in .
Figure 2. Flow chart illustrating overall methodology.
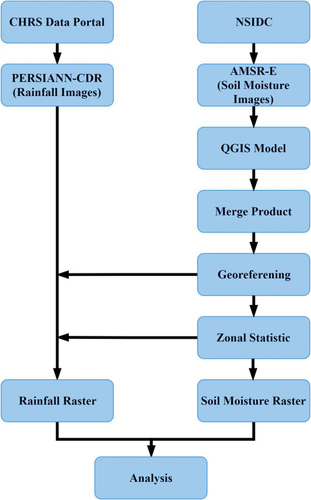
Initially, AMSR-E dataset is archived from NSIDC to obtain the value of soil moisture. The soil moisture data is accessible at 6.9 GHz for horizontal and vertical polarization in ascending and descending modes. The AMSR-E is a daily data generating a single file for each day. Therefore, 122 days of monsoon corresponded to a total of 244 Hierarchical Data Format (.hdf) files with both ascending and descending passes. The HDF format has to be converted to a compatible image format, specifically either in .img or .tiff for further processing. The downloaded soil moisture dataset comprises total of 135 rows and 175 columns with a total of 23,355 pixels (Singh et al., Citation2015). The measure of soil moisture is the signed integer value of 16 bit contributing to the single pixel. The ascending and descending soil moisture datasets provide a soil moisture at resolution of 10.7 GHz, and data in pixels varies between 0 and 500. Consequently, for soil moisture in g/cm3, the data values were multiplied by 0.001. Furthermore, it is multiplied by 100 to generate soil moisture maps in percentage (%).
The retrieval of surface soil moisture attribute from AMSR-E data is followed by conversion (from .hdf to .tiff) for further processing (Chakraborty et al., Citation2012). The averaging of data to create soil moisture map is primarily done in R language. In downloaded datasets, the ‘9999ʹ fill value is allocated for pixels that are void/null of any retrieval, where no data is recorded because of inherent differences between available swaths. represent the ascending and descending pass of a satellite from 1 to 7 July 2003. Both passes indicate that the entire study area (Marathwada divison) is not covered in a single pass.
Figure 3. Ascending pass scenes depicting swaths of soil moisture data of India recorded from 1 July 2003 to 7 July 2003.
Figure 4. Descending pass scenes depicting swaths of soil moisture data of India recorded from 1 July 2003 to 7 July 2003.
2.4. Retrieval of soil moisture from the AMSR-E data
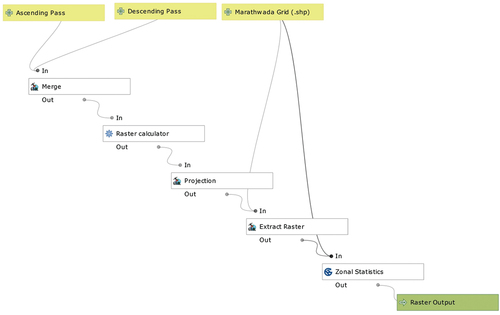
The Graphical modeler in processing plugin of Q-GIS is used for retrieval of soil moisture values by building model, as shown in . The merge attribute integrates ascending and descending separate dataset files of each day. The raster calculator is utilized to convert values in gm/cm3 into percent soil moisture. As the output raster has no Coordinate Reference System (CRS), it has given Source Reference System (SRS) as NSIDC EASE-Grid Global (EPSG: 3410) and is converted into target reference as WGS-84 (EPSG: 4326) using re-projecting. Lastly, enhancing the zonal statistics attribute and Marathwada grid shapefile, the mean statistic values of the pixels corresponding the raster layer is calculated. As a result, a daily raster of soil moisture gets generated.
Figure 5. Graphical modeler in QGIS for soil moisture raster formation.
2.5. Soil moisture map generation
Weekly, monthly, and seasonal maps are prepared, calculating its averages as per requirement.
2.5.1. Weekly average soil moisture map generation
Seven raster files were averaged using the developed R code, which gives a single output file as a weekly average soil moisture map. A total of 12 weekly average maps of July were composed for 2003, 2004, and 2005.
2.5.2. Monthly average soil moisture map generation
For the monthly average soil moisture map, a similar procedure explained earlier was incorporated for June, July, August, and September month of the year 2003, 2004, and 2005 to generate a single map for respective months depicting average soil moisture.
2.5.3. Seasonal average soil moisture map generation
To generate seasonal average soil moisture maps, 122 files considering June, July, August, and September month, are averaged using the similar code. The four months average monthly soil moisture maps for the year 2003, 2004, and 2005 generate final seasonal average soil moisture, which forms three seasons for the respective years.
2.6. Retrieval of rainfall data from PERSIANN-CDR
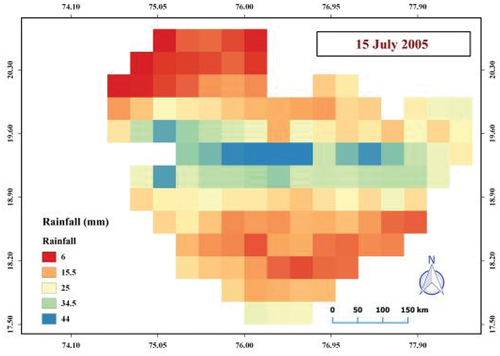
The PERSIANN is centered on geostationary longwave infrared imagery to generate global rainfall. Using a gridded shapefile of the study area and selecting the required date images were downloaded. The downloaded data is in Arc-Grid format as shown in . The map signified that the central part of Marathwada has good rainfall, whereas low rainfall along the northern region. This phenomenon is further explain in comparison to soil moisture.
Figure 6. Daily rainfall map for 15 July 2005.
3. Results and discussion
This study has been made an attempt to fulfil the primary objective of retrieving the soil moisture product of AMSR-E and do the spatial as well as temporal soil moisture variation analysis for a Marathwada region during monsoon season.
3.1. Spatial analysis of soil moisture
The variation of soil moisture in the Marathwada region is categorized into three types,
Good soil moisture – More than 18%
Moderate soil moisture – Between 10% to 18%
Poor soil moisture – Below 10%
The soil moisture is odd throughout the study area and didn’t follow a unique pattern. The variation in soil moisture content over the Marathwada division is primarily controlled by rainfall, seasons, and agricultural practices adopted by farmers. The overall soil moisture showed maximum variation utmost to 25%. The estimated soil moisture values might differ from observed soil moisture values due to the coarse resolution of the AMSR-E sensor of the order of 56 km, which is resampled to 25 km resolution.
demonstrated weekly soil moisture in July (2003, 2004, and 2005) for the Marathwada. The 1st week of July 2003, 2004, and 2005 observed poor soil moisture (6–12%) in the southern province of Marathwada, while moderate and good soil moisture (14–22%) was observed for the remaining area. The 2nd week of 2005 showed a drastic increase in moisture from moderate to a good condition that might be due to the onset of monsoon. The 3rd and 4th weeks of 2003 and 2004 resembled almost similar variation with a slight rise in soil moisture. In 2005 as proceeded sequentially from 2nd to 3rd and 3rd to 4th week, the soil moisture increased phenomenally with 4th week incorporating good soil moisture pattern over entire area.
Figure 7. Weekly average soil moisture for July (2003–2005).
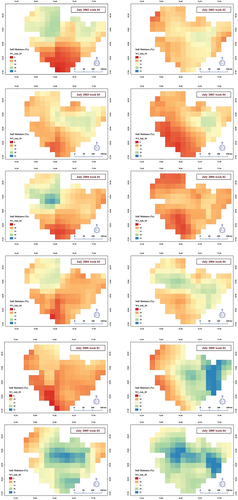
Overall it was envisioned that the soil moisture resembled similar variation in 2003 and 2004 with no major changes except the northern and central part of Marathwada. While in 2005, soil moisture in July consistently increased with maximum soil moisture observed in the 4th week of 2005.
3.1.1. Monthly soil moisture analysis
illustrated the month-wise spatial pattern in soil moisture in the Marathwada region from June to September, during 2003, 2004, and 2005. The data analysis revealed that for June (2003, 2004, and 2005), soil moisture was approximately less than 10% considering the total geographical area. The utmost area corresponded to soil moisture less than 6%, which specifies the area falling under poor soil moisture condition. The spatial maps derived for July indicated fairly good soil moisture during the year 2005, followed by 2004 and 2003. The majority portion of the study area in July 2005 showed moderate and good soil moisture (18–22%). The August month corresponded a similar trend in soil moisture variation as July for all three years. The south-east region had a slight edge and better soil moisture (10–18%) as compared to the overall study area for August 2003, 2004, and 2005. The variation for September 2003, revealed poor soil moisture (6–10%), whereas poor and moderate soil moisture during 2004. During September 2005, the soil moisture was moderate and varied in the range of 10–14%.
Figure 8. Monthly average soil moisture for June – September (2003–2005).
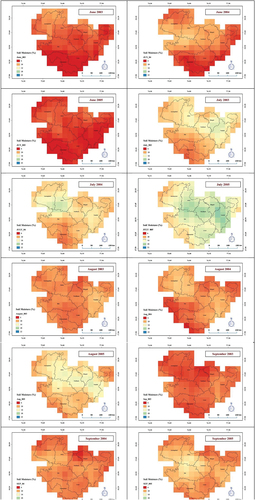
From the overall monthly soil moisture maps, it was analysed that the entire southern and northern regions of Marathwada fall under poor soil moisture except the July month of 2003, 2004, 2005, and August 2005. Extreme poor soil moisture was recorded in June 2005, as compared to the other maps of various months. The June and September months had the least soil moisture as compared to July and August months. The July month had maximum soil moisture as compared to June, August, and September in 2003, 2004, and 2005 that might be due to the initiation of rainfall.
3.1.2. Seasonal soil moisture analysis
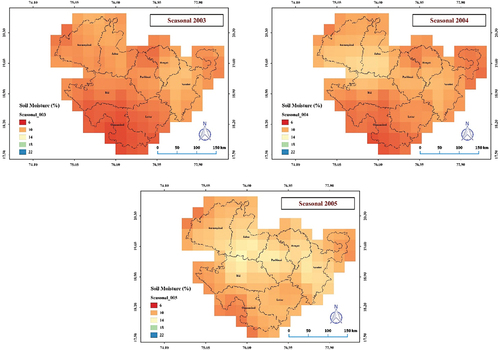
depicts seasonal soil moisture variation from June to September during 2003, 2004, and 2005. It was noticed that soil moisture pattern showed an increasing trend from 2003 to 2005. The southern region of Marathwada had minimum soil moisture as compared to the rest of the area for 2003 and 2004. In 2005 the entire study area had moderate soil moisture (10–14%), which contributes to the fact that year 2005 had appreciable rainfall followed by 2004 and 2003.
Figure 9. Seasonal soil moisture (2003–2005).
3.2. Temporal analysis of soil moisture with rainfall
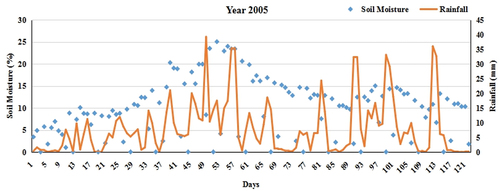
Time series plot depicts merged soil moisture with seasonal rainfall for the study area during year 2005 (). The illustrated graph demonstrates that rainfall patterns had a direct impact on soil moisture variation, i.e., with an increment in rainfall, there is a significant increase in soil moisture. During the onset of monsoon, soil moisture is 4%, and it increases by 21% as rainfall reaches its peak rate. In June, due to the initiation of rainfall soil moisture is minimum. With an increase in rainfall from 13th June to 19th July, soil moisture gradually rose by 15%. Later from 19th July to 28th August, rainfall decreased from 40 mm to 3 mm, which eventually leads to a decline in soil moisture by 16%. Hence, it was remarked that soil moisture and rainfall follows an identical behavior.
Figure 10. Soil moisture variation with time and rainfall from (June – September) in 2005.
4. Conclusions
The soil moisture derived from AMSR-E product was used to analyze variation in Marathwada region for the monsoon season of 2003, 2004, and 2005. It was observed that the soil moisture patterns were highly dynamic and AMSR-E-derived soil moisture will help to figure out drought and flooding conditions. Amongst the three years, the maximum soil moisture was observed in 2005 which is 25%, whereas minimum soil moisture was envisioned for 2003 (1%). The weekly soil moisture maps of July specified that the southwest region of Marathwada is always in poor soil moisture conditions. The monthly soil moisture maps conclude the least soil moisture in June and September as compared to July and August month. The southern and northwest province of the study area falls under poor soil moisture conditions as compared to the eastern and central parts. The seasonal soil moisture maps foretell least soil moisture in 2003 covering 60% of total area whereas, moderate soil moisture in 2005 which covers 80% of the study area for the Marathwada region in accordance to 2003, 2004, 2005.
For the accuracy purpose, the estimated soil moisture should be cross-verified with ground truth soil moisture data. It should be reanalyzed with land use land cover for soil moisture utilization and the percentage of errors should be counted in accordance to ground truth and land use land cover. The AMSR-E sensor has the coarse resolution. Due to this reason, it is difficult to get pure pixels in agricultural areas. This can be overcome by incorporating vegetation/roughness parameters in the AMSR-E sensor.
One of the key benefits of the proposed methodology is that a user can produce average soil moisture maps at chosen intervals viz., weekly/monthly/seasonally/yearly, etc.; this could substantially reduce the time and effort of managers and decision makers. Monthly soil moisture maps produced using the suggested approach successfully explain seasonal fluctuation in soil moisture. The similar procedure can be incorporated in the analysis of different parameters of AMSR E sensor viz., precipitation rate, cloud water, water vapor, sea surface winds, sea surface temperature, ice, and snow in global context.
Acknowledgments
We are extremely thankful to NSIDC for providing Aqua AMSR-E soil moisture data and CHRS for providing PERSIANN-CDR rainfall data free of cost. We appreciate the editors and the reviewers for their constructive suggestions and insightful comments, which helped us greatly to improve this manuscript.
Disclosure statement
The authors declare that they have no known competing financial interests or personal relationships that could have appeared to influence the work reported in this paper.
References
- Ashouri, H., Hsu, K. L., Sorooshian, S., Braithwaite, D. K., Knapp, K. R., Cecil, L. D., & Prat, O. P. (2015). PERSIANN-CDR: Daily precipitation climate data record from multisatellite observations for hydrological and climate studies. Bulletin of the American Meteorological Society, 96(1), 69–83. https://doi.org/10.1175/BAMS-D-13-00068.1
- Banerjee, C., & Kumar, D. N. (2018). Assessment of surface water storage trends for increasing groundwater areas in India. Journal of Hydrology, 562, 780–788. https://doi.org/10.1016/j.jhydrol.2018.05.052
- Berwal, P., Murthy, C. S., Raju, P. V., & Sesha Sai, M. V. R. (2016). Geospatial analysis of near-surface soil moisture time series data over Indian Region. International Archives of the Photogrammetry, Remote Sensing and Spatial Information Sciences - ISPRS Archives, 41(July), 631–637. https://doi.org/10.5194/isprsarchives-XLI-B7-631-2016
- Chakraborty, A., Sai, M. V. R. S., Murthya, C. S., Roy, P. S., & Behera, G. (2012). Assessment of area favourable for crop sowing using AMSR-E derived soil moisture index (AMSR-E SMI). International Journal of Applied Earth Observation and Geoinformation, 18(1), 537–547. https://doi.org/10.1016/j.jag.2011.10.006
- Dong, S., Gille, S., Sprintall, J., & Gentemann, C. (2006). Validation of the advanced microwave scanning radiometer for theearth observing system (AMSR-E) sea surface temperature in theSouthern Ocean. Journal of Geophysical Research: Oceans, 111(C4), 4. https://doi.org/10.1029/2005JC002934
- Engman, E. T. (1991). Applications of microwave remote sensing of soil moisture for water resources and agriculture. Remote Sensing of Envirnoment, 35(2–3), 213–226. https://doi.org/10.1016/0034-4257(91)90013-V
- Karthikeyan, L., & Kumar, D. N. (2014). Validation of satellite soil moisture retrievals using precipitation records in India. International Archives of Photogrammetry, Remote Sensing and Spatial Information Sciences, 40(8), 367–370. https://doi.org/10.5194/isprsarchives-XL-8-367-2014
- Kingra, P. K., Majumder, D., & Singh, S. P. (2016). Application of remote sensing and GIS in agriculture and natural resource management under changing climatic conditions. Agricultural Research Journal, 53(3), 295–302. https://doi.org/10.5958/2395-146X.2016.00058.2
- Kolassa, J., Gentine, P., Prigent, C., Aires, F., & Alemohammad, S. H. (2017). Soil moisture retrieval from AMSR-E and ASCAT microwave observation synergy. Part 2: Product evaluation. Remote Sensing of Environment, 195, 202–217. https://doi.org/10.1016/j.rse.2017.04.020
- Levizzani, V., Kidd, C., Kirschbaum, D. B., Kummerow, C. D., Nakamura, K., & Turk, F. J. (2020). PERSIANN-CDR for hydrology and hydro-climatic applications. Advances in Global Change Research, 69(April), 993–1012. https://doi.org/10.1007/978-3-030-35798-6_26
- Nguyen, P., Shearer, E. J., Tran, H., Ombadi, M., Hayatbini, N., Palacios, T., Huynh, P., Braithwaite, D., Updegraff, G., Hsu, K., Kuligowski, B., Logan, W. S., & Sorooshian, S. (2019). The CHRS data portal, an easily accessible public repository for PERSIANN global satellite precipitation data. Scientific Data, 6,1-10. https://doi.org/10.1038/sdata.2018.296
- Njoku, E. (1999). AMSR land surface parameters. Algorithm theoretical basis document, Version 3., Jet Propulsion Laboratory California, Institute of Technology Pasadena, CA. http://macaque.colorado.edu/data/amsre/pdfs/amsr_atbd_land.pdf
- Njoku, E. G., Jackson, T. J., Lakshmi, V., Chan, T. K., & Nghiem, S. V. (2003). Soil moisture retrieval from AMSR-E. IEEE Transactions on Geoscience and Remote Sensing, 41(2 PART 1), 215–229. https://doi.org/10.1109/tgrs.2002.808243
- Sathyanadh, A., Karipot, A., Ranalkar, M., & Prabhakaran, T. (2016). Evaluation of soil moisture data products over Indian region and analysis of spatio-temporal characteristics with respect to monsoon rainfall. Journal of Hydrology, 542, 47–62. https://doi.org/10.1016/j.jhydrol.2016.08.040
- Schmugge, T., Jackson, T. J., Kustas, W. P., & Wang, J. R. (1992). Passive microwave remote sensing of soil moisture: Results from HAPEX, FIFE and MONSOON 90. ISPRS Journal of Photogrammetry and Remote Sensing, 47(2), 127–143. https://doi.org/10.1016/0924-2716(92)90029-9
- Sharma, P., Kumar, D., & Srivastava, H. S. (2018). Assessment of different methods for soil moisture estimation: A review. Journal of Remote Sensing & GIS, 9(1), 57–73. https://www.researchgate.net/publication/325568808_Assessment_of_Different_Methods_for_Soil_Moisture_Estimation_A_Review.
- Singh, G., Srivastava, H. S., Mesapam, S., & Patel, P. (2015). Passive microwave remote sensing of soil moisture: A step-by-step detailed methodology using AMSR-E data over indian sub-continent. International Journal of Advanced Remote Sensing and GIS, 4(1), 1045–1063. https://doi.org/10.23953/cloud.ijarsg.133
- Suri, A. (2013). Blending approach for soil moisture retrieval using microwave remote sensing [Master Thesis]. Andhra University. https://www.iirs.gov.in/M.Tech2011–2013
- Thiruvengadam, P., & Rao, Y. S. (2016). Spatio-temporal variation of soil moisture and drought monitoring using passive microwave remote sensing. International Geoscience and Remote Sensing Symposium (IGARSS), 3126–3129. https://doi.org/10.1109/IGARSS.2016.7729808
- Xiao, J., Chevallier, F., Gomez, C., Guanter, L., Hicke, J. A., Huete, A. R., etIchiig, K., Nih, W., Pangi, Y., Rahmanj, A. F., Sunk, G., Yuanl, W., Zhangm, L., Zhang, X. (2019). Remote sensing of the terrestrial carbon cycle: A review of advances over 50 years. Remote Sensing of Environment, 233(January). https://doi.org/10.1016/j.rse.2019.111383.