
 ?Mathematical formulae have been encoded as MathML and are displayed in this HTML version using MathJax in order to improve their display. Uncheck the box to turn MathJax off. This feature requires Javascript. Click on a formula to zoom.
ABSTRACT
This study investigated groundwater potential in the Western escarpment of the Ethiopian Rift valley, taking Dijo catchment as a case study, an area that is known for its critical shortage of water. Different thematic layers were used to determine the groundwater potential of the catchment. PCI Geomatica and Rockwork were used to automatically extract lineament and lineament orientation, respectively. Weights of parameters were computed using the analytical hierarchy process (AHP). Rank was assigned to each feature class for each thematic map according to their characteristics and interrelationship with groundwater. Once the mapping was done, validation of the estimated result was done. Accordingly, the result indicates that there is a matching between the analysis results and samples taken from boreholes with an accuracy result of 79.2%. The results revealed that nearly half of the catchment was found to have high-to-very-high groundwater potential while the remaining exhibiting limited potential for groundwater. Despite the high potential, there is a critical shortage of water. This is partly attributed to poor planning and limited capacity in identifying water resource potential. Thus, we suggest that efforts should be made to exploit the available water resources thereby to solve the societal problem.
1. Introduction
Groundwater is the stored under the surface of the ground in the tiny pore spaces between rock, sand, soil, and gravel. It occurs in two “zones”: an upper, unsaturated zone where most of the pore spaces are filled with air, and a deeper, saturated zone in which all the pore spaces are filled with water. The water table may be a few feet or many hundreds of feet below the ground surface (FAO, Citation2016; Harter, Citation2003). The occurrence of groundwater at any place on the earth is not a matter of chance but a consequence of the interaction of the climatic, geological, hydrological, physiographical, and ecological factors. It has been estimated that of the total freshwater resources, groundwater accounts for 94%; lakes, reservoirs, and river channels for 4%; and soil moisture for 2% (Uhl et al., Citation2009). Groundwater exploration operation is essentially a hydro-geological and geophysical inference operation and is dependent on the correct interpretation of the hydrological indicators and evidences (Biswas et al., Citation2012).
A recent study by MacDonald et al. (Citation2012) indicates that Africa has substantial groundwater storage. They estimated that the annual groundwater storage in Africa is 100 times more than the annual renewable freshwater resources and 20 times the freshwater stored in African lakes. Ethiopia is also considered as the “water tower of Africa.” Despite this fact, the majority of its people are suffering from shortage of water for different purposes such as domestic consumption, industry, and irrigation. This could emanate from poor planning and limited knowledge in identifying the water resource potentials of the country.
Groundwater will remain the ultimate source of freshwater while surface water sources have been depleted. Groundwater is more suitable for irrigation than surface water since it has a slow response to climate variability and requires less treatment (Siebert et al., Citation2010). Much progress has been achieved in using groundwater for cultivation in Asia (Siebert et al., Citation2010). Use of groundwater for irrigation has significantly affected agricultural growth in Asia, for example, especially after the green revolution. Groundwater plays a critical role to support agricultural industry (Altchenko & Villholth, Citation2014; Giordano, Citation2006). However, in Africa, groundwater is less utilized resource. For example, in Ethiopia, groundwater is not adequately used due to higher development and operational cost and lack of understanding of the resource dynamics (Awulachew et al., Citation2010). The groundwater in Ethiopia is mainly used for domestic use. There were limited cases where the groundwater has been used for irrigation and other purpose, and there is little quantitative study ongroundwater resource potential for irrigation and other nondomestic uses (MacDonald et al., Citation2012).
Several methods such as geological, hydrogeological, geophysical, seismic, and spatial techniques have been used for analyzing suitable site for groundwater potential before a borehole can be drilled. Unfortunately, some of these techniques tend to be rather too expensive and cannot be carried out easily. Thus, use of spatial technology, however, has helped to develop an approach for groundwater studies (Abdullahi et al., Citation2013; Kumar et al., Citation2014).
Geospatial technologies have become important tools these days in water studies due to their capability in developing spatio-temporal information and effectiveness in spatial data analysis and prediction (Magesh et al., Citation2012). It is more applicable in groundwater potential zone identification and demarcation (Ramamoorthy & Rammohan, Citation2015; Waikar & Nilawar, Citation2014) by making use of the multi-criteria decision-making analysis (MCDA). The MCDMA combines qualitative and quantitative approaches (Saaty & Vargas, Citation2012). Remote-sensing not only provides a wide-range scale of the space-time distribution of observations but also saves time and money.
In Ethiopia, some researchers have conducted studies on groundwater potential using GIS and remote-sensing techniques and investigated potential zones on groundwater within their study area. For instance, studies conducted in Middle Awash River Basins by Bashe (Citation2017), Gerado River, in the Northern Ethiopia by Hussein et al. (Citation2017); and on Bilate River Catchment, South Rift Valley of Ethiopia by Gintamo, (Citation2014) are among those research addressing the water resource potential in the country.
The Dijo catchment which is located in the western escarpment of the Ethiopian Rift Valley is a source of water for rift valley basin. The main river, Dijo, originates from the tip of the escarpment and draining the rift floor is an intermittent one. The catchment is mostly inhabited by agrarian society who heavily depends on rain-fed agriculture despite the presence of high potential for irrigable land and groundwater. Critical shortage of water for domestic use is a defining feature of the catchment although the availability of groundwater potential. Rain is sporadic and variable in the catchment. Consequently, rain-based agricultural production is not reliable. Thus, exploring groundwater potential zones is one of the best mechanisms for identifying and developing water that can be used for irrigation, domestic use, drinking, and industrialization in the study area. Groundwater potential zone of Upper Dijo catchment has not been well studied even using costly and time-consuming methods based on geophysics, geology, hydro geology, and Seismic. Thus, GIS and remote-sensing techniques could help fill the knowledge and information gap by analyzing groundwater potential of the study area.
The purpose of the study was to analyze groundwater potential zone of Dijo river catchment using GIS and remote-sensing techniques. To attain this purpose, thematic layers of parameters that influence groundwater potential such as lithology, geomorphology/landform, drainage density, lineament density, rainfall, soil, slope, land use land cover and elevation were considered in this study. While groundwater potential zone was generated using weight overlay analysis and Analytical Hierarchy Process (AHP) algorithm as adopted by Bashe (Citation2017).
2. Materials and methods
2.1. Description of the study area
This study is conducted in the Western escarpment of the Rift Valley System, specifically in the Upper Catchment of Dijo River, Southern Ethiopia (see ). Its absolute location is between 7°34ʹ – 8°02ʹ North latitudes and 38°02ʹ-38°20ʹ East longitudes, with a total area of 765 square kilometers. Elevation of the area ranges from 1761 to 3192 m above sea level. The mean monthly rainfall ranges between 42 and 120 mm and has mean annual rainfall of 1039 mm. The mean maximum and minimum annual temperature of the catchment is 25.74°c and 11.43°c, respectively.
Figure 1. Location map of the study area.
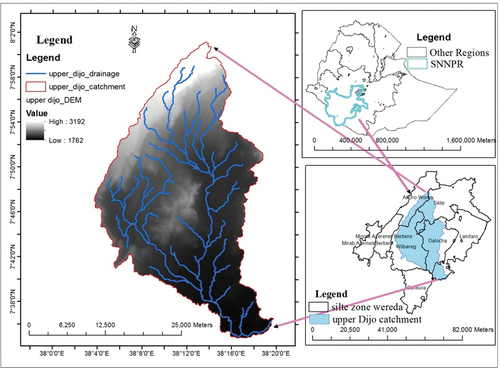
The area is characterized by several small intermittent streams that originate from the northern edge of the Upper Dijo Catchment. Among the major streams that contribute to Upper Dijo River include Demgerne, Kalid, Chirchiro, Limazo, and Furfuro rivers. Also there are many intermittent rivers that contribute to the Upper Dijo River. However, all of the rivers dry during summer season and flows only during winter seasons. This upper Dijo River flows toward Shalla Lake, which is located far south of the study area.
2.2. Methods
In this study, nine parameters such as rainfall, soil, lithology, lineament, land use/cover, slope, drainage density, soil texture, and geomorphology were used to determine the groundwater potential. Thematic maps were prepared for each parameter and used to examine the groundwater potential of the study area.
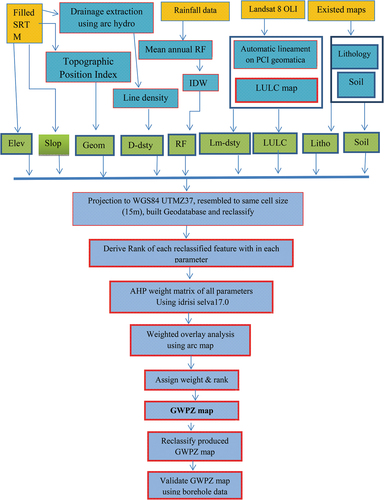
This study involved relational analysis between variables that used to predict groundwater potential during weight calculation and groundwater potential itself during ranking throughout. illustrates the flowchart of the study.
Figure 2. Methodological flowchart of the study.
2.2.1. Methods for extraction of parameters
a. Rainfall
Rainfall is the major hydrological source of groundwater storage and also determines its fluctuation (Agarwal et al., Citation2013; Magesh et al., Citation2012). The higher the rainfall intensity, the higher would be the groundwater recharge and vice-versa (Das & Mukhopadhyay, Citation2020,). IDW interpolation method was used to generate mean annual rainfall spatial data of the study area and reclassified into five categories quantity based on the value using natural break (Kumar et al.,, Citation2017;Jenks, Citation1967).
b. Slope
Slope plays a crucial role in groundwater potential mapping (Biswas et al., Citation2012). It determines surface runoff and vertical percolation of water; hence, it affects groundwater recharge processes (Adiat et al., Citation2012; Kumar et al., Citation2014). Infiltration was inversely related to slope (Yeh et al., Citation2014; Rahmati et al., Citation2015; Mukhopadhyay, 2018). Shuttle Radar Topography Missions (SRTM) 30 m resolution digital elevation model (DEM) was used to generate slope map. The slope map was classified into six classes based on FAO classification standard (Sheng, Citation1990).
c. Drainage density
Drainage density (DD) is an inverse function of permeability (Agarwal et al., Citation2013; Chowdhury et al., Citation2009; Magesh et al., Citation2012) and it is taken as an important parameter to delineate groundwater potential zone. A DD was calculated in each of the grid square using following equation (Murthy, Citation2000)
where DD: Drainage density; SL: stream length and A: Area of the catchment
As adopted from Bashe (Citation2017), drainage of the catchment was generated using SRTM DEM 30 m data through consecutive steps. Then, the stream order was defined using Strahaler Stream Order Method. The DD was prepared using ArcGIS spatial analyst line density tool by using polyline stream as an input. Then, drainage density was classified into five classes using equal interval based on their density adopted from Kumar et al (Citation2017).
d. Soil texture
The type of soil texture present in an area has a great impact on the availability of groundwater (Kudamnya & Andongma, Citation2017). Highly porous soils allow easy percolation and infiltration of surface water into the subsurface, and this is ideal for a favourable groundwater potential. Soil properties influence the relationship between runoff and infiltration rates, which in turn control the degree of permeability. As adopted from Argaz et al. (Citation2019), soil texture raster data of the Upper Dijo Catchment was obtained by HWSD (harmonized world soil data base) Version 1.2 at 900 m resolution.
e. Land use/cover
Land use/cover map is one among important governing factors to identify groundwater recharge potential regions (Chuma et al., Citation2013; Kirubakaran et al., Citation2016; Yeh et al., , Citation2016;and; Gadrani et al., Citation2018). Hydrological actions such as evapotranspiration, surface runoff, and infiltration are affected by land use/cover. Areas with vegetation cover have high groundwater potential than built-up areas that inhibits the infiltration of water into the subsurface (Adwumi, Citation2017). From land use classes, built-up area has the lowest weight compared to other classes and crop land has the highest weight (Nair & Babu, Citation2015). Finally, LULC map was produced using maximum-likelihood algorithm of supervised classification. Accuracy assessment was performed to check the accuracy of the classification.
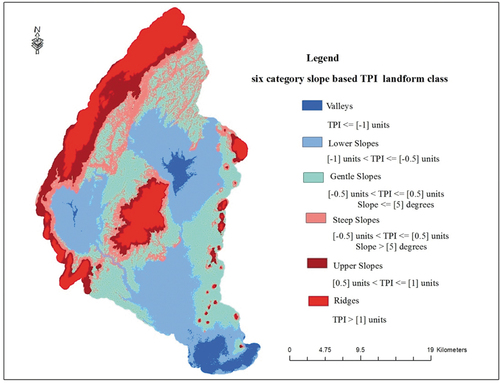
f. Geomorphology
Geomorphology map indicates landforms relating to groundwater occurrence as well as to groundwater prospects. Landform units were identified from DEM (SRTM) (Gintamo, Citation2014; Ibrahim-Bathis & Ahmed, Citation2016). Groundwater potential is expected to be very high in the vicinity of higher order streams that coincide with lower slope landform class (Dinesan, Citation2015).
Geomorphology of Upper Dijo Catchment was generated from SRTM30 DEM using Land Facet corridor ArcGIS extension, which is freely downloaded from ESRI website. Six landform classes were generated using Topographic Position Index (TPI) dataset of six category slope position parameter tool. Annulus type of neighbourhood with ([Inner Radius = 50 cells, Outer Radius = 350 cells] and Standardized elevation type of Topographic Position Index (TPI) were used. In terms of TPI in standard deviation, threshold values, namely, −1, −0.5, +0.5, +1 and, in terms of slope threshold values <5° and >5° were used.
Hill is a landform that extends above the surrounding terrain that incorporated with the ridge landform class (Adwumi & Anifowose, Citation2017). Weiss (Citation2001) generates landform classes using Topographic Position Index (TPI) method and used SRTM DEM 30 m as input data. The Topographic Position Index (TPI) compares the elevation of each cell in a DEM to the mean elevation of a specified neighbourhood around that cell (Andrew, 2011). Positive TPI values represent locations that are higher than the average of their surroundings, as defined by the neighbourhood (ridges). Negative TPI values represent locations that are lower than their surroundings (valleys). TPI values near zero are either flat areas (where the slope is near zero) or areas of constant slope (Weiss, Citation2001).
g. Lithology
Lithology is a very important aspect in predicting groundwater potential zones (Biswas et al., Citation2012; Ramamoorthy & Rammohan, Citation2015). Lithological properties determine porosity and the movement of groundwater (Chowdhury et al., Citation2010). Higher porosity of lithological material contributes to higher groundwater storage and higher permeability, which in turn contributes to higher groundwater yields.
Lithological maps were produced from two different geological maps with sheet number NC 37–10; Hosanna NC 37–14:Akkaki. The lithological features were digitized by creating new shape file polygon and built topology and it was converted into raster for the purpose of overlay analysis using polygon to raster conversion tool.
h. Lineament density
Lineaments are straight or curvilinear feature visible at the earth’s surface as a significant “Lines of landscape” (Kumar et al., Citation2014). Most of the geological linear features are assumed to be the zone of fractured bed rocks and the position of porous and permeable state where enhanced well yields can be expected (Meijerink et al., Citation2007). The main advantages of automatic lineament extraction method over the manual lineament extraction are its ability to uniform approach to different images; processing operations are performed in a short time and its ability to extract lineaments which are not recognized by the human eyes (Mustafa, 2014). Lineament of Upper Dijo Catchment was extracted automatically from Landsat 8 OLI and TIRS satellite images by using the line module control panel tool of PCI Geomatica 2018 Software. According to Yeh et al., (Citation2014) a lineament density represents the total length of lineaments in a unit area.
where LC is total length of lineament within the catchment and
AC is total area of the catchment.
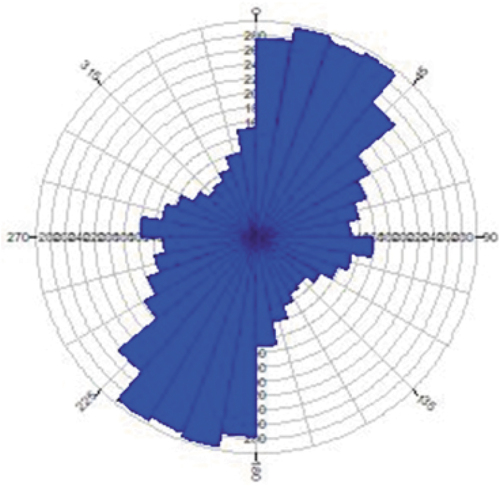
Lineament density map of Upper Dijo Catchment was generated by using Line density tool of ArcGIS spatial analysis. Then lineament density map was reclassified using equal interval method as adopted by Hsin-Fu (2014). Producing lineament direction was important to identify groundwater movement direction within the catchment. Orientation of lineament is usually analyzed by rose diagram. These diagram displays frequency of lineaments for regular intervals at 15 degree. Rose diagram that shows lineament orientation of Upper Dijo Catchment was generated using Rockwork software.
i. Elevation
Groundwater moves from higher elevation to lower elevation and from location of higher pressure to location of lower pressure except for minor surface irregularities. The depth to water table is greater along the divide (ridge) between streams than it is beneath a flood plain (Argaz et al., Citation2019; Harter, Citation2003; Kudamnya & Andongma, Citation2017). In order to establish relationship between elevation and ground water potential, we have used Shuttle Radar Topography Missions (SRTM) 30-m resolution digital elevation model (DEM).
2.2.2. Weight computation using AHP and spatial overlay analysis
The first step in an AHP analysis is to build a hierarchy to make the decision easy. This is also called decision modeling, and it consists of building a hierarchy to analyze the decision.
It was first suggested by Wind and Saaty (Citation1980) and called Analytic Hierarchy Process (AHP), a type of MCDA. This method allows us to determine the weights (significances) of hierarchically non-structured or particular hierarchical level criteria in respect of those belonging to a higher level. To perform the pair-wise computation, matrix of the parameters was involved in the analysis using IDRISI Selva 17.0 Package. It indicates whether one criterion is more significant than the other or less important than the other and at given level of priority.
The judged numeric values that assigned in IDRISI Package were derived from expert judgment and some geologist within the field were involved while giving values based on hydro-geological characteristics of terrain of the study area. Due to this reason, it was impossible to avoid some inconsistencies in the final matrix of judgments.
In AHP, the consistency ratio is defined as CR where CR = CI/RI.
Saaty and Vargas (Citation2012) have shown that a consistency ratio (CR) of 0.10 or less is acceptable to continue the AHP analysis. If the consistency ratio was greater than 0.10, it is necessary to revise the judgments to locate the cause of the inconsistency and re-correct it.
where
λ is max the Principal Eigen value of the pair-wise comparison matrix;
n is the number of parameters involved in the comparison (n = 9). Saaty and Vargas (Citation2012) provide the calculated RI value for matrices of different parameter sizes as below.
CR (random consistency value of) of nine criteria that are corresponding to CR value with 1.45 was used as shown in .
Table 1. Consistency ratio index (CRI) value of different parameter size.
2.2.3. Normalized weights of features of thematic layers by using ranking method
Inverse ranking and straight ranking can be used to rank features (Yahaya et al., Citation2010). In this study, inverse ranking was used. According to inverse ranking method, rating 1 to 9 was adapted where lowest rank was assigned to least important feature class (poor groundwater potential) and highest rank was assigned to most important feature class (very high groundwater potential), respectively. Weighted overlay analysis was performed after checking the consistency of the weight of each parameters and assigning rank to each parameter (Kumar et al., Citation2014).
2.2.4. Weighted overlay analysis
The groundwater potential zones were produced by overlaying all nine thematic maps of parameters using weighed linear combination (WLC) formula (Agarwal et al., Citation2013; Kumar et al., Citation2014).
where
Subscript integers = normalized weight of thematic layer, wi = normalized rank of each feature and Sl = slope, Dd = drainage density, Ld = lineament density, Gg = geomorphology, Lulc = land use land cover, Rf = annual mean rainfall, Lt = lithology, So = soil, El = elevation.
Finally, the result of the analysis was validated by overlaying borehole yield data that were collected from the study area on predicted groundwater potential zone map.
where AB is total borehole agreed with predicted map and
TB is total borehole in the catchment.
3. Results and discussion
3.1. Parameters characterization
Important parameters that influence groundwater potential of the Upper Dijo Catchment were identified and characterized to determine the groundwater potential of the study area. Details of the characterization are presented in the subsequent sub-sections.
3.1.1. Rainfall and slope
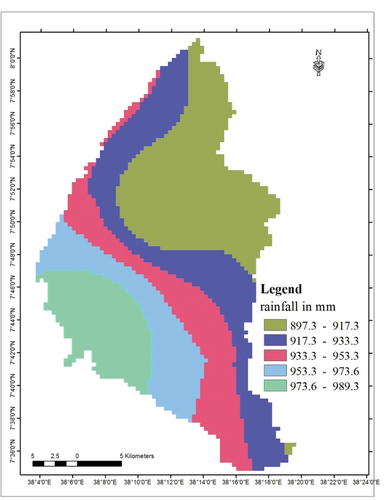
As indicated in , the annual rainfall was categorized into five classes: very high (973.6–989.3 mm), high (953.3–973.3 mm), moderate (933.3–953.3 mm), low (917.7. – 953.3 mm), and very low (897.3–917.3 mm). Rainfall generally decreases from west to east and similar to elevation, with annual rainfall varying between 897 mm and 989 mm.
Figure 3. Rainfall map of the study area.
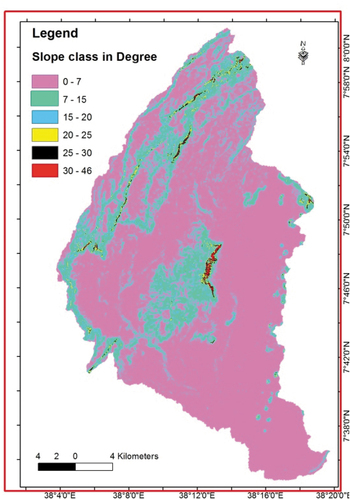
The slope of Upper Dijo Catchment ranges from 0º to 46º and categorized into six groups such as flat to gently sloping, moderately sloping, strongly sloping, very strongly sloping, steep and very steep slopping ().
Figure 4. Slope map of the study area.
3.2. 2. Drainage density
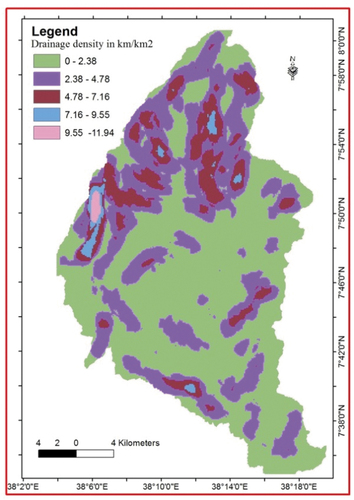
Three drainage patterns were identified. These include rectangular, radial, and dendritic type and the stream order of the catchment reaches sixth order based on Strahaler Stream Ordering Method. The computed drainage density of the catchment ranges from 0 to 11.94 km/km2(). For the sake of ranking the computed value, we have categorized the drainage density into five classes as indicated in . Due to the inverse relationship between drainage density and groundwater potential, highest weight was assigned to low drainage density and vice versa.
Figure 5. Strahaler Stream order.
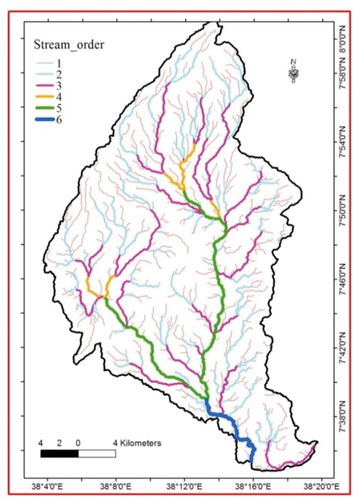
Figure 6. Drainage density map of the study area.
3.2.3. Soil texture and land use/land cover
Soil texture is an important parameter for the identification of groundwater potential zone. Upper Dijo Catchment consists of four major soil textural groups, such as clay (light), loam, sandy clay loam, and sandy loam. Bottom (outlet) of the catchment is covered by sandy loam soil texture (). Due to their difference in infiltration and porosity, weight of soil texture is assigned on the basis of their infiltration rate.
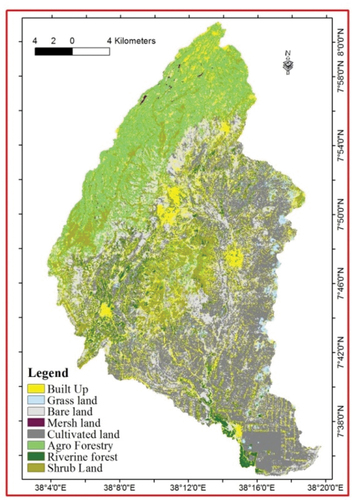
Eight land use/land cover types were identified in the study area (). These LULC classes were marshy land, cultivated land, riverine forest land, agroforestry land, shrub land, grass-land, bare land, and built-up. Riverine forest and marshy land has the highest recharge potential and hence has highest weight compared with the others. Regarding the areal coverage, cultivated land has the greater areal coverage in Southern most part of the area and agroforestry has the highest coverage in north-west of Upper Dijo Catchment.
Figure 7. Soil texture map of study area.
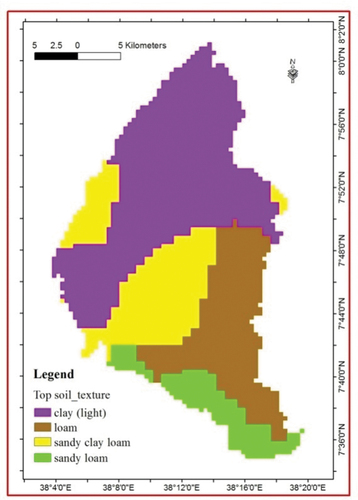
Figure 8. Land use/land cover map of study area.
3.2.4. Geomorphology/landform of the study area
Six types of geomorphologic features were identified in the study area, namely, valley, lower slopes, gentle slopes, steep slopes, upper slopes, and ridge (hills) (). Most of the study area is covered with ridges, gentle slopes, and lower slopes. Lower slope was observed along drainage channels and thus it has high ground water recharge. Valley was identified around central north, and south of the study area (outlet of the catchment). Steep slopes were found along lower portion of Alicho escarpment, Gafat Hill and some small hills around south-east of the catchment. Upper slopes landforms found around middle part of Alicho escarpment, middle part of Gafat hill and middle part of some small hills around south-east of the catchment. Ridge landforms were seen around top of Alicho escarpment, top of Gafat hill and top of some small hills. These ridge landforms include hill features that have poor groundwater recharge potential.
Figure 9. Geomorphology/Landform map.
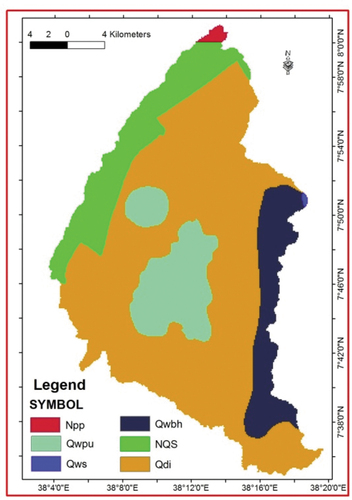
3.2.5. Lithology
a. Dino formation (Qdi)
Dino formation covers a considerable portion of the rift floor of the area and almost most central part of north west and south west of the study area are represented by Ignimbrite, Tuff, water lain pyroclastic, lacustrine (Qdi) reaching thickness of 250 m. The eruption of these pyroclastic was possibly related to the formation of Gigantic Calderas (Fentaw & Manaye, Citation2019). Borehole drilling report of Burka Dilapa and Diladate that falls under (Qdi) lithological category in Dalocha district, the major aquifers were weather Ignimbrite, Recent Basalt, Ignimbrite with Scoria, and Scoria with the yield of 20 L/s and 10.5 L/s, respectively.
b. Basalts of the rift floor (Qwbh)
Recent basalts (Qwbh) are prevalent in the north-west and south-west of Dalocha town and west of Mito town. Recent flows in many cases follow depressions of relief or flow over fault escarpment. This lithological group locates around EEN to SSE on upper Dijo catchment and there is no bore hole drilled on this group.
c. Nazret group and Dino formation undifferentiated (NQS)
In the study area, this lithological group was found at north-west edge of the study area. There is no bore hole drilled along this lithological group in upper Dijo catchment.
d. Central volcanic complexes (Qws, Qwi, and Qwpu)
In some centers, alkaline and per-alkaline products are mainly represented by pumice and unwelded tuffs (Qwpu), the latter usually marking the latest stages of volcanic activity. In some centers, for example, north-west of the study area early products are fiamme or other ignimbrites (Qwi). In several volcanoes in the area where ignimbrites, rhyolites and unwelded tuffs were mapped together, they are shown in the map as per alkaline silicics undifferentiated (Qws).
e. Welded to partially welded pyroclastic flows (Npp)
Edo2 Bore hole drilling data show that lithology of this category was clay, yellow clay, black clay, and very small thickness of weathered ignimbrite, and so there were no good aquifers rather than Aquitards. As the result, the bore hole was abundant at 0 L/s yield. To verify recharge potential of geology alluvial deposits, volcano, sedimentary rocks, recent basalts, and lacustrine sediments were assigned highest weight due to their higher porosity and impermeability, Ignimbrites of rift floor, Dino formations of pyroclastic deposits and Pleistocene basalt were assigned moderate value for they mostly well jointed and have moderate permeability, and these rocks increases their permeability, low value were assigned for per alkaline Dino formations less affected by faulting and fracturing (Gintamo, Citation2014).
f. Central volcanic complexes (Qwpu)
This lithological group follows hill type of geomorphology, namely, Gafat Hill of DallochaWoreda and escarpment of HulberegWoreda, whereas lithological group Qws found in east edge of the Dijo Catchment covers very small area. The area was almost covered by Qdi and Qwbh lithological groups. There is no bore hole drilled on this lithological group.
3.2.6. Elevation
Elevation of the catchment ranges from 1761 to 3192 m above sea level (). High elevation was found in west and north edge of the study area and decrease toward east and south of the study area except topographically irregular and hilly areas. A higher weight is given for lower elevated zones and lower weight was assigned for highly elevated areas (see ).
Figure 10. Elevation map.
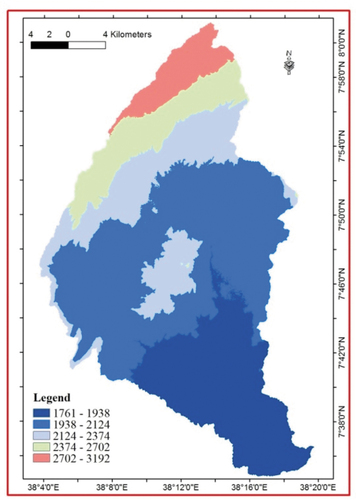
Figure 11. Lithology map of the study area.
3.2.7. Lineament density
There were 877 lineaments within Upper Dijo Catchment. Among these, the minimum length of lineament was 0.0335 km and the maximum was 1.24 km with the mean length of 0.32 km. Lineaments may act either as pathways for water movement or as flow barriers. The lineament orientation rose diagram of Upper Dijo Catchment is concentrated (present high frequency of lineament) in NNE-SSW direction. This lineament direction was exactly similar with lineament orientation of Bilate River Catchment that covers south west of Upper Dijo Catchment, which is conducted by Gintamo (Citation2014).
Springs at escarpment were indicative of the lineament importance on groundwater potential by acting as conduits/pathway rather than acting as storage by making a barrier to horizontal groundwater movement. This result was in line with Gintamo (Citation2014) who investigated lineament on Bilate Catchment. In addition to lineament orientation, elevation of the area was more or less aligned with lineament direction. Similar with surface runoff, groundwater flows from high elevated areas toward low elevated areas. Also, the stream direction of the study area fits with direction of lineament orientation. Geological category of the area also follows NNE to SSW direction, which is similar with lineament orientation. As the rose diagram of lineaments shows that most of lineaments within the catchment were oriented parallel to one another and very little were intersected. Therefore, lineament of the area acts as a pathway for groundwater movement within the study area. As the result, lineaments were found to be partially suitable for groundwater prospecting. This is because orientation of lineaments was parallel than in diverse direction to intersect one another for the barrier of groundwater movement to produce high groundwater potential. Lineament density of the catchment ranges from 0 to 1.67 km/km2 in the study area. High density of lineament was found in small area coverage from north edge of the study area, and majority of the area were covered by low lineament density especially at east portion of the catchment. Whereas a higher weight is assigned for the dense lineament zones and lower weight was assigned for lower density of lineament (see & ).
Figure 12. Lineament density map.
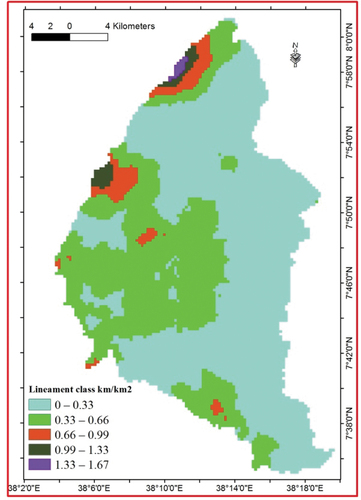
Figure 13. Rose diagram of lineaments.
3.3. Developing an analytical hierarchy process (AHP)model
The first step in AHP analysis is to build a hierarchy for the decision. AHP decomposes the problem in a hierarchy. As adopted by Mu and Pereyra-Rojas (Citation2017), first level of the hierarchy is the goal of groundwater potential zone identification. The second level in the hierarchy indicates the parameters that used to decide the potential zone and the third level is about an alternative to select groundwater potential zone as very high, high, moderate, low, and poor. Advantage of AHP is to decompose problems in a better understanding way and makes it simple to solve a problem. It is also possible to request participation of experts to ensure that all criteria and possible alternatives were applied (Mu & Pereyra-Rojas, Citation2017).
3.3.1. Derived priorities (Weights) for the parameters
The result of AHP shows that geomorphology has the highest weight (31%) followed by lithology, which accounts for 22% of the weight given to each parameter. The least weight is assigned to rainfall, land use/cover and lineament. Rainfall was found to be less important in terms of deciding the availability of groundwater. This could be attributed to the scanty nature of rainfall in the area. The weight assigned to slope, drainage density, soil, elevation, lineament density, LULC, and rainfall was 15%, 10%, and 7%, 6%, 4%, 3%, and 2% respectively. This result was in line with the study conducted by Gintamo (Citation2014) on Bilate catchment. Consistency of the derived weight was 0.03, which is less than 0.1 and therefore it is accepted. Normalization of computed weight was performed by multiplying derived weight of all parameters by 100% and then judgments matrix is consistent and so it is possible to perform further ranking of feature of each parameters for weighted overlay purpose.
Features of each thematic layer were ranked on the basis of influence of groundwater potential within each parameter (Das & Mukhopadhyay et al., Citation2020). In this study, inverse ranking was used standing from 1 to 9. The larger value (rank), for instance, 9 was assigned for very important feature that is multiplied by the normalized weight of that parameter to produce the GWPI map and vice versa.
3.3.2. Groundwater potential zone of the catchment
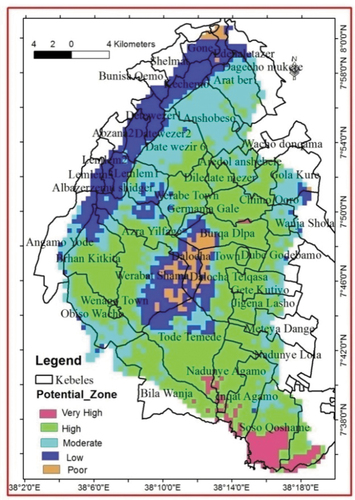
Based on the analysis made, an area along the drainage towards south of the catchment has very high groundwater potential. These very high groundwater potential zone areas are characterized geomorphologically by valley (TPI≤-1), low elevation, poor, and low drainage density, Qdi (Dino formation) with good aquifer of ignimbrite, water lain pyroclastic and lacustrine, flat to gentle slopping classes, sandy loam, and loamy soil texture classes.
South portion of upper Dijo catchment especially south of Gafat hill, some parts of the east, and West center of the upper catchment are among high groundwater potential zone. These high potential zones were characterized lower slopes (−1 units <TPI≤(−0.5) units), (Qdi) Dino formation with good aquifer of ignimbrite, water lain pyroclastic and lacustrine, flat to gentle slopping classes, poor and low drainage density class; sandy loam and loam soil textures, low and low-to-moderate elevation.
Most of central east and west edge of the area around Alicho escarpment and Gafat ridge are covered by moderate groundwater potential zones. Majority of low groundwater potential zones were distributed along north edge of upper Dijo catchment, top of Gafat ridge and some at east edge of the catchment.
Poor groundwater potential zone occurs around north edge of the catchment at recharge area, some at west of Worabe town and the hills of a Gafat at center of the catchment. This poor groundwater potential zone was characterized by geomorphologically (ridges TPI >(1)units) with poor groundwater potential, lithological Qwpu and Npp with low and poor groundwater potentials, very steep slopping area, and very high elevated area of Gafat hill, which have poor ground water potential.
The groundwater potential zones of upper Dijo catchment were similar with the result of Kudamnya and Andongma (Citation2017), on groundwater potential on sokoto basin of nigeria, Kirubakaran et al. (Citation2016) on groundwater recharge on Tamil Nadu, India, and Bashe (Citation2017) who conduct groundwater potential zone on middle Awash river basin in which very high and high groundwater potentials were occurred in the alluvial plains/floodplain in the rift floors and poor groundwater potential were found along mountain areas. This is due to percolation of water into the ground from a drainage system that is greater in areas nearer to the drainage line than further away (see and ).
Table 2. Area coverage of groundwater potential zone of study area.
Figure 14. Groundwater potential zone of upper Dijo catchment.
3.3.3. Validation of the result
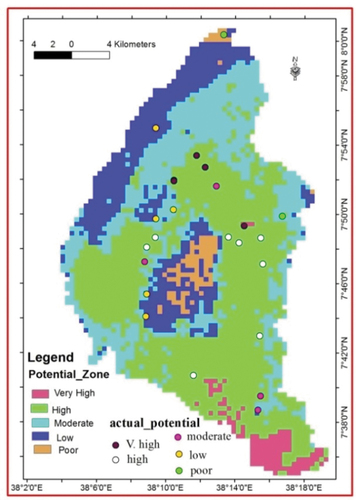
The result of the analysis was validated by overlaying borehole yield data of the study area on classified predicted groundwater potential zone map. Generally, from the total of 24 bore holes of the catchment, 19 are consistent with the predicted map and five are not. Thus, the result of the prediction shows 79.2% of the analysis is found to match with the data collected from field (see ).
Figure 15. Validation of result using borehole data.
4. Conclusions
Groundwater is a renewable natural resource that provides means of livelihood for the people in which there is no alternative surface water. We identified that the study area is one among the areas where there is limited access to surface water due to its geographic location. However, there appears to be high groundwater potential in the area, which is not utilized so far. Lack of technology to locate where the potential is available and proper planning remains to be bottlenecks in the area in the last couple of decades. Thus, it is believed that analyzing the status of groundwater potential of Upper Dijo Catchment is very important to locate groundwater within the area and then address pertinent problems in relation to shortage of water.
In our study, we have identified that the catchment is potentially rich in water resources, particularly groundwater. Close to half of the catchment was found to have high potential for groundwater. This has been validated by our field survey data, which were collected from the bore holes currently in use in the study. However, this study did not investigate the extent of the available water and that the water can be used for different purposes. Despite the aforementioned limitation, we strongly believe that the findings can be used to look for strategies as to how the water resources that are available in the area are tapped and thereby address the problem that the local people have been facing. We suggest a comprehensive study to be conducted to examine the volume of water available and it’s quality so that it can be used for the required purpose.
The area appears to have high potential for irrigation due to the presence of large areas of irrigable land with good soil fertility. Due to its geographic location, the lower parts of the catchment receive volcanic sediments being transported from the upper parts of the catchment. Although it has high potential for irrigation agriculture due to fertile soil, irrigable land, and availability of high ground water potential, the area is identified as one among food in secured areas. Thus, we suggest that consorted efforts are required from the district and regional government to tap the resources, which are available and thereby improve the living condition of the people residing in the catchment.
Disclosure statement
No potential conflict of interest was reported by the author(s).
Correction Statement
This article has been corrected with minor changes. These changes do not impact the academic content of the article.
References
- Abdullahi, B. U., Rai, J. K., Momoh, M., & Udensi, E. E. (2013). Application of remote sensing and GIS in ground water mapping in some selected localities in Kebbi state, Nigeria. International Journal of Marine, Atmospheric & Earth. Sciences, 1(2), 81–95. https://www.academia.edu/52234009/Application of remote sensing and GIS in groundwater mapping in some selected localities in Kebu state Nigeria.
- Adiat, K. A. N., Nawawi, M. N. M., & Abdullah, K. (2012). Assessing the accuracy of GIS-based elementary multi criteria decision analysis as a spatial prediction tool–a case of predicting potential zones of sustainable groundwater resources. Journal of Hydrology, 440-441, 75–89. https://doi.org/10.1016/j.jhydrol.2012.03.028
- Adwumi A.J., & Anifowose, Y.B.(2017). Hydrological characterization of Owo and its environs using remote sensing and GIS. Applied water sciences, 7(6), 2987–3000.
- Agarwal, E., Agarwal, R., Garg, R. D., & Garg, P. K. (2013). Delineation of groundwater potential zone: An AHP/ANP approach. Journal of Earth System Science, 122(3), 887–898. https://doi.org/10.1007/s12040-013-0309-8
- Altchenko, Y., & Villholth, K. G. (2014). Mapping irrigation potential from renewable groundwater in Africa--a quantitative hydrological approach. Hydrology & Earth System Sciences Discussions,19(2), 1055–1097.https://doi.org/105194/hess-1055-2015,2015
- Argaz, A., Ouahman, B., Darkaoui, A., Bikhtar, H., Yabsa, K., & Laghzal, A. (2019). Application of remote sensing techniques and GIS-multicriteria decision analysis for groundwater potential mapping in souss watershed, Morocco. Journal of Materials and Environmental Science, 10(5), 411–421.
- Awulachew, S. B., Erkossa, T., & Namara, R. E. (2010). Irrigation potential in Ethiopia–Constraints and opportunities for enhancing the system. International Water Management Institute.
- Bashe, B. B. (2017). Groundwater potential mapping using remote sensing and GIS in Rift Valley Lakes Basin, Weito Sub Basin, Ethiopia. International Journal of Scientific and Engineering Research, 8(2), 43–50.
- Biswas, A., Nath, B., Bhattacharya, P., Halder, D., Kundu, A. K., Mandal, U.,Jacks, G. (2012). Hydrogeochemical contrast between brown and grey sand aquifers in shallow depth of Bengal Basin: Consequences for sustainable drinking water supply. Science of the Total Environment, 431, 402–412. https://doi.org/10.1016/j.scitotenv.2012.05.031
- Chowdhury, A., Jha, M. K., & Chowdary, V. M. (2010). Delineation of groundwater recharge zones and identification of artificial recharge sites in West Medinipur district, West Bengal, using RS, GIS and MCDM techniques. Environmental Earth Sciences, 59(6), 1209. https://doi.org/10.1007/s12665-009-0110-9
- Chowdhury, A., Jha, M. K., Chowdary, V. M., & Mal, B. C. (2009). Integrated remote sensing and GIS‐based approach for assessing groundwater potential in West Medinipur district, West Bengal, India. International Journal of Remote Sensing, 30(1), 231–250. https://doi.org/10.1080/01431160802270131
- Chuma, C., Orimoogunje, O. O., Hlatywayo, D. J., & Akinyede, J. O. (2013). Application of remote sensing and geographical information systems in determining the groundwater potential in the crystalline basement of Bulawayo metropolitan area, Zimbabwe. Advances in Remote Sensing, 2(2), 149–161. https://doi.org/10.4236/ars.2013.22019
- Das, N., & Mukhopadhyay, S. (2020). Application of multi-criteria decision making technique for the assessment of groundwater potential zones: A study on Birbhum district, West Bengal, India. Environment, Development and Sustainability, 22(2), 931–955. https://doi.org/10.1007/s10668-018-0227-7
- Dinesan, V. P. G. G. (2015). Application of geoinformatics for the delineation of groundwater prospects zones- A case study for melattur grama panchayat in Kerala, India. International Conference On Water Resources, Coastal And Ocean,Aquatic procedia, 4, 1389–1396. https://doi.org/10.116.j.aqpro.2015.02.180.
- FAO, 2016. Global diagnostic on groundwater governance. USA, 1–210.
- Fentaw, B., & Manaye, M. (2019). Hydrogeological and hydrochemical maps of Akaki Beseka NC 37–14 sheet. GSE.
- Gadrani, L., Lominadze, G., & Tsitsagi, M. (2018). F assessment of landuse/landcover (LULC) change of Tbilisi and surrounding area using remote sensing (RS) and GIS. Annals of Agrarian Science, 16(2), 163–169. https://doi.org/10.1016/j.aasci.2018.02.005
- Gintamo, T. T. (2014). Ground water potential evaluation based on integrated GIS and remote sensing techniques, in Bilate River Catchment: South Rift Valley of Ethiopia. American Scientific Research Journal for Engineering, Technology, and Sciences (ASRJETS), 10(1), 85–120.
- Giordano, M. (2006). Agricultural groundwater use and rural livelihoods in sub-Saharan Africa: A first-cut assessment. Hydrogeology Journal, 14(3), 310–318. https://doi.org/10.1007/s10040-005-0479-9
- Harter, T. (2003). Basic concepts of groundwater hydrology. UCANR Publications.
- Hussein, A. A., Govindu, V., & Nigusse, A. G. M. (2017). Evaluation of groundwater potential using geospatial techniques. Applied Water Science, 7(5), 2447–2461. https://doi.org/10.1007/s13201-016-0433-0
- Ibrahim-Bathis, and Ahmed S. A. (2016). Geospatial technology for delineating groundwater potential zones in Doddahalla watershed of Chitradurga district, India. The Egyptian Journal of Remote Sensing and Space,19(2) 123–234. https:dot.org/10.1016.j.ejrs.2016.06.002
- Jenks, G. F. (1967). The data model concept in statistical mapping. International Yearbook of Cartography, 7, 186–190.
- Kirubakaran, M., Johnny, J. C., Ashokraj, C., & Arivazhagan, S. (2016). A geostatistical approach for delineating the potential groundwater recharge zones in the hard rock terrain of Tirunelveli taluk, Tamil Nadu, India. Arabian Journal of Geosciences, 9(5), 382. https://doi.org/10.1007/s12517-016-2419-5
- Kudamnya, E. A., & Andongma, W. T. (2017). Predictive mapping for groundwater within Sokoto Basin, North Western Nigeria. Journal of Geography, Environment and Earth Science International, 10(2), 1–14. https://doi.org/10.9734/JGEESI/2017/32440
- Kumar, T., Gautam, A. K., & Kumar, T. (2014). Appraising the accuracy of GIS-based multi-criteria decision making technique for delineation of groundwater potential zones. Water Resources Management, 28(13), 4449–4466. https://doi.org/10.1007/s11269-014-0663-6
- MacDonald, A. M., Bonsor, H. C., Dochartaigh, B. É. Ó., & Taylor, R. G. Quantitative maps of groundwater resources in Africa. (2012). Environmental Research Letters, 7(2), 024009. British Geological Survey Groundwater Programme Internal Report Ir/10/103. https://doi.org/10.1088/1748-9326/7/2/024009
- Magesh, N. S., Chandrasekar, N., & Soundranayagam, J. P. (2012). Delineation of groundwater potential zones in Theni district, Tamil Nadu, using remote sensing, GIS and MIF techniques. Geoscience Frontiers, 3(2), 189–196. https://doi.org/10.1016/j.gsf.2011.10.007
- Meijerink, A. M., Bannert, D., Batelaan, O., Lubczynski, M. W., & Pointet, T. (2007). Remote sensing applications to groundwater. Unesco.
- Mu, E., & Pereyra-Rojas, M. (2017). Understanding the analytic hierarchy process. In Practical decision making (pp. 7–22). Springer cham. https:doi.org/10.1007.978-3-319-33861-3_2
- Murthy, K. S. R. (2000). Ground water potential in a semi-arid region of Andhra Pradesh-a geographical information system approach. International Journal of Remote Sensing, 21(9), 1867–1884. https://doi.org/10.1080/014311600209788
- Kumar P. S., Balasundareshwaran A., Kumaraswamy K and Balaselvakumar S (2017). Assessment of groundwater potential zones in dindigul district, tamil nadu, using gis-based on analytical hierarchical process (AHP) technique. International Journal of Recent Scientific Research, 8(12), 22684–22690. https://doi.org/10.24327.ijrsr.2017.0812.1316
- Nair, P. P., & Babu, S. S. (2015). Identification and analysis of groundwater potential zones in Hosur Taluk, Tamilnadu using remote sensing and geographical information system. International Journal of research review in engineering and Management, 1(2),61-77.
- Rahmati, O., Samani, A. N., Mahdavi, M., Pourghasemi, H. R., & Zeinivand, H. (2015). Groundwater potential mapping at Kurdistan region of Iran using analytic hierarchy process and GIS. Arabian Journal of Geosciences, 8(9), 7059–7071. https://doi.org/10.1007/s12517-014-1668-4
- Ramamoorthy, P., & Rammohan, V. (2015). Assessment of groundwater potential zone using remote sensing and GIS in Varahanadhi watershed, Tamilnadu, India. International Journal for Research in Applied Science and Engineering Technology, 3(5), 695–702.
- Saaty, T. L., & Vargas, L. G. (2012). Models, methods, concepts & applications of the analytic hierarchy process (Vol. 175). Springer Science & Business Media.
- Sheng, T. (1990). Watershed management field manual. Food And Agriculture Organization Of The United Nations(FAO), Rome,1–148.
- Siebert, S., Burke, J., Faures, J. M., Frenken, K., Hoogeveen, J., Döll, P., & Portmann, F. T. (2010). Groundwater use for irrigation—a global inventory. Hydrology and Earth System Sciences, 14(10), 1863–1880. https://doi.org/10.5194/hess-14-1863-2010
- Uhl, V. W., Baron, J. A., Davis, W. W., Warner, D. B., & Seremet, C. C. (2009). Groundwater development, basic concept for expanding CRS water programs. Catholic Relief Service, USA. https://www.crsprogramquality.org
- Waikar, M. L., & Nilawar, A. P. (2014). Identification of groundwater potential zone using remote sensing and GIS technique. International Journal of Innovative Research in Science, Engineering and Technology, 3(5), 12163–12174.
- Weiss, A.(2001). Topographic position and landform analysis. In a poster presentation, ESRI user conference, San Diego, CA.
- Wind, Y., & Saaty, T. L. (1980). Marketing applications of the analytic hierarchy process. Management Science, 26(7), 641–658. https://doi.org/10.1287/mnsc.26.7.641
- Yahaya, S., Ahmad, N., & Abdalla, R. F. (2010). Multicriteria analysis for flood vulnerable areas in Hadejia-Jama’are River basin, Nigeria. European Journal of Scientific Research, 42(1), 71–83.
- Yeh, H. F., Cheng, Y. S., Lin, H. I., & Lee, C. H. (2016). Mapping groundwater recharge potential zone using a GIS approach in Hualian River, Taiwan. Sustainable Environment Research, 26(1), 33–43. https://doi.org/10.1016/j.serj.2015.09.005
- Yeh, H. F., Lin, H. I., Lee, S. T., Chang, M. H., Hsu, K. C., & Lee, C. H. (2014). GIS and SBF for estimating groundwater recharge of a mountainous basin in the Wu River watershed, Taiwan. Journal of Earth System Science, 123(3), 503–516. https://doi.org/10.1007/s12040-014-0420-5
- Yonghui An, Y. W. (2011). GIS-based suitability assessment for shallow groundwater development in Zhangye Basin. International Conference on Environmental Science and Engineering (pp. 1397–1403). Center for hydrogeology and environmental geology, CGS, Baoding Hebei, China: Procedia Environmental Sciences.