
 ?Mathematical formulae have been encoded as MathML and are displayed in this HTML version using MathJax in order to improve their display. Uncheck the box to turn MathJax off. This feature requires Javascript. Click on a formula to zoom.
ABSTRACT
The present study evaluates the impact of reservoir on changing the landscape pattern in the Urmodi River watershed of Satara district, Maharashtra, India, by employing Remote Sensing (RS)-based change detection technique. To map the change in surface cover due to the reservoir, we have used Landsat TM and Landsat 8 imagery which represents before-dam and after-dam status of land cover in the year 1996 and 2016. The supervised classification used with the maximum likelihood algorithm was employed to generate the thematic map. Further, to detect the change, SAGA GIS software was used which has an inbuilt tool of the confusion matrix (grid-based) to represent changes in two grids. The tool has significant importance in showing the detection of the transformation of land cover in previous to next condition. The technique is found to be scientific and robust with more precision as compared to the traditional methods. The rate of change in land cover of agriculture land shows −2.50%, barren land 0.31%, settlement 6.64%, and forest 2.20% change per annum. The water body area has a sudden increment in the year 2016 with coverage of 11.86 km2 as compared to a previous area of 0.64 km2 in the year 1996, and is not considered under the rate of change as it was a one-time activity. The study has a potential role in analyzing the land change dynamics.
1. Introduction
Landscapes are visible as an integral part of terrestrial ecosystems. It possesses various characteristics over its spatial extent with a period. The land surface continuously goes into several changes by the various natural and human-induced activities. The land mosaic undergoes the fluctuation in quality, size, shape, and its spatial arrangement of patches (Farina, Citation1998). Nowadays, due to anthropogenic activities, the land resource experiences different changes with various magnitude. Land Use and Land Cover (LULC) is a hybrid type of classification. In land use, human employment of land resources has been studied by social scientists. Whereas, in land cover only deals with bio-physical characteristics of the land surface; this is generally studied by the environmentalists (Meyer and William 1992). LULC pattern has always been the result of anthropogenic interaction with natural environments (Rautela et al., Citation2002). LULC monitoring has two main aspects namely, land cover classification and its change detection (CD). The land cover simply indicates the area occupied by agriculture, water body, bare land, forest, built-up, etc. And land-use is the utilization of landscape by people for various purposes (Thyagharajan & Vignesh, Citation2019). Human-induced activities are continuously changing their surroundings at an unprecedented rate and speed. Among the list of global changing environments, alteration in LULC has a close association with natural and human processes (Kumar et al., Citation2014). Land cover is among the ones which are the most likely detectable indicators of human intervention on the terrain. Changes over terrain that quickly take place is also a good proxy of land dynamics resulting from numerous drivers and factors (Gregorio et al. 2016). LULC has a significant role in the research field. It is one of the sensitive indicators which give a picture of human and environmental interactions (Alkharabsheh, Alexandridis, Bilas, Misopolinos & Silleos, Citation2013). In the recent few decades, fast urban sprawl caused the identifiable conversion of natural lands to urban and agricultural land. The process has a significant socio-environmental consequence (Zadbagher et al., Citation2018). The assessment of LULC is an important element for the meaningful planning of land resources. This inventory is assumed to have increasing significance in various sects of arable land, settlements, and operational planning based on agro-climatic regions. From a conceptual point of view, LULC changes allow detection of long-term trends at spatio-temporal resolution which can help in structuring policy in anticipation of issues that attend change in land use (Jayakumar & Arockiasamy, Citation2003). The temporal assessment of land cover is the change detection analysis with a time of an area (Musaoglu et al., Citation2005).
Remote sensing (RS) with integration to Geographical Information Science (GIS) provides the opportunity to observe the earth and generate information from the analysis (Paiboonvorachat & Oyana, Citation2011). LULC is one of the core information thematic layers for a variety of administrative and scientific activities (Gadrani et al., Citation2018). The land-use change models apply the techniques to investigate the spatial relationship between the chronological transformation in land cover and its driver; further such models are useful to project the spatial changes with respect to the scenarios along with its drivers (Meiyappan et al., Citation2014). Out of the various methods of the detection of land cover changes, transition matrix is one method that contributes to reveal the spatio-temporal land cover transformation in tabular form. This method has been used by Liu and Long (Citation2016). The “Urmodi major irrigation project” on Krishna River was constructed in the year 2014, with the expected area under irrigation 27,750 hectares (Maharashtra State Data Bank, Citation2021). As the dam was constructed, there was submergence of agriculture and riverine landscape. These changes in the spatial patches of land cover due to irrigation project need to be demarcated. RS-based imageries have the strength to map such changes in landscape cover with the help of spectral reflectance. Therefore, this study aimed to produce RS-based LULC classified map of the Urmodi River watershed before-dam and after-dam of the construction of the dam, and also to produce the transition matrix and LULC transition map due to the introduction of the dam in the study area. The study has implications in the land resource management by identification of threat to land cover by computation of annual growth rate.
2. Study area
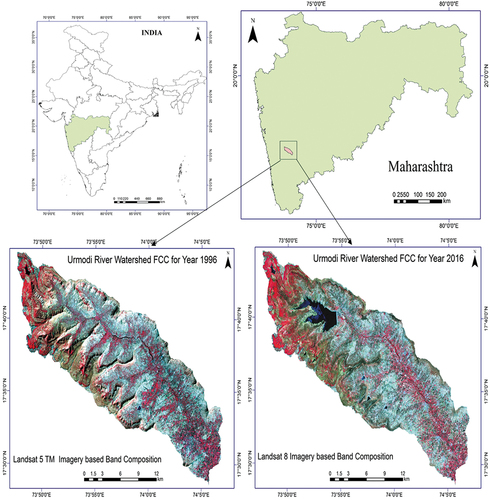
The Urmodi River Watershed is a tropical watershed present in the Satara district of Maharashtra, India. shows the spatial extent of the study area. The coordinates of the region are located between 73°47ʹ36.509”−74°5ʹ45.986”E longitude and 17°28ʹ49.332”−17°44ʹ39.046”N latitude. Urmodi River watershed covers an area of 412.44 km2. It is spread over two blocks namely, Satara and Jaoli. Its spatial extent shows a huge altitude variation. It is surrounded by the reservoirs by all sides except the East. On the Urmodi River, an earthen dam, named “Urmodi dam,” was constructed in the year 2014 by the Government of Maharashtra with the aim of irrigation and drinking purposes. At the upper catchment, where the plateau area exists, “Kaas Plateau” (Valley of flowers), a world heritage site, is presently recognized by UNESCO in the year 2012. Nearly 5–10% of the upper catchment of the study area is a part of the Western Ghats (a biodiversity hotspot) and its sub-cluster. The northwestern part of the watershed is rich in its flora and fauna. The Urmodi River originates in the Kaas pond and meets Krishna River at Kashil village. The watershed has different geomorphological landforms like plateau, undulating lands, waterfall, hills, and pediplain. At the upper catchment, paddy cultivation takes place and in the lower watershed Rabi and Kharif crops are cultivated. Rainfall is concentrated in months of June–September which is mainly in the monsoon. From field soil sampling it is revealed that most of the soils in the catchment lie in the category of sandy and light silty soils to medium soils based on classification done by Environment Agency (Citation2007). The watershed has a huge difference in its elevation extracted from Cartosat DEM, which is 682 m. National Highway 4 (NH 4) runs through the watershed of length 20 km.
Figure 1. Location of Urmodi River Watershed with false colour composition.
3. Material and methods
3.1 Satellite data
To prepare the land cover thematic map, cloud-free RS-based satellite imagery of Landsat TM was free of cost downloaded from the Global Land Cover Facility (pre-dam condition). The acquisition date of the imagery was 30 January 1996. To prepare the post-dam map, georectified Landsat 8 satellite imagery was downloaded from Earth Explorer. The frame was captured on 26 April 2016. Both images have WRS path 147 and WRS row 48. The map projection of both imageries was UTM 43 N with WGS 84 datum. The bands of Landsat TM and Landsat 8 come with GeoTIFF extension. Before the monsoon period, captured images were considered for the processing since it will produce better results. gives the spectral and spatial information of bands. Earth Resource Data Analysis System (ERDAS 2011) Imagine software was used to perform False Colour Composition (FCC) of bands by taking band no. 3, 2, 1 of Landsat TM and band no. 5, 4, 3 of Landsat 8 (USGS, Citation2020).
Table 1. Details of Landsat TM and Landsat 8 bands.
3.2 Image classification
The multispectral data are used to complete the process of classification. Mainly, the spectral pattern present within the data for a particular pixel has a numerical basis to perform the categorization (Musaoglu et al., Citation2005). In the case of image classification, the supervised classification method is well established; which helps in grouping the land use/land covers sensed from satellite imageries. This method starts with the supervision of pixels by an image analyst by a particular algorithm; a numerical explanation of different land cover types exists in the scene. Training sites of identified cover type are taken as a representative sample; in the next step, it is to be used for compilation to form a key that can explain a numerical value of various land cover expresses spectral attributes for a particular type of interest (Ramachandran & Reddy, Citation2017). There are several algorithms used for supervised classification. Maximum Likelihood (ML) is one of the widely used one to classify the image. The principle is a probability function that assumes the training data for each class in each band is normally distributed (Basukala et al., Citation2017). describes the details of each type of land cover and land usage.
Table 2. Description of LULC used for classification.
3.3 LULC change detection
Satellite-based Earth Observation is cost-effective and feasible technique for monitoring LULC with the capability of conversion identification (Saranya & Reddy, Citation2016). Change detection method clarifies the changes in a particular type of land cover with respect to two time periods. This step was a part of the post-classification LULC assessment. Supervised classified images of 1996 and 2016 were employed as basic input for detection of rate of change. The raster map of the supervised map was converted into a polygon (vector form) and the area was computed. First, we calculate the area of each land cover type for both the images and perform the equation shown below to analyze the change over a period of time. Many researchers have used the same equation to perform the same (Bashir & Ahmad, Citation2017; Hassen & Assen, Citation2018).
At1 = Area of one type of land cover at t1 time.
At2 = Area of one type of land cover at t2 time (latest)C = Rate of change occurred in percent.
3.4 Transition matrix for landscape conversion monitoring
The activity in which differences in state of the image are determined is termed as change detection. Satellite-captured imageries are the perfect input sources that contribute to timely planning and management (Kalpana, Citation2018). The transition matrix or confusion matrix is the table with systematic arrays consisting of land cover classes from the initial stage to the final stage. The diagonal value represents the cover remains unchanged during the conversion (Suleiman et al., Citation2017). Recently, similar studies were also carried out in India to show the LULC transformation by using change matrix (Mishra et al., Citation2020; Naikoo et al., Citation2020). According to Bektas and Goksel (2005), it is the quantification of change in land cover over the period time concerning to a fixed area. It determines the alteration in land cover properties based on co-registered multi-temporal RS data. After change detection; in the next phase, post-classification change detection was used to show the change in LULC. The change detection process fundamentally deals with “from-to” changes taken place over a given period of time. To achieve to LULC transition table, System for Automated Geoscientific Analyses (SAGA GIS) was used which creates the conversion matrix and derived coefficients as well as the combinations of both classifications as a new image. The grid classes have to be defined with a look-up table and values for two grids must have to show similarity for subsequent comparison (Conrad et al., Citation2015). With the help of this software, a lookup table along with a new grid will be created that enables the depiction of the land cover classes in the thematic map where actual transformation has occurred. With the help of the transition matrix, the switching or shifting between the two land covers can be easily determined at a glance with the assistance of the matrix itself.
3.4 Accuracy assessment
Accuracy assessment is a crucial step in LULC classification. The performed classification can be trustable and reliable only after meeting the accuracy checks as the thematic map derived from satellite scene may contain some chances of errors due to some factors including the methods in classification to the retrieval of satellite imagery (Usman et al., Citation2015). In the accuracy assessment of supervised classified maps, user’s accuracy, producers’ accuracy, overall accuracy, a kappa statistics from the error matrix has been analysed and recorded (Oyedotun, Citation2019).
4. Results and discussion
4.1 Spatio-temporal dynamics in LULC
There were two conditions of the study region that exist. First, before-dam, i.e., in the year 1996 which is displayed in . And, after-dam, i.e., in the year 2016 which is shown in . The report of the accuracy assessment with kappa statistics of the supervised classified image of the Landsat 5-based and Landsat 8-based satellite imageries is described in . The Urmodi Dam construction was the only big turning point that has dramatically done perturbation on the natural and historical habitat of the Urmodi River catchment. Among the converted areas, agriculture and barren land contribute the most compared to settlement and forest. After the introduction of the dam, rapid urbanization is the key driver that played a substantial role in shaping the new pattern of LULC of the study area. Alteration in land cover and land utilization was the second factor that has a significant role in affecting surface water discharge in the twentieth-century and the majority taking place in the tropical region (Montanarella et al., Citation2018). shows the amount of area under each land cover transformed from a pre-existing state to a new state from 1996 to 2016 with the rate of change taken place. The LULC changes taken place are graphically displayed in . This map also indicates that most of the land surrounding the river channel remains unchanged due to the availability of water for agriculture purposes. The land submerged underwater due to the introduction of the reservoir was 4.15 km2, whereas the alteration from barren land to water body was 6.90 km2. The barren land area was increased from 221.75 km2 to 235.31 km2. Hence, there was a substantial increment in the barren land which is a negative aspect from the environmental perspective. Due to urbanization, agricultural land was found to be under severe threat. Most of the agricultural land was transformed into settlements along the national highway and 50.43 km2 remained barren. Additionally, we would like to mention that the agricultural land behind the reservoir was converted into the forest land which is a good indication from the land degradation perspective. There was a dramatic increment in the settlement from 20.11 km2 to 46.81 km2; that was almost double in this area in two decades. It was good to know that the area under forest cover was increased with an annual rate of 2.20%. The investigation has found that there was positive growth in forest cover in the upper catchment of the study area. This has been a good sign of forest management in the protected areas. While examining the trend analysis of landscape change, “Water body” assumed to be constant as till 2016 no changes in water body regime were observed using satellite images. Settlement/built-up (rural) areas within the watershed were found to be increased with the highest rate till the year 2016 by 6.64% per annum and decline of agriculture area by −2.5% per year. The quantitative changes in the transition of the land cover are shown in . In the same table, diagonals show the area of the specific class remained unchanged from 1996 to 2016 and off-diagonals value in the matrix represents the shift from one class to another. The quantitative estimate of landscape dynamics is a crucial approach for the evaluation of the impact of the current land use and could help in finding the anthropogenic impact on the natural resources (Yang et al., Citation2017). The graphical representation of the difference in the LULC area during before-dam and after-dam is displayed in .
Figure 2. Supervised classification map of Urmodi River watershed in 1996 (before-dam condition).
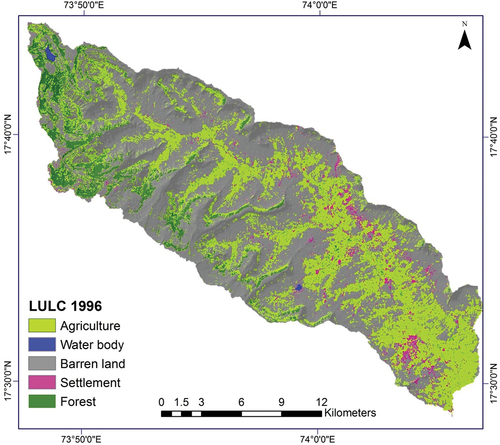
Figure 3. Supervised classification map of Urmodi River watershed in 1996 (after-dam condition).
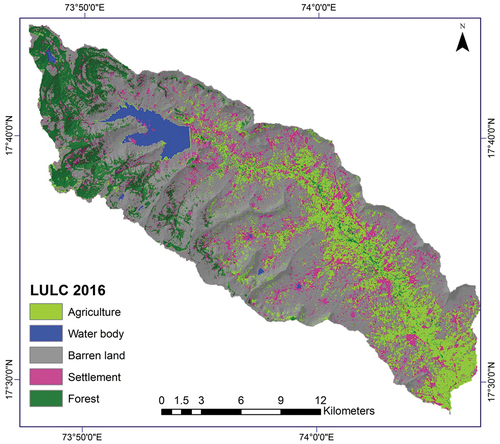
Figure 4. Land Use Land Cover change dynamics by confusion.
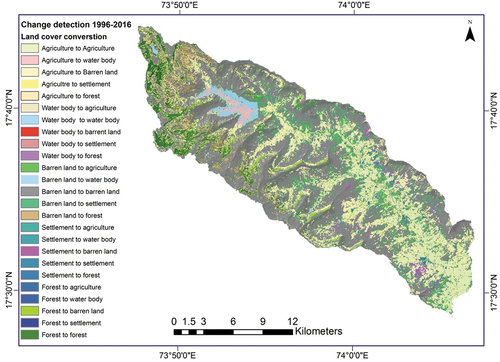
Figure 5. Comparative analysis of area of LULC from 1996 to 2016.
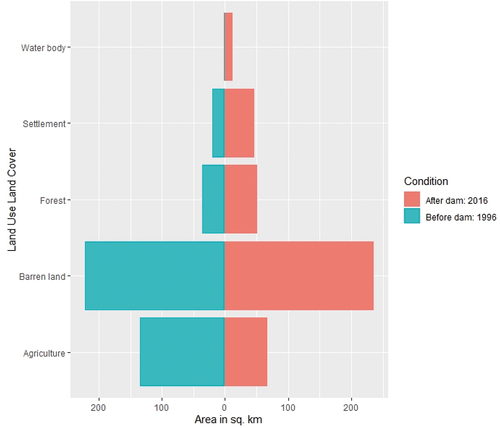
Table 3. Accuracies and Kappa statistics of supervised classification of Urmodi River watershed.
Table 4. Area of LULC and the rate of change taken place from Landsat TM and Landsat 8 imagery of 1996 to 2016 respectively.
Table 5. Transition matrix of LULC from 1996 to 2016 within Urmodi River Watershed.
4.2 Water body area and river channel length
Building a dam over the Urmodi River channel have several permanent impacts on the catchment. Primarily, the backwater area is converted into a permanent water surface as a reservoir. The watershed got its large reservoir; hence, it largely affects the aquatic ecosystem of the river. Second, water availability in the watershed can be achieved during the drought period. This has been a boost to agricultural activities. Before the existence of the dam, the total length of the Urmodi River was 49.4 km. The dam segmented the river into two parts of length, that is, the length of the Urmodi River before the reservoir is 7.45 km and after dam 36.6 km, respectively. From the geomorphological and hydromorphological perspective, the number of channels and stream orders get changed due to emergence of new water body boundary. The reservoir also caused changes in the subwatershed boundaries. From the spatial planner and policy maker’s point of view, change in LULC has been an integral part of the formulation of appropriate strategies and policy (Sewnet & Abebe, Citation2018).
4.3 Drivers of LULC changes at the regional scale
Dam construction was the only big turning point that dramatically did perturbation on the natural and historical habitat of the Urmodi River catchment. Among the converted areas, agriculture and barren land contribute the most compared to settlement and forest. After the introduction of the dam, rapid urbanization is the key driver that played a substantial role in shaping the new pattern of LULC of the study area. Such analysis has a huge contribution in analyzing the updated information about land resources and how we can use it sustainably in the future at the regional scale. Alteration in land cover and land utilization was the second factor that has a significant role in affecting surface water discharge in the twentieth-century and the majority taking place in the tropical region (Montanarella et al., Citation2018)
5. Conclusion
The present evaluation of Earth-observation-based LULC in Urmodi River watershed is to explain the quantitative change in the area of each land cover with a spatio-temporal frame of 1996 to 2016. The results show that LULC practices have significantly changed in the last two decades. The dam has altered the natural history of land cover permanently. The RS-based satellite imagery provides the chronological spatial coverage of biophysical factors within the scene. It further helps to understand the trend of land cover change from one period to another. In the tropical region due to the increased demand of irrigation, the need for water conservation and expansion of urbanization landscape dramatically undergoes changes. The regional permanent land cover transformation at two different timescales has been successfully tested using GIS tools. The transition matrix tool has been found to be potentially capable to detect the change in dynamics of land covers. Also, the structured monitoring of land at a regional scale was made possible by the RS approach. The outcome of transition matrix along with the rate of conversion enable the policy-makers to find the threat of degradation to particular land cover and help in decision-making with the purpose of resource conservation. For sustainable land-use practices, the present study gives highlights to policymakers. The study has potential application in sustainable land resource management, planning, and development.
Acknowledgments
The first author is thankful to the School of Earth Sciences, Punyashlok Ahilyadevi Holkar Solapur University, Solapur (formerly Solapur University, Solapur with Letter no. SUS/BCUD/PGBUTR/2014-15/12298 dated 10 March 2015) for providing Departmental Research Fellowship for the current study. The authors would also like to thank Earth Explorer (https://earthexplorer.usgs.gov) portal for providing Landsat TM and Landsat 8 OLI/TIRS data.
Disclosure statement
No potential conflict of interest was reported by the authors.
References
- Agency, E. (2007). Factors that influence erosion and runoff. Think Soils:Chapter 2 (pp 1-23). http://adlib.everysite.co.uk/resources/000/263/234/chapter2.pdf
- Alkharabsheh, M. M., Alexandridis, T. K., Bilas, G., Misopolinos, N., & Silleos, N. (2013). Impact of land cover change on soil erosion hazard in Northern Jordan using remote sensing and GIS. Procedia Environmental Sciences, 19, 912–921. https://doi.org/10.1016/j.proenv.2013.06.101
- Bashir, H., & Ahmad, S. S. (2017). Exploring geospatial techniques for spatiotemporal change detection in land cover dynamics along Soan River, Pakistan. Environmental Monitoring and Assessment, 189(5), 222. https://doi.org/10.1007/s10661-017-5935-1
- Basukala, A. K., Oldenburg, C., Schellberg, J., Sultanov, M., & Dubovyk, O. (2017). Towards improved land use mapping of irrigated croplands: Performance assessment of different image classification algorithms and approaches. European Journal of Remote Sensing, 50(1), 187–201. https://doi.org/10.1080/22797254.2017.1308235
- Bektas, B. F., & Goksal, C. (2005). Analysing and mapping of Bozcaada Island cover by means of remote sensing and GIS integration. In 25th EARSeL symposium and workshop, Porto, Portugal.
- Conrad, O., Bechtel, B., Bock, M., Dietrich, H., Fischer, E., Gerlitz, L., Wehberg, J., Wichmann, V., & Böhner, J. (2015). System for Automated Geoscientific Analyses (SAGA) v. 2.1.4. Geoscientific Model Development, 8(7), 1991–2007. https://doi.org/10.5194/gmd-8-1991-2015
- Farina, A. (1998). Principles of landscape dynamics. In In principles and methods in landscape ecology (pp. 113–128). Springer Netherlands. https://doi.org/10.1007/978-94-015-8984-0_6
- Gadrani, L., Lominadze, G., & Tsitsagi, M. (2018). F assessment of landuse/landcover (LULC) change of Tbilisi and surrounding area using remote sensing (RS) and GIS. Annals of Agrarian Science, 16(2), 163–169. https://doi.org/10.1016/j.aasci.2018.02.005
- Gregorio, A. D. (2016). Land cover classification system: Classification concept software version 3. Food and Agriculture Organization of United Nations, Rome.
- Hassen, E. E., & Assen, M. (2018). Land use/cover dynamics and its drivers in Gelda catchment, Lake Tana watershed, Ethiopia. Environmental Systems Research, 6(1), 4. https://doi.org/10.1186/s40068-017-0081-x
- Jayakumar, S., & Arockiasamy, D. I. (2003). Land use/land cover mapping and change detection in part of Eastern Ghats of Tamil Nadu using remote sensing and GIS. Journal of the Indian Society of Remote Sensing, 31(4), 251–260. https://doi.org/10.1007/BF03007345
- Kalpana, V. (2018). Analysis of rain fall and the temperature of Coimbatore district using land use and land cover change detection by image segmentation. Multimedia Tools and Applications, 77(23), 30487–30504. https://doi.org/10.1007/s11042-018-6125-z
- Kumar, S., Radhakrishnan, N., & Mathew, S. (2014). Land use change modelling using a Markov model and remote sensing. Geomatics, Natural Hazards and Risk, 5(2), 145–156. https://doi.org/10.1080/19475705.2013.795502
- Liu, Y., & Long, H. (2016). Land use transitions and their dynamic mechanism: The case of the Huang-Huai-Hai Plain. Journal of Geographical Sciences, 26(5), 515–530. https://doi.org/10.1007/s11442-016-1283-2
- Maharashtra State Data Bank. (2021). Information of major and medium irrigation projects. Reporting Year: 2011–12 http://mahasdb.maharashtra.gov.in [Accessed on 10 June 2021]
- Meiyappan, P., Dalton, M., O’Neill, B. C., & Jain, A. K. (2014). Spatial modeling of agricultural land use change at global scale. Ecological Modelling, 291, 152–174. https://doi.org/10.1016/j.ecolmodel.2014.07.027
- Meyer, W. B., & Turner, B. L. (1992). Human population growth and global land-use/cover change. Annual Review of Ecology and Systematics, 23(1), 39–61. https://doi.org/10.1146/annurev.es.23.110192.000351
- Mishra, P. K., Rai, A., & Rai, S. C. (2020). Land use and land cover change detection using geospatial techniques in the Sikkim Himalaya, India. The Egyptian Journal of Remote Sensing and Space Science, 23(2), 133–143. https://doi.org/10.1016/j.ejrs.2019.02.001
- Montanarella, L., Scholes, R., & Brainich, A. (2018). The IPBES assessment report on land degradation and restoration. Secretariat of the intergovernmental science-policy platform on biodiversity and ecosystem services. Intergovernmental Science-Policy Platform on Biodiversity and Ecosystem Services, Germany https://doi.org/10.4324/9781315640051-105
- Musaoglu, N., Tanik, A., & Kocabas, V. (2005). Identification of land-cover changes through image processing and associated impacts on water reservoir conditions. Environmental Management, 35(2), 220–230. https://doi.org/10.1007/s00267-003-0270-4
- Naikoo, M. W., Rihan, M., & Ishtiaque, M. (2020). Analyses of land use land cover (LULC) change and built-up expansion in the suburb of a metropolitan city: Spatio-temporal analysis of Delhi NCR using landsat datasets. Journal of Urban Management, 9(3), 347–359. https://doi.org/10.1016/j.jum.2020.05.004
- Oyedotun, T. D. T. (2019). Land use change and classification in Chaohu Lake catchment from multi-temporal remotely sensed images. Geology, Ecology, and Landscapes, 3(1), 37–45. https://doi.org/10.1080/24749508.2018.1481657
- Paiboonvorachat, C., & Oyana, T. J. (2011). Land-cover changes and potential impacts on soil erosion in the nan watershed, Thailand. International Journal of Remote Sensing, 32(21), 6587–6609. https://doi.org/10.1080/01431161.2010.512935
- Ramachandran, R. M., & Reddy, C. S. (2017). Monitoring of deforestation and land use changes (1925–2012) in Idukki district, Kerala, India using remote sensing and GIS. Journal of the Indian Society of Remote Sensing, 45(1), 163–170. https://doi.org/10.1007/s12524-015-0521-x
- Rautela, P., Rakshit, R., Jha, V. K., & Kumar, R. (2002). GIS and remote sensing-based study of the reservoir-induced land-use/land-cover changes in the catchment of Tehri dam in Garhwal Himalaya, Uttaranchal (India). Current Science, 83(3), 308–311.https://www.jstor.org/stable/24106890. Accessed 8 July 2021
- Saranya, K. R. L., & Reddy, C. S. (2016). Long term changes in forest cover and land use of Similipal Biosphere Reserve of India using satellite remote sensing data. Journal of Earth System Science, 125(3), 559–569. https://doi.org/10.1007/s12040-016-0685-y
- Sewnet, A., & Abebe, G. (2018). Land use and land cover change and implication to watershed degradation by using GIS and remote sensing in the Koga watershed, North Western Ethiopia. Earth Science Informatics, 11(1), 99–108. https://doi.org/10.1007/s12145-017-0323-5
- Suleiman, M. S., Wasonga, O. V., Mbau, J. S., & Elhadi, Y. A. (2017). Spatial and temporal analysis of forest cover change in Falgore game reserve in Kano, Nigeria. Ecological Processes, 6(1), 11. https://doi.org/10.1186/s13717-017-0078-4
- Thyagharajan, K. K., & Vignesh, T. (2019). Soft computing techniques for land use and land cover monitoring with multispectral remote sensing images: A review. Archives of Computational Methods in Engineering, 26(2), 275–301. https://doi.org/10.1007/s11831-017-9239-y
- USGS. (2020). Mapping, remote sensing, and geospatial data. https://www.usgs.gov/faqs/what-are-band-designations-landsat-satellites?qt-news_science_products=0#qt-news_science_products
- Usman, M., Liedl, R., Shahid, M. A., & Abbas, A. (2015). Land use/land cover classification and its change detection using multi-temporal MODIS NDVI data. Journal of Geographical Sciences, 25(12), 1479–1506. https://doi.org/10.1007/s11442-015-1247-y
- Yang, D., Fu, C.-S., Smith, A. C., & Yu, Q. (2017). Open land-use map: A regional land-use mapping strategy for incorporating OpenStreetMap with earth observations. Geo-Spatial Information Science, 20(3), 269–281. https://doi.org/10.1080/10095020.2017.1371385
- Zadbagher, E., Becek, K., & Berberoglu, S. (2018). Modeling land use/land cover change using remote sensing and geographic information systems: Case study of the Seyhan Basin, Turkey. Environmental Monitoring and Assessment, 190(8), 494. https://doi.org/10.1007/s10661-018-6877-y