
 ?Mathematical formulae have been encoded as MathML and are displayed in this HTML version using MathJax in order to improve their display. Uncheck the box to turn MathJax off. This feature requires Javascript. Click on a formula to zoom.
ABSTRACT
Flood-vulnerable area identification as a measure of comprehensive flood risk management was investigated in Itang District, Ethiopia, using Probability Distribution and Analytical Hierarchy Process. The former provided a best fit to the extreme value analyses. According to water discharge levels, the region was mapped at 5, 10, 25, 50, and 100 year intervals. The parameters processed were slope, elevation, land-use/land-cover, rainfall, discharge, and soil. Each criterion was evaluated with Analytical Hierarchy Process and mapped by GIS. Data were assorted into very high, high, moderate, low, and very low suitability classes representing 29.7%, 27.8%, 18.5%, 12.7%, and 11.4% inundation areas, respectively. The outcome was found to be extremely useful for evacuation planning, damage assessment, and loss estimation to minimize the disaster effects in the district.
1. Introduction
Flood is one of the most significant natural risks, often with enormous impact affecting 170 million people annually worldwide (Deepak et al., Citation2020; Guthrie & Cuervo, Citation2015; Kowalzig, Citation2008; Mezgebedingil & Suryabhagavan, Citation2018; Pathak & Olmo, Citation2021). According to the available data from 1900 to 2013, floods have caused ~7 million deaths and US $600 billion losses (Deng & Zhou, Citation2013). Moreover, flooding events are expected to increase in frequency and intensity in the coming years due to rising sea levels and climate change (IPCC, Citation2007, Citation2012; Jonathan et al., Citation2013; Stijn et al., Citation2013; UN International Strategy for Disaster Reduction (UNISDR), Citation2009). Therefore, determinations of optimum strategies are essential for appropriate flood management (Ballesteros-Cánovas et al., Citation2013).
Occurrence of the flood is a very complex phenomenon that always attracted researchers from different parts of the world to understand and explore its prevention and management mechanisms. Among anthropogenic factors triggering floods is increasing deforestation resulting from population pressure. Ethiopia receives maximum summer rainfall between June-August and leading to disastrous floods in some parts of the country (Abebe, Citation2007; Alemu, Citation2015; Amare & Okubay, Citation2019; Erena & Worku, Citation2018; Getahun & Gebre, Citation2015; Weldegebriel & Amphune, Citation2017). The Gambella region of Ethiopia experiences flood events almost every year, generally during the monsoon seasons (June–September). Over the last decade itself, many disastrous floods that affected human lives, property, agriculture, and other infrastructure, have occurred in the region. According to the most recent report from UNICEF (September 2017), floods affected mo re than 53,000 people in Gambella and Oromia regions during August and September, 2017. The most devastating flood events have been recorded in the years 2006, 2007, 2010, 2011, and 2012 (Haile et al., Citation2013). Bryan et al. (Citation2009) reported that climate change had intensified the spatiotemporal variability of rainfall, which posed serious threats to the local communities in the form of floods. In addition, complex topography of the region coupled with fragile socioeconomic conditions of the locals aggravated flood risk (Mezgebedingil & Suryabhagavan, Citation2018; Wang et al., Citation2019). These incidences are more intense in developing countries, with rapid urbanization and civilization along the rivers. Removal forests to build settlements and modify river courses are common practices in such regions, where such acts work as catalyst to flood occurrence (Bronstert, Citation2003; World Bank, Citation2010).
In flood assessments, estimation concerning the associated flood hazard and risk in terms of intensity, magnitude, and spatial/temporal distribution are of vital importance (Hong et al., Citation2018a; Shrestha & Lohpaisankrit, Citation2017; Tehrany et al., Citation2013, Citation2017). Over the past few decades, numerous methods have been developed and used to investigate flood hazards and risk assessment. However, any accurate prediction of the flood-prone areas is considered a difficult task due mainly to the complex and dynamic nature of floods (Chapi et al., Citation2017; Hong et al., Citation2018a; Kia et al., Citation2012; Rozalis et al., Citation2010). Classifying the existing models used in this hydrological phenomenon and the phases involved in the cycle, Devia et al. (Citation2015) distinguished them as empirical, conceptual, and physical models. According to the authors, empirical models are observation-oriented based on data and mathematical formulas. Most of the recent models mainly focused on hydrological models, hydrodynamic models, multi-criteria decision analysis (MCDA), statistical models (SM), and machine learning (ML) techniques incorporated into geographical information system (GIS; De Brito & Evers, Citation2016; Danumah et al., Citation2016; Elsafi, Citation2014; Feloni et al., Citation2020; Lee et al., Citation2012; Luu et al., Citation2018; Rahmati et al., Citation2016c; Rao, Citation2017; Shafapour Tehrany et al., Citation2017; Tehrany et al., Citation2014a; Thistlethwaite et al., Citation2018; Yang et al., Citation2014). Remote sensing and GIS tools are also important and have been used extensively for hazard assessment (Ashley et al., Citation2014; Barua et al., Citation2016; Fernández & Lutz, Citation2010; Islam & Sado, Citation2000a; Kia et al., Citation2012; Tehrany et al., Citation2014b). Studies have revealed that MCDA models are better suited for flood assessment. AHP is a popular model in the field of MCDA, because it can solve complex decision problem without any data (Danumah et al., Citation2016; Fernández & Lutz, Citation2010; Gigovi´c et al., Citation2017; Morea & Samanta, Citation2020; Samela et al., Citation2018).
Over the last two decades, remote sensing has played an increasing role in water resource management (Dewan et al., Citation2007; Mina & Ying, Citation2015; Winsemius et al., Citation2013; Tadesse et al., Citation2017). Geographic Information System (GIS) is also used extensively to model surface water and flood damage assessment (Ogato et al., Citation2020; Opolot, Citation2013; Rimba et al., Citation2017; Santillan et al., Citation2016). The Hydrologic Engineering Center’s River Analysis System (HEC-RAS) model developed by the U.S. Army Corps of Engineers (USACE) is generally used for investigating flooding and flood-related hazards worldwide (Azouagh et al., Citation2018; Brunne, Citation2016; Merz et al., Citation2004; Smith & Ward, Citation1998; U.S.Army Crops of Engineers, Citation2002). The present study was taken up to delineate flood zones and prepare flood hazard maps of the vulnerable areas of Itang District in Gambella Region of Ethiopia by integrating remote sensing, GIS, and hydraulic simulation model, HEC-RAS.
2. Materials and methods
2.1. Study area
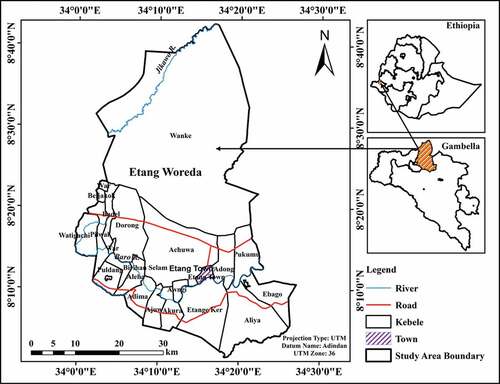
This study was conducted in the Itang District of the Gambella Region, located in the southwestern part of Ethiopia. Geographically it is situated between 08°00ʹ00”−08°45ʹ00” N latitude and 34°00ʹ00”−34°30ʹ00” E longitude covering a total area of 2190.42 km2 (). Elevation of the region ranges from 385.5 − 705.5 m asml. Annual rainfall ranges between 239.2 and 1883.7 mm with precipitation throughout the year, but mostly 85% between May and October. Average annual temperature in the region is 27.5°C. The Itang Special District encompasses 21 villages, most of which are situated in the flood plain zones of Baro river, the widest in Ethiopia. The study area experienced disastrous floods in 2006, 2007, 2010, 2011, and 2012 with adverse impacts on people’s lives, property, agriculture, and infrastructure (Haile et al., Citation2013). During the summer season, heavy rainfall causes floods in the region, and sometimes the monsoon’s unusual activity causes high surface run-off with peak discharge.
Figure 1. Location map of the study area.
2.2. Data and methods
Spatial inputs such as topographic data that include DEM, satellite image, and hydrologic data covering discharge and population data were used for this study. Recent highly accurate topographic data were utilized. Rainfall data were collected from National Meteorological Agency (NMA), Ethiopia. Landsat 8 Operational Land Imager (OLI) satellite data of 2017 with path171and row 054 were downloaded from United States Geological Survey (USGS, https://glovis.usgs.gov). Digital elevation model (DEM) data with spatial resolution of 30 m were also obtained from the same source. The slope layer was extracted from DEM. Details of the data sources and their specifications are mentioned in . The satellite image was projected in UTM projection zone 36 N and Adindan datum. In the present study, ERDAS Imagine, ArcGIS and ArcHydro software were used for flood hazard analysis. HEC-GeoRAS pre-processing was then completed, and the final output from the ArcGIS, and HEC-GeoRAS was processed in the HEC-RAS 1D steady flow simulation. Overall methodological framework and data analysis are presented in .
Figure 2. Flow chart of the methodology.
Table 1. Dataset and sources.
2.3. Field data and sampling
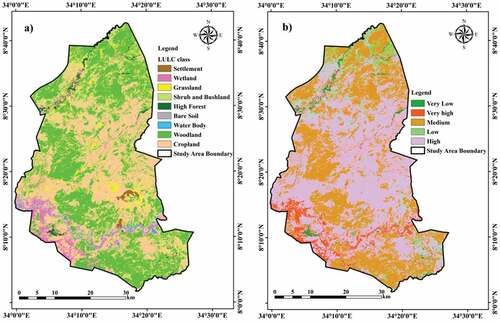
Land-use/land-cover information was obtained from the multiband Landsat imagery through image interpretation and classification (Li et al., Citation2014). A total of eight land-use/land-cover classes, namely, cropland, woodland, grassland, wetland, forest, shrubland, settlement, and water body, were identified as proposed by Anderson et al. (Citation1976). With the complementary use of satellite navigation system (GPS), post-classification field visits were performed for ground validation of ambiguous spots and further refinement of the land-use/land-cover classification. Training flood locations (150 points) were selected randomly to produce dependent data, which was made up of 0 and 1 values, with 1 representing the existence of flood and 0 its absence of flooding. Additionally, the same numbers of points (150) as flood locations were selected as non-flooded areas with an assigned value of 0.
2.4. Flood frequency analysis from hydrologic data
Database on past floods is important to the study of the relationship between different flood triggering factors and their occurrence (Kia et al., Citation2012; Merz et al., Citation2014). Flood frequency analysis is a statistical measure of the probable occurrence of the flood of a given magnitude. The probability of occurrence for the large and destructive floods is low compared to small and less destructive ones. Moreover, the accuracy of the flood susceptibility mapping greatly relies on the accuracy of previous flood events (Merz et al., Citation2014). It is possible to calculate probability of major and destructive floods in terms of stream water discharge for a specified time (Khosravi et al., Citation2016). As indicated in the flowchart, two flood frequency methods, namely, Gumbel distribution and Log Pearson Type III, were used for the study. The choice of these methods was based on two cogent reasons. The first is the lack of appropriate river runoff data, which makes it inevitable to utilize the most ecologically and hydrologically fit measure. The second is to provide a suitable hydrologic inundation procedure that will generate the actual water level threshold for flood mapping purposes (Subramanya, Citation2008).
2.4.1. Gumbel distribution
First introduced in 1914 by Gambel, this is the most common and widely known probability analysis, especially in meteorological and hydrological studies related to flood predictions. Gumbel defined flood as the largest of the 365 daily flows. The annual series of flood flows constitute a chain of the largest values of flows. In this study, an attempt was made to compute water levels at 5, 10, 25, 50, and 100 return periods. Gumbel’s equation is given as:
where XT stands for the value of variate with a return period ‘T”, X avg for mean of the variate, STDV for standard deviation of the sample, K for frequency factor expressed as K= YT-Yn/Sn or = YT-0.577/1.2825 with YT reduced variate of a given return period “T” given by YT = – (LN*LN (T/T-1)) or = -(0.834 + 2.303log.log(T/T-1)).
here T is return period, Yn is reduced mean obtained from Gumbel frequency table and Sn is reduced standard deviation.
2.4.2. Log–Pearson type III
Log-Pearson type III distribution, first proposed by Foster in 1924 and revised later in 1967 by U.S. Weather Resources Council is widely used in hydrologic frequency analysis, particularly for flood peak data (Lee et al., Citation2012; Rao, Citation2017). The distribution is a three-parameter gamma function with a logarithmic transform of the variable. The log-Pearson Type III distribution differs from most other distribution methods in that the three parameters mean (Za), standard deviation (STDV), and the coefficient of skew (K) are necessary to describe the distribution.
The designed Log Pearson Type III for this study is expressed as
where Kz is frequency factor taken from table with coefficient of skew values “Cs” at recurrence interval “T,” STDV Standard Deviation of the “Z” variate sample and Za mean of the “ZT” variate.
where Cs is coefficient of skew of variate “Z,” N sample size i.e., number of years of record.
After finding Za with the equation above, the corresponding value of XT is obtained as Antilog of ZT.
where n is number of samples (years), m is rank of a given gauge level.
2.5. Flood inundation area mapping
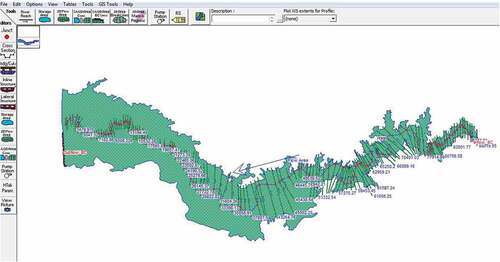
River geometry information is an essential and important requirement in developing flood inundation areas using the HEC-GeoRAS/HEC-RAS hydraulic modeling software. HEC-RAS can model the steady and unsteady hydraulic analysis, and in the present instance, the former was modeled. Basic river geometries required in flood modeling include river cross-sections, stream centerlines, bank lines, flow lines, and other information. Necessary river geometry was extracted after the creation of Triangulated Irregular Network (TIN) from DEM. They are extracted from developed TIN of the study area for the HEC-GeoRAS model. Manning’s n value for individual cross-sections was acquired after the land-use/land-cover map of the study area. After RAS geometry data preparation, HEC-GeoRAS model was used to generate a RAS GIS file (final river geometry file) used as input for HEC-RAS (). After checking the river cross-section and editing its geometry based on field verification, the final correction of the river geometry file in the HEC-RAS model was carried out. Then highest flows were imported from the Itang gauging station to generate water levels for different return periods.
Figure 3. The Baro river geometry map.
2.6. Flood hazard assessment
In the present study, historical flood records along with yearlong discharge data were used for flood hazard assessment (FHA). Historically, 2007 is one of the high flooding times that hit Itang, causing severe damage. The FHA comprises six criteria, viz., elevation (C1), precipitation (C2), slope (C3), drainage density (C4), soil type (C5), land-use/land-cover (C6). The selection of these parameters is theoretically based on their relevance to flood hazards documented in the literature (Haan et al., Citation1994). Input data for each parameter is processed in the GIS environment, and the six parameters. The acquired values are processed in order to calculate the relative significance of each criterion and the corresponding weightage factor (w). Following the calculation of weights, FHA was calculated using EquationEquation (5)(5)
(5) .
where ri is rating of the parameter in each point, wi is weightage of each parameter, n is number of the criteria.
2.7. Analytical hierarchy process (AHP)
Weightage of each parameter is defined by following the Analytical Hierarchy Process (AHP; Saaty, Citation1990a, Citation1990b). With the use of AHP, the relevant factor’s relative significance was obtained after the construction of a pairwise comparison matrix (Mu & Pereyra-Rojas, Citation2017). The rating score of relative significance was set up from 1 to 9, indicating less importance to much more importance of the factor in that order ().
Table 2. Saaty’s fundamental scale of absolute numbers.
2.8. Pairwise comparison
In the matrix of pairwise comparison, each of the criteria is considered a causative factor of flooding in Itang compared to the practice in other places, where only one of the two criteria is expected to have more influence. In the comparison, all the criteria did not exercise the same influence. For example, if both criteria C1 and C2 had the same influence, the pair received an index of 1. But when compared to criterion C2, if criteria C1 had come up with more influence, then the pair received its value as any rating between 9 to 2 (). According to Saaty (Citation1990a), criteria rating below or equal to 0.1 is an acceptable reciprocal matrix, whereas a ratio over 0.1 unacceptable compelling a reexamination of the matrix. To identify and locate inconsistent decisions with regard to their importance, pairwise comparisons were relied.
Table 3. Normalized matrix of flood factors for Itang District.
2.8.1. Consistency check
Consistency of the created eigenvector matrix for AHP was evaluated. The required level of consistency was evaluated using the following index:
where CR is consistency ratio, CI consistency index, and RI random index.
For the values in , random consistency indices (RI) are tabulated. Thus, in this study, the RI = 1.25. The acceptable CR must be < 0.1. CI is calculated using EquationEquation (7)(7)
(7) where calculated λmax = 6.55.
Table 4. Random index used to compute consistency ratios.
Eventually, calculated consistency ratio 0.087 is lower than the threshold value of 0.1, thus affirming the weightage consistency.
3. Results
3.1. Flood frequency
Flood frequencies were obtained from Gumbel’s distribution for different year return periods (YRPs) prepared based on the log chart. They recorded historical peak discharge for different years were presented in . The discharges predicted by Gumbel’s distribution for 5, 10, 25, 50 and 100 year return period flood were 1394 m3/s, 1535 m3/s, 1712 m3/s, 1844 m3/s, and 1974 m3/s, respectively while, calculated discharge of the Baro River from log-Pearson Type III distribution were 1389 m3/s, 1432 m3/s, 1461 m3, 1473 m3/s, 1480 m3, respectively. These flood discharges were tested for their goodness of fit through Chi-square test statistic. Accordingly, log-Pearson Type III distribution showed low Chi-Square result (3.836), at a P value of 0.429, thereby revealing that it is not significant at a P-value ≤0.05, whereas Gumbel’s distribution showed a Chi-Square of 127.959, at a P value of <0.001.
Table 5. Gumbel based water discharge (m3/s) at Itang District.
Table 6. Log-Pears Type III based water discharge.
3.2. Flooded inundation map
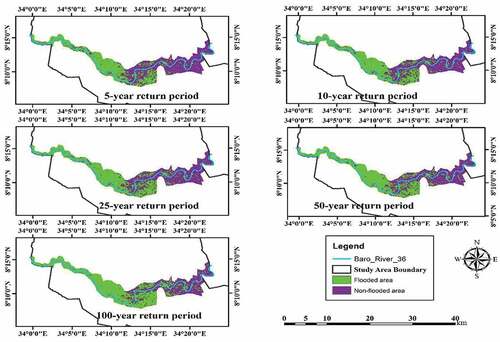
Results of model sensitivity to changes at selected intervals are presented in . Based on the result of HEC-RAS, elevation of water column of the areas that would be inundated within 5, 10, 25, 50, and 100 year recurrence intervals were identified. And then, the mean elevation of these areas was calculated further to combine them with each recurrence interval’s water levels. The average elevation of the water columns thus arrived for various recurrence intervals was found to be 413.99 m, 414.21 m, 414.45 m, 414.82 m, and 415.58 m, respectively, for 5, 10, 25, 50, and 100 years. This information will help predict the extent of flood inundation areas. Accordingly, if floods arise at recurrence intervals of 5, 10, 25, 50, or 100 years, inundation is expected to ensue in areas with elevation lower than the computed mean water levels. depicts areas likely to be inundated within previously indicated recurrence intervals. Accordingly, 76.66 km2, 80.78 km2, 84.15 km2, 87.34 km2 and 100.34 km2 of land areas are predicted to be inundated by floods at 5, 10, 25, 50, and 100 years of recurrence intervals. From these inundation maps, locations found along the Baro River banks, especially the flat flood plain area to the west of the study area, are predicted to flood during all five recurrence intervals.
Figure 4. Water surface of different recurrence intervals obtained through HEC-RAS.
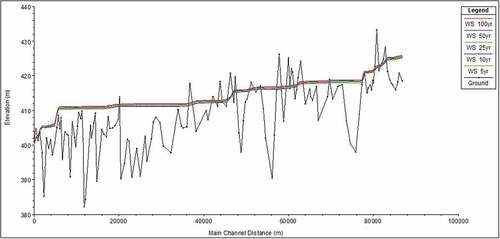
Figure 5. Flood inundation area of different recurrence intervals.
3.3. Flood factors
The occurrence of a flood depends on several topographic and climatic factors of an area. Combined assessment of all known factors using modern techniques can provide a detailed picture of the flood hazard vulnerable locations to different magnitudes.
3.3.1. Elevation and slope
Water flows from higher to lower elevations, and therefore slope influences the amount of surface runoff and infiltration. Flat areas in low elevations may flood quicker than areas in higher elevations with a steeper slope. Naturally, low slopes and low elevation have been assigned the highest rating as flood-prone areas. The elevation of an area can be divided into five classes. The results of reclassified elevation based on the natural break (Junk) indicate that about 776.52 km2 (35.67%) of Itang has low elevation and is very highly prone to flooding, 567.96 km2 (26.09%) highly prone, 440.48 km2 (35.67%) medium prone, 263.67 km2 (12.11%) low prone and 128.23 km2 (5.89%) very low prone to flooding ()). From among different places in the district, areas with lower elevations are more exposed to flood hazards. Areas found along the flood plain of the Baro River and low land areas bordering with Lare, in Gambella region in the western part of the study area are more affected by flooding.
Figure 6. Reclassified maps (a) elevation and (b) slope.
Localities to the east of the study area (upstream of the Baro) that merge with the adjacent lands experience relatively limited flooding compared to longer continuous flat slope areas found downstream the river ()). The gradient of the study area can be divided into five slope classes, viz., very low (>20°), low (10 − 20º), moderate (7 − 9°), high (4 − 6º), and very high (0 − 3°) slopes, respectively.
3.3.2. Rainfall
Rainfall has a significant relationship with river discharge, and it directly influences the occurrence of floods. The spatial distribution of rainfall intensity is considered based on the allocation of stations in the study area. Heavy rainfall from the region and surrounding highland Oromiya regions is the main cause of the Baro river’s flooding in the southwestern part of the area, with relatively lower precipitation than the northern and eastern parts. Thus annual rainfall in the study area was more than 1800 mm in some places, whereas it was less than 481.6 mm in other places. presents the areas with very high and high rainfall in high lands, especially the northern and northeastern parts adjoining with the surrounding Oromiya Zone. According to reclassified data, 304.11 km2 or 13.97% of Itang received high rainfall, followed by 885.66 km2 or 40.7% medium rainfall and 814.24 km2 or 37.41% low rainfall. The areas receiving very low and very high rainfall in Itang accounted for 49.72 km2 or 2.28% and 122.59 km2 or 5.63%, respectively ().
Figure 7. Reclassified rainfall map.
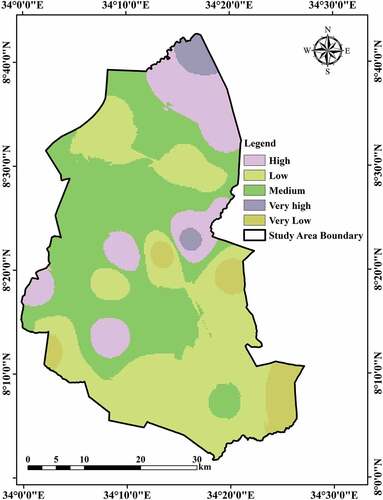
Table 7. Reclassified rainfall of Itang.
3.3.3. Drainage
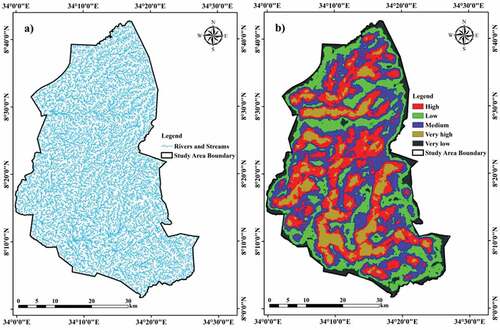
The reclassified drainage density map of Itang shows that 253.35 km2 (11.64%) is of very high, 551.41 km2 (25.34%) high, 681.32 km2 (31.31%) with medium 513.49 km2 (23.6%) low, and 176.36 km2 (8.1%) very low density (). As per the adopted reclassification, areas around big rivers like the Baro River have very high drainage density. Drainage density of the study area was calculated to be 2.5 km/km2.
Figure 8. Drainage map (a), and reclassified drainage density map (b).
3.3.4. Land-use/land-cover
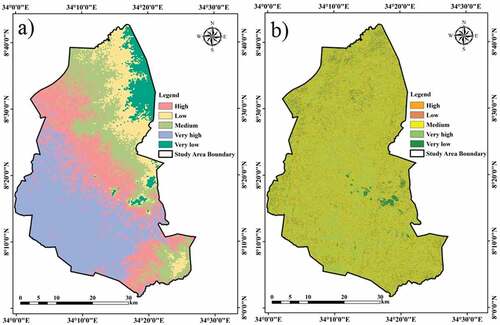
Land-use/land-cover influences the infiltration rate, depending upon the interrelationship between surface water groundwater and debris flow. While forests and lush vegetation favor rainwater infiltration, urban land supports surface overflow. Land-use/land-cover of the study area reveals eight major types of land-use/land-cover: cropland, woodland, grassland, wetland, forest, shrubland, settlement, and water body (). Vegetation cover in Itang has reduced mainly due to increased large- and small-scale agricultural activities and this promotes runoff due to increase in paved surfaces. The moisture content of the land also affects the flooding condition. Lands with low moisture content have the capability of absorbing more water compared to areas with higher moisture content. Wetlands along the Baro and adjacent areas of Lare are highly affected by flooding. Of the total study area, 1069.9 km2 (49.2%) of land is covered by cropland, followed by woodland 798 km2 (36.7%) of area. Wetland, grassland/bare soil, forest and water body share 83.9 km2 (3.9%), 60.7 km2 (2.8%), 36 km2 (1.7%), and 14.7 km2 (0.7%), respectively. The remaining area covers settlement and shrubland with 12.1 km2 (0.6%), 7 km2 (0.46%) of area, respectively. Accuracy assessment result for land-use/land-cover for 2017 shows an overall precision was 90.6% with Kappa equal to 0.86.
Figure 9. Land-use/land-cover map (a), and reclassified land-use/land-cover map (b).
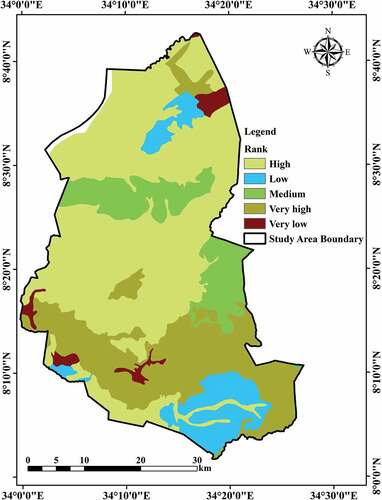
3.3.5. Soil
The nature of the soil in a given area can influence the flood condition and possibly determine the infiltration capacity. According to the soil classification of MoWIEE, most of the different soil types (1149.5 km2) in Itang are highly vulnerable to floods because of their nature, i.e., Dystric and Eutric Fluvisols that occupy 53.2% of the area (). The Dystric and Chromic Cambisols, located in a very high flood zone, cover 514.2 km2 or about 23.8%, whereas Dystric and eutric Plinthosols, classified as soil type of medium flood hazard zone, cover an area of 252.5 km2 (11.7%). About 195.4 km2 (9.1%) and 47.6 km2 (2.2%) of the land are coved with Planosol and Eutric Gleysol soils of low and very low flood-prone types.
Figure 10. Reclassified soil map.
3.4. Flood hazard assessment
describes the flood hazard zones levels and the corresponding degrees of flood risk susceptibility. Out of a total area of 2145.4 km2, 12.7% falls in the category of “very high” flood susceptibility risk, followed by 27.8% high risk, 29.7% medium risk, 18.5% low risk, and 11.3% low risk categories. Validation of the output maps was tested by overlaying selected flood-prone area field verification (). Local people were interviewed to decipher previous flood conditions and the damages they caused. Areas within the flood plain were affected by the land-use/land-cover characteristics. In order to understand the status of flood hazard in various Kebeles of the Itang District, the flood hazard map was corroborated with the Kebeles. Accordingly, out of 21 Kebeles in the area, six (Itang Town, Birhan Selam, Puldang, Ajuw, Akura and Awngi) are situated in the very high flood zone, and ten Kebeles (Watigachi, Pilwal, Beljakok, Dorong, Aleha, Adima, Etange Ker, Achuwa, Pukumu, and Ebago) high flood zone. War, Badel, Adong, and Aliya are rural Kebeles that fall in medium flood zone, whereas Wanke, the less affected Kebele, is located in low hazard zone. These observations coincide with the Itang District officials’ information except for their classification as high and medium flood vulnerable Kebeles.
Figure 11. Flood hazard map.
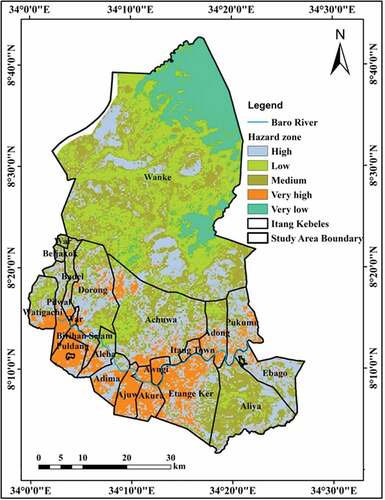
Table 8. Flood hazard coverage.
Further, the results of land-use/land-cover classes and their spatial distribution in flood hazard zone are validated to find out flood vulnerable in the region. Cropland: Majority (351.53 km2) of the total cropland extending to is located in high flood hazard zone, followed by 321 km2 (30.27%) in medium hazard zone and 168 km2 (15.84%) low hazard, 155.8 km2 in low and 64.12 km2 very low hazard zones. Grassland: Of the total area covered by grassland/bare soil, 21.82 km2 (36.18%) in found in medium hazard zone, 15.99 (26.52%) in high, 14.7 (24.38%) in low, 3.91 (6.48%) in very low and 3.88 km2 (6.44%) in very high hazard zones. Forest: Of the land covered by forest, 9.19 km2 (25.95%) in located in medium flood hazard zone, whereas 8.82 km2 (24.95%) in high, 7.96 km2 (22.48%) in very low, 5.5 km2 (15.53%) in low and 3.94 km2 (11.14%) in very high hazard zones, respectively. Settlement: Of the settlement areas 5.92 km2 (49.17%) is located in high, 3.5 km2 (29.05%) in medium, 2.34 km2 (19.44%) in very high, 0.25 km2 (2.06%) in low and 0.03 km2 (0.28%) in very low hazard zones. Shrub land: Majority (30.88 km2 or 31.67%) of the total land covered by shrub and bush class is located in very low hazard zone, whereas 26.42 km2 (27.1%), 23.35 km2 (23.94%), 15.67 km2 (16.07%) and 1.19 km2 (1.22%) are found in medium, low, high and very high hazard zones, respectively. Waterbody: An extent of 6.88 km2 (47.82%) of land area covered by water bodies is located in high flood hazard zone and 2.31 km2 (16.06%) in medium hazard zone. Areas found in very high, low, and very low hazard zones are 2.31 km2 (16.06%), 1.46 km2 (10.15%), and 0.15 km2 (1.04%), respectively.
Wetland: The land-use/land-cover class “wetland” found along river banks and to the western corner of the study area highly prone to flood in Itang. Of the total wetlands, 44.69 km2 (54.03%) is located in the very high flood hazard zone followed by 28.22 km2 (34.12%) high hazard, 2.6 km2 (3.15%) medium hazard, 2.6 km2 (3.15%) in low and 1.01 km2 (1.23%) in very low hazard zones. Woodland: Of the second dominant land-cover class, the woodland in the study area; 244.92 km2 (31.3%) lies in medium, 180.67 km2 (23.09%) in low, 162.96 km2 (2082%) in high, 136.39 km2 (17.43%) in very low and 57.6 km2 (7.36%) in very high flood hazard zones.
3.5. Model validation
Many models are used by researchers to analyze flood susceptibility in various regions of the world, but it is essential to validate the results of the model in order to that the model is representing a true ground situation or the recorded observations sufficiently. Model calibration and validation can be done by comparing model output with observed data. For the study area there are no available observed stream flows. Therefore, the results of the success rate were obtained using a training dataset, while its prediction accuracy was calculated using the validation dataset not employed in the training process.
4. Discussion
The methodology proposed for the estimation of flood hazard areas is a useful tool for the mitigation of the devastating impact of floods. Flood hazard is damage to the development and people from flooding. The effects of floodwaters are dangerous to personal safety, infrastructure, and agricultural lands in the area (Asare-Kyei et al., Citation2015; Daffi et al., Citation2014; Das, Citation2019). Studies on flood hazard assessment will contribute basic and essential information on floods to the people, flood maps preparation by civil protection in advance and help or safety planning purposes has also become widely understood (Pagliara, Citation2006; Tien Bui et al., Citation2019). Itang is one of the flood-prone locations in Ethiopia and hence flood hazard assessment and mapping was carried out through remote sensing and GIS. Flood triggering factors such as slope, elevation, rainfall data, discharge data, soil type data, and land-use/land-cover data were evaluated giving weightage to adopted techniques of AHP. Consistency of the weightages given for each of the criteria used was also checked by means of consistency ratio before applying MCE technique employed for the preparation of final flood hazard map. Accordingly, hydrological simulations under different flood scenarios can be a valuable tool, especially in areas where such data are available. An additional contribution of flood simulation models is a direct estimation of the role of the various criteria in a flood event (Huang et al., Citation2014; Zou et al., Citation2013). A further step is the estimation of the peak discharge and exceedance probability at locations where flood hazard is high/very high. Thus, advanced information related to flood hazard areas will easily reach the local people through flood hazard maps (Bui et al., Citation2019; Haq et al., Citation2012). And this will aid the people in summoning awareness about the vulnerable areas surrounding their habitats and croplands.
Through flood hazard studies, lower areas around the rivers can be categorized into a series of hazard zones based on the level and extent of flooding (Khosravi et al., Citation2018; Pradhan, Citation2010). Due to this study, the Itang district, subjected to different flood levels, was classified into very high, high, medium, low, and very low hazard zones. From the flood hazard map prepared, almost all the areas along the Baro river, mainly those downstream, were more exposed to flooding. The terrain of these areas are generally flat compared to other parts of the district. Twenty of the twenty-one Kebeles found in Itang are all situated within this Baro flood plain. During the field data collection, especially in areas close to Itang town and accessible surrounding rural Kebeles, various activities of the people were observed. The population lives along the river carrying out different economic activities. Agricultural and fishing are practiced more in these areas, these activities are severely affected in the event of flooding. Further, disruption in transportation and commutation in the area due to flooding, different commercial practices also get utterly disrupted for a prolonged period, resulting in several difficulties, including communication and food availability.
In general, flooding has a long history in Itang and Gambella region (Haile et al., Citation2013; Woube, Citation1999). Historical records indicate that flooding has increased over the years, becoming a common annual phenomenon in the region. High rainfall from June-September and at times to October is the major factor causing floods. According to information from Disaster Preparedness and Prevention (DPP) office of the Gambella, an estimated 40,000 people have been affected by floods in the eleven chronically flood-prone districts, viz., Gog, Jor, Lare, Itang, Wanthoa, Akobo, Jikaw, Makuey, Dimma, Abobo, and Gambella of the region besides Gambella town in the year 2017. However, evidences obtained from the local people and different reports indicate that there are not enough disaster preparedness and prevention strategies in the district. On the other hand, structural measures were also not taken even by the regional government due to poor economy of the country in general (Abaya et al., Citation2009; Wondim, Citation2016). Relocation strategy is considered as a common solution to the flooding problem. Information obtained from the local people discloses that people are accommodated in schools, and churches, while others migrate to the highway/road at the time of flooding. Therefore, every need for the adoption of additional strategies should be applied to cope with the flooding situation of the area to keep the crops safe and the people comfortable during difficult times based on the facts and figures generated during this study.
Warm weather conditions of the Gambella region constrain people of the area to settle close to rivers for want of water. However, these locals’ settlement is not planned but happens devoid of any cognizance of the imminent hazard. Therefore, sufficient knowledge should be generated including land-use plan of the area so as to mitigate or thwart flood problems in the area. Adjei-Darko (Citation2017) suggested preparation of integrated drainage master plan considering the existing built-up spaces, expanses currently under development and future development zones will benefit in such (flood hazard) occasions. With regard to preparedness, anticipated flood events need to be appropriately estimated based on satellite imageries, updated rainfall intensity and its duration. Therefore, an integrated design for the land resources management, especially for flood hazard areas is desirable. An integrated design is important for decision-making as, creates a roadmap for the required flood mitigation measures. However, it is beyond the scope of the present study to conduct a study with in-depth methodological changes on different parameters, assuming the pros and cons of this model (Bui et al., Citation2016, Citation2019; Seejata et al., Citation2018). Parameters can be added or removed according to local hydrogeological, hydrological, and morphological characteristics.
5. Conclusion
Flooding is a serious, catastrophic event that can occur practically anywhere along river courses, especially downstream. Controlling flood effects through appropriate management is a crucial consideration worldwide. The main aim of the present study is to delineate flood-prone areas of Itang and identify more vulnerable areas through integration of remote sensing and GIS techniques. Multi-criteria method was applied in combining the decision measures i.e., elevation, slope, rainfall, drainage density, land-use and land-cover and soil type used in this study. Based on the methodologies adopted for the study, majority of the area along the Baro river is found to experience high level of flooding. The whole of Itang district experienced flood hazard of different magnitudes right from very high to very low level. About 271.8 km2 (12.7%) of the total land area was noted to be lying in the very high flood hazard zone. Overall, the classification results were favorable though certain deficiencies in its application. The information and the knowledge gained from the outcomes of the present study would assist local authorities and government agencies accurately identifying the flood susceptible areas and help in implementing appropriate flood management plans in such localities.
Acknowledgments
We are thankful to the head and staff of the School of Earth Sciences, College of Natural and Computational Sciences, Addis Ababa University, for providing all kinds of necessary facilities and support during the present study. We are also thankful to Ministry of Water, Irrigation and Electricity of Ethiopia and Gambella Disaster Preparedness and Prevention Office for providing all the necessary data required for the present study. The authors are thankful to the National Meteorological Agency for providing rainfall data. The authors would like to thank reviewers for their insightful suggestions and careful reading of the manuscript.
Disclosure statement
No potential conflict of interest was reported by the author(s).
References
- Abaya, S. W., Mandere, N., & Ewald, G. (2009). Floods and health in Gambella region, Ethiopia: An assessment of the strength and weakness of the coping mechanisms. Good Health Action, 2(1), 1–10. https://doi.org/10.3402/gha.v2i0
- Abebe, F., (2007). Flood Hazard Assessment Using GIS in Becho Plain, Upper Awash Valley, South West of Addis Ababa. Addis Ababa [Unpublished MSc Thesis]. Addis Ababa University.
- Adjei-Darko, P. (2017). Remote sensing and geographic information systems for flood risk mapping and near real-time flooding extent assessment in the greater Accra metropolitan area. Environmental Science, 1–75. doi: diva2%3A1087549
- Alemu, Y. T. (2015). Flash flood hazard in Dire Dawa, Ethiopia. Journal of Social Science and Humanities, 1(4), 400–414.
- Amare, G. N., & Okubay, G. A. (2019). Flood hazard risk vulnerability mapping using Geo-spatial and MCDA around Adigrat, Tigray Region, Northern Ethiopia. Momona Ethiopian Journal of Science, 7(1), 90–107. http://dx.doi.org/10.4314/mejs.v11i1
- Anderson, J.R., Hardy, E.E., Roach, J.T., & Witmer, R.E. (1976). A land-use and land-cover classification system for use with remote sensor data. US Geological Survey Professional Paper 964, Washington, DC.
- Asare-Kyei, D., Forkuor, G., & Venus, V. (2015). Modeling flood hazard zones at the sub-district level with the rational model integrated with GIS and remote sensing approaches. Water, 7(7), 3531–3564. https://doi.org/10.3390/w7073531
- Ashley, W. S., Strader, S., Rosencrants, T., & Krmenec, A. J. (2014). Spatiotemporal changes in tornado hazard exposure: The case of the expanding bull’s-eye effect in Chicago, Illinois. Weather, Climate, and Society, 6, 175–193. https://doi.org/10.1175/WCAS-D-13-00047.1
- Azouagh, A., El Bardai, R., Hilal, I., & Stitou El Messari, J. (2018). Integration of GIS and HEC-RAS in floods modeling of Martil River (Northern Morocco). European Scientific Journal, 14(12), 130. https://doi.org/10.19044/esj.2018.v14n12p130
- Ballesteros-Cánovas, J. A., Sanchez-Silva, M., Bodoque, J. M., & Díez-Herrero, A. (2013). An integrated approach to flood risk management: A case study of Navaluenga (Central Spain). Water Resources Management, 27(8), 3051–3069. https://doi.org/10.1007/s11269-013-0332-1
- Barua, U., Akhter, M. S., & Ansary, M. A. (2016). District-wise multi-hazard zoning of Bangladesh. Natural Hazards, 82(3), 1895–1918. https://doi.org/10.1007/s11069-016-2276-2
- Bronstert, A. (2003). Floods and climate change: Interactions and impacts. Risk Analysis, 23(3), 545–557. https://doi.org/10.1111/1539-6924.00335
- Brunne, G. W. (2016). HEC-RAS, River analysis system hydraulic reference manual. US Army Corps of Engineers Hydrologic Engineering Center.
- Bryan, E., Deressa, T. T., Gbetibouo, G. A., & Ringler, C. (2009). Adaptation to climate change in Ethiopia and South Africa: Options and constraints. Environmental Science & Policy, 12(4), 413–426. https://doi.org/10.1016/j.envsci.2008.11.002
- Bui, D. T., Pradhan, B., Nampak, H., Bui, Q. T., Tran, Q. A., & Nguyen, Q. P. (2016). Hybrid artificial intelligence approach based on neural fuzzy inference model and metaheuristic optimization for flash flood susceptibility modeling in a high-frequency tropical cyclone area using GIS. Journal of Hydrology, 540(11), 317–330. https://doi.org/10.1016/j.jhydrol.2016.06.027
- Bui, D. T., Tsangaratos, P., Ngo, P. T. T., Pham, T. D., & Pham, B. T. (2019). Flash flood susceptibility modeling using an optimized fuzzy rule based feature selection technique and tree based ensemble methods. Science of the Total Environment, 668, 1038–1054. https://doi.org/10.1016/j.scitotenv.2019.02.422
- Chapi, K., Singh, P. V., Shirzadi, A., Shahabi, H., Tien Bui, D., Pham, T. B., & Khosravi, K. (2017). A novel hybrid artificial intelligence approach for flood susceptibility assessment. Environmental Modelling & Software, 95, 229–245. https://doi.org/10.1016/j.envsoft.2017.06.012
- Daffi, R. E., Otun, J. A., & Isamail. (2014). Flood hazard assessment of River Dep floodplains in North-Central Nigeria. The International Journal of Water Resources and Environmental Engineering, 6(2), 67–72. https://doi.org/10.5897/IJWREE2013.0457
- Danumah, J. H., Odai, S. N., Saley, B. M., Szarzynski, J., Thiel, M., Kwaku, A., Kouame, F. K., & Akpa, L. Y. (2016). Flood risk assessment and mapping in Abidjan district using multi-criteria analysis (AHP) model and geoinformation techniques (Cote D’Ivoire). Geoenviron Disasters, 3(10), 1–13. https://doi.org/10.1186/s40677-016-0044-y
- Das, S. (2019). Geospatial mapping of flood susceptibility and hydro-geomorphic response to the floods in Ulhas Basin, India. Remote Sensing Applications: Society and Environmenthttps, 14, 60–74. https://doi.org/10.1016/j.rsase.2019.02.006
- De Brito, M. M., & Evers, M. (2016). Multi-criteria decision-making for flood risk management: A survey of the current state of the art. Natural Hazards and Earth System Sciences, 16(4), 1019–1033. https://doi.org/10.5194/nhess-16-1019-2016
- Deepak, S., Rajan, G., & Jairaj, P. G. (2020). Geospatial approach for assessment of vulnerability to flood in local self governments. Geoenviron Disasters, 7(1), 35. https://doi.org/10.1186/s40677-020-00172-w
- Deng, W. P., & Zhou, J. Z. (2013). Approach for feature weighted support vector machine and its application in flood disaster evaluation. Disaster Advances, 6(4), 51–58.
- Devia, G. K., Ganasri, B. P., & Dwarakish, G. S. (2015). A review on hydrological models. Aquatic Procedia, 4, 1001–1007. https://doi.org/10.1016/j.aqpro.2015.02.126
- Dewan, A. M., Islam, M. M., Kumamoto, T., & Nishigaki, M. (2007). Evaluating flood hazard for land-use planning in Greater Dhaka of Bangladesh using remote sensing and GIS techniques. Water Resources Management, 21(9), 1601–1612. https://doi.org/10.1007/s11269-006-9116-1
- Elsafi, S. H. (2014). Artificial neural networks (ANNs) for flood forecasting at Dongola station in the River Nile Sudan. Alexandria Engineering Journals, 53(3), 655–662. https://doi.org/10.1016/j.aej.2014.06.010
- Erena, S. H., & Worku, H. (2018). Flood risk analysis: Causes and landscape based mitigation strategies in Dire Dawa city, Ethiopia. Geoenviron Disasters, 5(1), 16. https://doi.org/10.1186/s40677-018-0110-8
- Feloni, E., Mousadis, I., & Baltas, E. (2020). Flood vulnerability assessment using a GIS-based multi-criteria approach- The case of Attica region. Journal of Flood Risk Management, 13(Suppl.1), 1–15. https://doi.org/10.1111/jfr3.12563
- Fernández, D., & Lutz, M. (2010). Urban flood hazard zoning in Tucumán Province, Argentina, using GIS and multicriteria decision analysis. Engineering Geology, 111(1–4), 90–98. https://doi.org/10.1016/j.enggeo.2009.12.006
- Getahun, Y. S., & Gebre, S. L. (2015). Flood hazard assessment and mapping of flood inundation area of the Awash River Basin in Ethiopia using GIS and HEC-GEORAS/HEC-RAS Model. Journal of Civil and Environmental Engineering, 5(4), 1–12. https://doi.org/10.4172/2165-784X.1000179
- Gigovi´c, L., Pamuˇcar, D., Baji´c, Z., & Drobnjak, S. (2017). Application of GIS-Interval rough AHP methodology for flood hazard mapping in urban areas. Water, 9(6), 1–26. https://doi.org/10.3390/w9060360
- Guthrie, R. H., & Cuervo, V. (2015). Geohazards and risk: A proponent’s guide to linear infrastructure. Yukon Environmental and Socio-economic Assessment Board.
- Haan, C., Barfield, B., & Hayes, J. (1994). Design hydrology and sedimentology for small catchments. Elsevier.
- Haile, A. T., Kusters, K., & Wagesho, N. (2013). Loss and damage from flooding in the Gambela Region, Ethiopia. International Journal of Global Warming, 5(4), 483–497. https://doi.org/10.1504/IJGW.2013.057290
- Haq, M., Akhtar, M., Muhammad, S., Paras, S., & Rahmatullah, J. (2012). Techniques of remote sensing and GIS for flood monitoring and damage assessment: A case study of Sindh province, Pakistan. The Egyptian Journal of Remote Sensing and Space Sciences, 15, 135–141. https://doi.org/10.1016/j.ejrs.2012.07.002
- Hong, H., Tsangaratos, P., Ilia, I., Liu, J., Zhu, A.-X., & Chen, W. (2018a). Application of fuzzy weight of evidence and data mining techniques in construction of flood susceptibility map of Poyang County, China. Science of the Total Environment, 625, 575–588. https://doi.org/10.1016/j.scitotenv.2017.12.256
- Huang, C., Chen, Y., & Wu, J. (2014). Mapping spatio-temporal flood inundation dynamics at large river basin scale using time-series flow data and MODIS imagery. The International Journal of Applied Earth Observation and Geoinformation, 26, 350–362. https://doi.org/10.1016/j.jag.2013.09.002
- IPCC. (2007). Climate Change. Impacts, adaptation and vulnerability. Contribution of Working Group II to the Fourth Assessment Report of the Intergovernmental Panel on Climate Change. Intergovernmental Panel on Climate Change. http://www.cambridge.org/9780521880107
- IPCC. (2012). Managing the risks of extreme events and disasters to advance climate change adaptation: special report of the intergovernmental panel on climate change. Cambridge University Press. www.cambridge.org/9781107607804
- Islam, M., & Sado, K. (2000a). Flood hazard assessment in Bangladesh using NOAA AVHRR data with geographical information system. Hydrological Processes, 14(3), 605–620. https://doi.org/10.1002/(SICI)1099-1085(20000228)14:3<605::AID-HYP957>3.0.CO;2-L
- Jonathan, D., Jennifer, L. I., & Suzana, J. C. (2013). Coastal flooding by tropical cyclones and sea-level rise. Nature, 504(7478), 44–52. https://doi.org/10.1038/nature12855
- Khosravi, K., Pham, B. T., Chapi, K., Shirzadi, A., Shahabi, H., Revhaug, I., Prakash, I., & Bui, D. T. (2018). A comparative assessment of decision trees algorithms for flash flood susceptibility modeling at Haraz Watershed, Northern Iran. Science of the Total Environment, 627(6), 744–755. https://doi.org/10.1016/j.scitotenv.2018.01.266
- Khosravi, K., Pourghasemi, H. R., Chapi, K., & Bahri, M. (2016). Flash flood susceptibility analysis and its mapping using different bivariate models in Iran: A comparison between Shannon’s entropy, statistical index, and weighting factor models. Environmental Monitoring and Assessment, 188(12). https://doi.org/10.1007/s10661-016-5665-9
- Kia, M. B., Pirasteh, S., Pradhan, B., Mahmud, A. R., Sulaiman, W. N. A., & Moradi, A. (2012). An artificial neural network model for flood simulation using GIS: Johor River Basin, Malaysia. Environmental Earth Sciences, 67, 251–264. https://doi.org/10.1007/s12665-011-1504-z
- Kowalzig, J. (2008). Climate, poverty, and justice: What the Poznań UN climate conference needs to deliver for a fair and effective global deal. Oxfam Policy and Practice. Climate Change and Resilience, 4(3), 117–148.
- Lee, M. J., Kang, J. E., & Jeon, S. (2012). Application of frequency ratio model and validation for predictive flooded area susceptibility mapping using GIS. In IEEE International Geoscience and Remote Sensing Symposium (IGARSS) (pp. 895–898). IEEE. https://doi.org/10.1109/IGARSS.2012.6351414
- Li, M., Zang, S., Zhang, B., Li, S., & Wu, C. (2014). A review of remote sensing image classification techniques: The role of spatio-contextual information. European Journal of Remote Sensing, 47(1), 389–411. https://doi.org/10.5721/EuJRS20144723
- Luu, C., Von Meding, J., & Kanjanabootra, S. (2018). Assessing flood hazard using flood marks and analytic hierarchy process approach: A case study for the 2013 flood event in Quang Nam, Vietnam. Natural Hazards, 90(3), 1031–1050. https://doi.org/10.1007/s11069-017-3083-0
- Merz, B., Aerts, J., Arnbjerg-Nielsen, K., Baldi, M., Becker, A., & Bichet, A. (2014). Floods and climate: Emerging perspectives for flood risk assessment and management. Natural Hazards and Earth System Sciences, 14(7), 1921–1942. https://doi.org/10.5194/nhess-14-1921-2014
- Merz, B., Kreibich, H., Thieken, A., & Schmidtke, R. Estimation uncertainty of direct monetary flood damage to buildings. (2004). Natural Hazards and Earth System Sciences, 4(1), 153–163. SRef-ID: 1684-9981/nhess/2004-4-153. https://doi.org/10.5194/nhess-4-153-2004
- Mezgebedingil, A. G., & Suryabhagavan, K. V. (2018). Developing flood hazard forecasting and early warning system in Dire Dawa, Ethiopia. International Journal of Advanced Multidisciplinary Research, 5(9), 11–27. https://doi.org/10.22192/ijamr.2018.05.09.003
- Mina, F., & Ying, T. P. (2015). GIS techniques for flood modeling and flood inundation mapping. EJGI, 20(16), 6795–6805.
- Morea, H., & Samanta, S. (2020). Multi-criteria decision approach to identify flood vulnerability zones using geospatial technology in the Kemp-Welch Catchment, Central Province, Papua New Guinea. Applied Geomatics, 12(4), 427–440. https://doi.org/10.1007/s12518-020-00315-6
- Mu, E., & Pereyra-Rojas, M. (2017). Understanding the analytic hierarchy process. practical decision making, springer briefs in operations research. Springer.
- Ogato, G. S., Bantider, A., Abebe, K., & Davide Geneletti, D. (2020). Geographic information system (GIS)-Based multicriteria analysis of flooding hazard and risk in Ambo Town and its watershed, West shoa zone, Oromia regional State, Ethiopia. Journal of Hydrology: Regional Studies, 27, 100659. https://doi.org/10.1016/j.ejrh.2019.100659
- Opolot, E. (2013). Application of remote sensing and geographical information systems in flood management: A review. Research Journal of Applied Sciences, Engineering and Technology, 6(10), 1884–1894. https://doi.org/10.19026/rjaset.6.3920
- Pagliara, S. (2006). Flood risk mapping and mitigation in central Italy. Flood Recovery, Innovation and Response, I(118), 17–26.
- Pathak, S., & Olmo, J. C. (2021). Analysing spatial interdependence among the 2011 Thailand flood-affected small and medium enterprises for reduction of disaster recovery time period. Geoenviron Disasters, 8, 8. https://doi.org/10.1186/s40677-021-00180-4
- Pradhan, B. (2010). Flood susceptible mapping and risk area delineation using logistic regression, GIS and remote sensing. Journal of Spatial Hydrology, 9(2), 1–18.
- Rahmati, O., Zeinivand, H., & Besharat, M. (2016c). Flood hazard zoning in Yasooj region, Iran, using GIS and multi-criteria decision analysis. Geomatics, Natural Hazards and Risk, 7(3), 1000–1017. https://doi.org/10.1080/19475705.2015.1045043
- Rao, D. (2017). Hydrological and hydrodynamic modeling for flood damage mitigation in Brahmaniâ Baitarani River Basin, India. Geocarto International, 32(9), 1004–1016. https://doi.org/10.1080/10106049.2016.1178818
- Rimba, A. B., Setiawati, M. D., Sambah, A. B., & Miura, F. (2017). Physical flood vulnerability mapping applying geospatial techniques in Okazaki City, Aichi Prefecture, Japan. Urban Science, 1(7), 1–22. https://doi.org/10.3390/urbansci1010007
- Rozalis, S., Morin, E., Yair, Y., & Price, C. (2010). Flash flood prediction using an uncalibrated hydrological model and radar rainfall data in a Mediterranean watershed under changing hydrological conditions. Journal of Hydrology, 394(1–2), 245–255. https://doi.org/10.1016/j.jhydrol.2010.03.021
- Saaty, T. L. (1990a). How to make a decision: The analytic hierarchy process.
- Saaty, T. L. (1990b). An exposition of the ahp in reply to the paper remarks on the analytic hierarchy process. Management Science, 36(3), 259–268. https://doi.org/10.1287/mnsc.36.3.259
- Samela, C. R., Sole, A., & Manferda, S. (2018). A GIS tool for Cost-effective delineation of flood-prone areas. Computers, Environment and Urban Systems, 70(7), 43–52. https://doi.org/10.1016/j.compenvurbsys.2018.01.013
- Santillan, J. R., Marqueso, J. T., Makinano-Santillan, M., & Serviano, J. L. (2016, October 3–5). Beyond flood hazard maps: detailed flood characterization with remote sensing, GIS and 2D modeling. In Geomatic and Geospatial Technology (GGT) (pp. 315–323). https://doi.org/10.5194/isprs-archives-XLII-4-W1-315-2016
- Seejata, K., Yodyinga, A., Wongthadam, T., Mahavika, N., & Tantanee, S. (2018). Assessment of flood hazard areas using analytical hierarchy process over the Lower Yom Basin, Sukhothai Province. Procedia Engineering, 212, 340–347. https://doi.org/10.1016/j.proeng.2018.01.044
- Shafapour Tehrany, M., Shabani, F., Neamah Jebur, M., Hong, H., Chen, W., & Xie, X. (2017). GIS-based spatial prediction of flood prone areas using standalone frequency ratio, logistic regression, weight of evidence and their ensemble techniques. Geomatics, Natural Hazards and Risk, 8(2), 1538–1561. https://doi.org/10.1080/19475705.2017.1362038
- Shrestha, S., & Lohpaisankrit, W. (2017). Flood hazard assessment under climate change scenarios in the Yang River Basin, Thailand. International Journal of Sustainable Built Environment, 6(2), 285–298. https://doi.org/10.1016/j.ijsbe.2016.09.006
- Smith, K., & Ward, R. (1998). Floods: physical processes and human impacts. Wiley.
- Stijn, T., Patrick, M., Tjeerd, J. B., Peter, M. J. H., Ysebaert, T., & De Vriend, H. J. (2013). Ecosystem-based coastal defence in the face of global change. Nature, 504(7478), 79–83. https://doi.org/10.1038/nature12859
- Subramanya, K. (2008). Engineering hydrology. Tata McGraw-Hill.
- Tadesse, L., Suryabhagavan, K. V., Sridhar, G., & Gizachew, L. (2017). Land use and land cover changes and soil erosion in Yezat watershed, north western Ethiopia. International Soil and Water Conservation Research, 5(2), 85–94. https://doi.org/10.1016/j.iswcr.2017.05.004
- Tehrany, M. S., Lee, M. J., Pradhan, B., Jebur, M. N., & Lee, S. (2014a). Flood susceptibility mapping using integrated bivariate and multivariate statistical models. Environmental Earth Sciences, 72(10), 4001–4015. https://doi.org/10.1007/s12665-014-3289-3
- Tehrany, M. S., Pradhan, B., & Jebur, M. N. (2013). Spatial prediction of flood susceptible areas using rule based decision tree (DT) and a novel ensemble bivariate and multivariate statistical models in GIS. Journal of Hydrology, 504, 69–79. https://doi.org/10.1016/j.jhydrol.2013.09.034
- Tehrany, M. S., Pradhan, B., & Jebur, M. N. (2014b). Flood susceptibility mapping using a novel ensemble weights-of-evidence and support vector machine models in GIS. Journal of Hydrology, 512, 332–343. https://doi.org/10.1016/j.jhydrol.2014.03.008
- Tehrany, M. S., Shabani, F., Jebur, M. N., Hong, H., Chen, W., & Xie, X. (2017). GIS-based spatial prediction of flood prone areas using standalone frequency ratio, logistic regression, weight of evidence and their ensemble techniques. Geomatics, Natural Hazards and Risk, 8(2), 1538–1561. https://doi.org/10.1080/19475705.2017.1362038
- Thistlethwaite, J., Minano, A., Blake, J. A., Henstra, D. (2018). Application of re/insurance models to estimate increases in flood risk due to climate change. Geoenviron Disasters, 5, 8. https://doi.org/10.1186/s40677-018-0101-9
- Tien Bui, D., Khosravi, K., Shahabi, H., Daggupati, P., Adamowski, J. F., Melesse, A. M., Pham, B. T., Pourghasemi, H. R., Mahmoudi, M., Bahrami, S., Pradhan, B., Shirzadi, A., Chapi, K., & Lee, S. (2019). Flood spatial modeling in northern Iran using remote sensing and GIS: A comparison between evidential belief functions and its ensemble with a multivariate logistic regression model. Remote Sensing, 11(13), 1589. https://doi.org/10.3390/rs11131589
- U.S.Army Crops of Engineers. (2002). HEC-RAC River analysis system. Hydraulic reference manual (Version 3.1). U.S.Army Crops of Engineers Hydrologic Engineering Centre.
- UN International Strategy for Disaster Reduction (UNISDR). (2009). Reducing disaster risks through science: Issues and actions.
- Wang, Y., Hong, H., Chen, W., Li, S., Pamuˇcar, D., Gigovi´c, L., Drobnjak, S., Bui, D. T., & Duan, H. A. (2019). A hybrid GIS multi-criteria decision-making method for flood susceptibility mapping at Shangyou, China. Remote Sensing, 11(1), 62. https://doi.org/10.3390/rs11010062
- Weldegebriel, Z. B., & Amphune, B. E. (2017). Livelihood resilience in the face of recurring floods: An empirical evidence from Northwest Ethiopia. Geoenviron Disasters, 4, 10. https://doi.org/10.1186/s40677-017-0074-0
- Winsemius, H. C., Van Beek, L. P. H., Jongman, B., Ward, P. J., & Bouwman, A. (2013). A framework for global river flood risk assessments. Hydrology and Earth System Sciences, 17(5), 1871–1892. https://doi.org/10.5194/hess-17-1871–2013
- Wondim, Y. K. (2016). Flood hazard and risk assessment using GIS and remote sensing in lower Awash Sub-basin. Ethiopia. Journal of Environment and Earth Science, 6(9), 69–86.
- World Bank. (2010). Report on the status of disaster risk reduction in Sub-Saharan Africa.
- Woube, M. (1999). Flooding and sustainable land-water management in the Baro-Akobo river basin, Ethiopia. Applied Geography, 19(3), 235–251. https://doi.org/10.1016/s0143-6228(99)00004-1
- Yang, T. H., Ho, J. Y., Hwang, G. D., & Lin, G. F. (2014). An indirect approach for discharge estimation: A combination among micro-genetic algorithm, hydraulic model, and in situ measurement. Flow Measurement and Instrumentation, 39, 46–53. https://doi.org/10.1016/j.flowmeasinst.2014.07.003
- Zou, Q., Zhou, J., Zhou, C., Song, L., & Guo, J. (2013). Comprehensive flood risk assessment based on set pair analysis-variable fuzzy sets model and fuzzy AHP. Stochastic Environmental Research and Risk Assessment, 27(2), 525–546. https://doi.org/10.1007/s00477-012-0598-5