
 ?Mathematical formulae have been encoded as MathML and are displayed in this HTML version using MathJax in order to improve their display. Uncheck the box to turn MathJax off. This feature requires Javascript. Click on a formula to zoom.
ABSTRACT
Soil erosion is a serious problem arising from agricultural intensification and other anthropogenic activities which can cause deterioration of soil fertility and productivity. This study aims to estimate total amounts of soil loss using the RUSLE and NDVI models and identify major areas of concern for management interventions through site specific in the Coka watershed, Southern Ethiopia. The RUSLE model required the integration of thematic factors such as rainfall, length and steepness of the slope, land-use and land-cover, soil erodibility, and control practices. These factors were calculated using remote sensing data and GIS. The results indicated that total area coverage from study of watershed under the degree of severity of erosion and priority was <5(very low), 5 − 10 (low), 10 − 18 (moderate), 18 − 50 (high), 50 − 100 (very high) and >100 t ha–1yr–1 (severe). Soil loss rates ranged between 2.33 in bare land and 237.16 t ha–1yr–1 in forest. Based on the findings, erosion risk having estimated soil loss (≥ 18 t ha–1yr–1) which is above tolerable range for the country containing 73% (2723 ha) from the total area coverage of watershed. Thus, appropriate soil and water conservation practices should be adopted to restore degraded lands and environment by giving attention for erosion hotspot areas.
1. Introduction
Soil erosion is a global major environmental problem leading to loss of nutrient-rich top surface soil, increased runoff from the more impermeable subsoil, and decreased water availability to plants (Fu et al., Citation2006; Ganasri & Ramesh, Citation2015; Pal et al., Citation2021). Modifications in land-use and management primarily drive soil erosion. The FAO-led Global Soil Partnership reports that 75 billion tons of soil are eroded every year from arable lands worldwide, which equates to an estimated financial loss of US$400 billion per year (GSP (Global Soil Partnership), Citation2017). The average soil erosion rates throughout the world are estimated between 12 and 15 t ha−1 y−1 (Biggelaar et al., Citation2003). It means that every year the land surface loses about 0.96–1.2 mm of soil (FAO, Citation2019), which is results in estimated financial loss of US$ 64 − 80 billion per year (FAO, Citation2017). In addition, soil erosion threatens sustainable agricultural production and water quality in tropical and semi-arid regions (Prasannakumar et al., Citation2012). Thus, soil erosion is a global economic, environmental, and ecological problem, mainly affecting natural resources and agricultural production (Chakrabortty et al., Citation2020a; Paveen & Kumar, Citation2012; Ighodaro et al., Citation2013; Pal et al., Citation2022).
Several studies have proven the effectiveness of remote sensing data in monitoring soil erosion, and land-use and land-cover (LULC) changes in Sub-Saharan Africa and elsewhere (Atoma et al., Citation2020; Gebreegziabher et al., Citation2021; Tadesse et al., Citation2017). Seutloali and Beckedahl (Citation2015) reported that LULC change is the major causal factor driving soil loss in upland watersheds, particularly in Sub-Saharan Africa. It is the main approach through which human beings influence the ecosystem and contains plentiful information of human activities (Kishtawal et al., Citation2010; Pielke et al., Citation2011). As in the other parts of the world, the fastest change in LULC was due to increasing population pressure on forest resources, and agricultural land expansion to meet the graduated food demand, increasing demand for fuel wood and raw construction material, and the other anthropogenic influences (Gebreegziabher et al., Citation2021; Samuel et al., Citation2016; Uwemeye et al., Citation2020).
In Ethiopia, water erosion is the leading cause of degradation of the soil capital and the environment. It affects, with varying intensities, about 1.9 billion tons of topsoil from the highlands by soil erosion and losses an estimated USD$ 1 billion y−1 of land in Ethiopia (Addis & Klik, Citation2015; Atoma et al., Citation2020; FAO, Citation1984; Sonneveld, Citation2002). This amount of soil could have added about 1.5 million tons of grain to the country’s annual harvest (Lulseged & Vlek, Citation2008). Soil erosion is a severe threat to food security and directly impacts livelihoods among rural communities in Ethiopia (Berhan et al., Citation2014; Samuel et al., Citation2016). There is wide range of estimates on the annual rate of soil erosion by water is the dominant degradation process and occurs particularly on cropland, with annual soil loss rates on average of 42 ton ha−1 y−1 for croplands, and up to 300 ton ha−1 y−1 in extreme cases (Tamrie, Citation1995; Tesfaye et al., Citation2013). Bewket and Teferi (Citation2009) estimated annual soil loss at ton ha−1 y−1 for the entire Chemago watershed based on field assessment of rill and inter-rill erosion. Haile and Fetene (Citation2012) estimated that about 97.04% of Kilie catchment, East Shoa, has 0–10 ton ha−1 y−1 erosion rate. Temporal patterns of LULC changes, especially in areas susceptible to accelerated soil erosion, provide further reason to reevaluate former qualitative approaches, considering the worldwide increase in croplands by 279 million hectares during 1985 − 2013 (Gebreegziabher et al., Citation2021). Therefore, in recent years, local authorities increasingly concerned about the issue of soil fertility have funded several research projects aimed at the conservation of water resources and limitation of soil erosion.
Some recent studies that have applied the RUSLE model to investigate the soil loss through physical field assessments and indicated that the high rates of soil erosion in Ethiopia are mainly caused by the combined effects of deforestation, overgrazing, detrimental cultivation practices with an emphasis on small-seed crops that require fine tillage, poverty, land fragmentation, expansion of cropland onto steep slopes, and unsustainable use of natural resources (Amsalu et al., Citation2007; Billi, Citation2015; Chakrabortty et al., Citation2022; Descheemaeker et al., Citation2006; Haile & Fetene, Citation2012; Samuel et al., Citation2016; Sonneveld & Keyzer, Citation2003). Erosion could also generate deposition of soil materials in the reservoirs, irrigation schemes, and waterways downstream (Cerda & Doerr, Citation2008). To curb such problems, assessment, planning, and implementation of locally acceptable and effective soil conservation practices are urgently needed (Sonneveld & Keyzer, Citation2003).
A wide range of models were developed to assess the rate of soil erosion. Model simulations are the basic methods for soil erosion prediction, usually, there are two types of prediction models such as physically-based models, and empirical models. Physically-based models theoretically have a greater transferability than empirical models, are more likely to achieve sound predictions (Schmidt et al., Citation1999; Wainwright & Mulligan, Citation2013). The prediction of rates of soil erosion typically involves the use of empirical models (Leh et al., Citation2013), thus the empirical models are still widely used for soil erosion assessment both on the watershed and regional scale. Of all the empirical models, the Universal Soil Loss Equation (USLE; Wischmeier & Smith, Citation1978) and the Revised Universal Soil Loss Equation (RUSLE) are used probably the most widely used empirical models for water erosion assessment and water conservation plans worldwide (Kinnel, Citation2010; Renard et al., Citation1997; Oliveira et al., Citation2011). The RUSLE model reveals that soil erosion is greatest on cultivated land than other land-use types (Gimenez-Morera et al., Citation2010; Hurni, Citation1993; Pal & Chakrabortty, Citation2019). It has been widely used in predicting soil erosion loss because of its simplicity, limited data requirement, and compatibility with Geographical Information Systems (GIS) (Angima et al., Citation2003; Bewket & Teferi, Citation2009; Lu et al., Citation2004; Hurni, Citation1985; Milward & Mersey, Citation1999). It has been recommended that where data for validation of model are scarce, with careful consideration of transfer functions and parameters, the model can be used for cost-effective conservation planning purposes (Angima et al., Citation2003; Chowdary et al., Citation2013; Haile & Fetene, Citation2012; Milward & Mersey, Citation1999; Garg & Jothiprakash, Citation2012; Prasannakumar et al., Citation2012; Wischmeier & Smith, Citation1978). Risse et al. (Citation1993) reported that among six RUSLE factors topography factors (LS) and the C factor exert the greatest effect on the global model efficiency. The Normalized Difference Vegetation Index (NDVI) values have been developed to estimate the RUSLE C factor (De Asis & Kenji Omasa, Citation2007; Durigon et al., Citation2014; Van der Knijff et al., Citation1999). Therefore, a new method for calculating the RUSLE C factor, based on NDVI rescaling, was proposed by Durigon et al. (Citation2014). It is an important model to produce realistic C values for RUSLE and is suggested to be used in tropical regions.
Recently, due to climate change which causes climate variation in some parts of the world, particularly rainfall patterns, this will increase and enhance soil erosion, especially in areas where habitat changes occur. Rainfall erosivity is the potential ability of rain to cause erosion (Gebreegziabher et al., Citation2021). Thus, Coka watershed faced food insecurity problem, climate change (uncommon rainfall, hotness and coldness), occurrence of drought, lack of crop productivity and dramatic population growth for last 30 years till present (CSA, Citation2021; WAO (Woreda Agricultural office), Citation2022), which is a 56.3% increment of population growth with requirement of construction, crops for food security, firewood and charcoal for fuel or income, and grazing. These all anthropogenic activities have significant impacts on the environment and ecology of natural resource management and assurance of food security. Food security depends on soil productivity whereas soil fertility and productivity depend on topsoil nutrient content, which is a reservoir of essential nutrients and plays an important role in cycling essential nutrients. As a result, government and non-governmental organizations were taking action to satisfy the food need of people in the study area for long periods of time but the problem is continued till present with the need of solution. The long period food insecurity and draught problems of study area may be due to loss of topsoil by water erosion in response of land use and land cover change. Therefore, spatial correlation between climate change, land-cover change, and soil erosion using global models, such as RUSLE, can effectively assist in the planning and prioritization of soil and water conservation. Thus, the purpose of this study was to quantify and analyze soil loss due to LULC change by water erosion with the help of RUSLE and NDVI to identify major areas of concern for management interventions in the Coka watershed, Southern Ethiopia.
2. Materials and method
2.1. Study area
The study area is located at about 195 km west of Hawassa city in the southern Ethiopia, 330 km south west of Addis Ababa. Geographically, the Coka watershed is bounded by latitude 7°12ʹ10”−7°18ʹ20”N and longitude 37°31ʹ0”−37°34ʹ25”E covering total area is about 3731 ha (). Elevation of Coka watershed ranges from 771 − 2524 m a.s.l. Most of the area in this watershed is under high mountains with very steep slopes. Average annual temperature is 30.0°C. Annual rainfall ranges between 932.7 and 1727.8 mm. The main rainy season is between June and September while the short rains fall between February and April. Coka watershed has bimodal rainfall distribution small (belg) and major (Kiremt). Rains in kiremt season are intensive which uses for crop production and causes soil erosion during this time at different parts in the study watershed. Geologically, the area is covered by trap series volcanics of the tertiary period that are largely acidic rocks such as rhyolites, ignimbrites, and trachites covering the basement complex of the Precambrian rocks (Elias, Citation2016). Moderate to deeper soils are found in the moderate to gentle slopes and shallower soils are found on steeper slopes in Coka watershed. According to Alemu and Tadele (Citation2018), the soil type of surrounding the study watershed is Nitisol.
Figure 1. Location map of the study area.
In the Coka watershed, the natural vegetation has been damaged by human agricultural activities. Thus, the current vegetation is primarily the secondary vegetation types that restored since the national soil and water conservation project began in 2019. The farming system is dominated by mixed crop-livestock system which consists of intensive and continuous crop cultivation and animal husbandry. The main cultivated crops are maize (Zea mays L.), teff (Eragrostisteff Z.), sorghum (Sorghum bicolor L.), wheat (Triticum durum Desf.), and potato (Solanum tuberosum L.), barley and legumes such as haricot bean, fava bean and pea. The homestead areas are largely planted in enset (Ensetteventricossum), coffee (Coffee Arabican) with undergrowth of root crops (sweet potato, cassava, ginger and yams).
2.2. Data
Time series Landsat (TM, ETM+, and OLI-TIRS) satellite data of 1988, 1998, 2008, and 2018 with path 169 and row 055 were used for developing land-use/land-cover maps of the study area and to determine C and P-factors used in the RUSLE model. Landsat data were downloaded from United States Geological Survey (USGS) Center for Earth Resources Observation and Science (EROS) (https://earthexplorer.usgs.gov/). Shuttle Radar Topographic Mission (SRTM) digital elevation data of 30 m resolution were used in this study. Digital Image data files were downloaded in zipped files from the United States Geological Survey (USGS). The Universal Transverse Mercator (UTM) map projection system zone 37 N and datum of World Geodetic System 84 (WGS84) were used for all the datasets to ensuring consistency between datasets during analysis. Field observations were also conducted to fix up training sites, to check ground truth, and verify the final output of the maps. All satellite imageries were geometrically rectified with the help of a topographic map (1:50,000) of the study area obtained from the Ethiopian Mapping Authority. The soil map of the study area was obtained from the soil database compiled by Food and Agricultural Organization, collected from the Ministry of Agriculture, Federal Government of Ethiopia. Remotely sensed data combined with further spatial information in a GIS environment to assess the extent and rate of annual soil loss. Data required for mapping the soil erosion and their sources are given in and .
Figure 2. Processing flowchart for modeling soil erosion in the catchment.
Table 1. Observation data set and source.
2.3. Model selection and parameterization
RUSLE model was used to estimate and map soil loss rates in the study watershed, however, it includes numerous improvements, such as factors and incorporation of the influence of surface. Improved empirical equations were used for the computation of rainfall erosivity (R), eroded factor (K), and crop management (C) factor. Moreover, some parameters of the model have been adjusted for Ethiopian situations (Hurni, Citation1985). Today computed in a raster-based GIS, the model provides information on potential water erosion on a cell by cell basis. Annual soil loss is a function of five factors described by the expression (Renard et al., Citation1997):
where R is the rainfall-runoff erosivity factor (MJ mm ha−1 h−1 y−1), K is soil erodibility (t ha h ha−1 MJ−1 mm−1), LS is slope length-steepness, C is land-use and land-cover; and P is the erosion control (conservation support) practices factor (dimensionless, ranging between 0 and 1).
2.3.1. Rainfall and runoff erosivity factor (R)
Rainfall-runoff erosivity is the primary factor causing soil erosion and accounts for about 80% of the soil loss (Wischmeier & Smith, Citation1978). The R factor governs the forces of rainfall to disconnect and move soil particles in a specified area. It is computed by multiplying Kinetic energy (E) of rainfall and maximum intensity of rain in 30 min (Renard et al., Citation1997; Wischmeier & Smith, Citation1978). In areas where rainfall intensity data is not commonly available, total annual rainfall has been adjusted to estimate R-factor for different regions (Bewket & Teferi, Citation2009; Gebreyesus & Kirubel, Citation2009; Le Roux et al., Citation2008; Xin et al., Citation2011). As reported by Gitas et al. (Citation2009) and Paveen and Kumar (Citation2012) it can be also analyzed by using annual rainfall. The R factor value was calculated based on mean yearly precipitation for the period of 30 years, which was collected from 23 meteorological stations nearby the Coka watershed, using the erosivity computation formula of Hurni (Citation1985):
where R is rainfall erosivity factor, and P is annual average rainfall (mm).
2.3.2. Soil erodibility factor (K)
The K-factor determines the property of soil particles that govern their resistance to detachment and transport by rainfall. It is strongly related to the soil properties, plays an important role in soil conservation strategies (Shabani et al., Citation2014), and reveals the soil erosion per rainfall erosivity index (Paveen & Kumar, Citation2012). The most important soil properties that affect soil erosion are soil organic matter content, soil texture, drainage ratio, and soil structure (Renard et al., Citation1997; Robert & Hilborn, Citation2000; Wischmeier et al., Citation1971). Soil data in Ethiopia often do not have detailed information about these soil parameters e.g., structure and permeability. Textures are among the principal factors affecting K-values. Soil erosion depends on the relative easiness of the soil for detaching and transporting forces. As stated by Sheikh et al. (Citation2011) and Paveen and Kumar (Citation2012), there is a relationship between organic matter, texture, and K-factor.
In this study, the K factor was estimated from the textural class and soil organic matter due to the high costs of obtaining the data of all four soil parameters (Randolph, Citation2004). Besides, some investigators have estimated soil erodibility only from soil color (Bewket & Teferi, Citation2009; Gebreyesus & Kirubel, Citation2009). For this study, 20 composite soil samples from the top 0 − 30 cm were collected from land-use and land-cover classes and were analyzed for soil texture, and organic matter in Hawassa University’s soil laboratory (). Particle size distribution was determined by the Bouyoucos hydrometer method (Van Reeuwijk, Citation1992), and textural classes were made following the USDA system of textural classification. Soil organic carbon was estimated using the Walkley and Black (Citation1934) wet digestion method, and the content of organic matter was obtained by multiplying the content of organic carbon by a factor of 1.724. The mentioned soil parameters were used to compute the K-factor based on the following Equation:
Table 2. (K) factor values corresponding to the soil texture and organic matter content Randolph (Citation2004).
where M is (percentage silt + percentage very fine sand) (100% clay), OM is the percentage of organic matter, P is permeability class, and S is structure class.
2.3.3. Slope gradient factor (LS)
The dimensionless slope length and steepness factor, LS, represent the effect of slope gradient on soil loss, can be determined as a product of the slope length (L) and slope steepness (S; Panagos et al., Citation2015). This factor was calculated from the Shuttle Radar Topography Mission (SRTM), digital elevation model (DEM) of the watershed at a 30 × 30 m spatial resolution obtained from the United States Geological Survey (USGS) Earth Explorer. Therefore, the LS factor maps were created using ArcGIS (Carlos et al., Citation2016; Lulseged et al., Citation2017; Zhang et al., Citation2013). For a large basin, the grid resolution is always an important factor that influences the model output (Wang et al., Citation2012). The L is influenced by grid size and steepness while S is only by the steepness so the change of grid size affects the steepness values which accordingly affect the L and S factor values (A.H. Oliveira et al., Citation2013). Thus, the LS factor was computed using the following equation as recommended by Simms et al. (Citation2003).
where FA is Flow Accumulation, cell size is DEM size (30 × 30 m), is slope gradient (in radians). The mean LS value for the study area is m = 0.5, and n = 1.2 were recommended by Mitasova and Mitas (Citation1999) and Liu et al. (Citation2000).
2.3.4. Estimation of cover management factor (C)
The cover and management factor (C) is expressed as the soil loss ratio from an area with a certain cover and management. It might be the most important factor to predict the past, actual, and future soil erosion severity because of its dynamism in short term (Van der Knijff et al., Citation2000; Karaburun, Citation2010). This factor was prepared from the corresponding land-use and land-cover maps and fixed values were assigned to every LULC class. The C-factor is dimensionless and ranges from near 1 and 0. Where C is 1 means the surface is treated as barren land, C is 0 means very strong cover effects and well-protected soil. On the contrary, the removal of vegetation for cropping and/or grazing leads to the depletion of Soil Organic Matter (SOM) and increased runoff and soil erosion. To account for such differences, the land-use and land-cover of the study area were derived from a supervised classification of the Landsat satellite image and verified with field information collected from 200 samples taken from training sites. The seven land-use and land-covers were identified overall classification accuracy, using ERDAS imagine 9.2. Hence, four C-factor raster grids were derived for 1988, 1998, 2008, and 2018 to assess the impact of LULC change on soil erosion. Descriptions of the land-cover categories of the study watershed are shown in .
Table 3. Description of land-use and land-cover classes in the Coka watershed.
Normalized Difference Vegetation Index (NDVI) was used in this study for gaining information about the seasonal growth of vegetation condition, vegetation dynamics and as one of the input parameters for estimating the potential of erosion using RUSLE model. The NDVI, which is positively correlated with the amount of green biomass and gives an indication of differences in green vegetation coverage (Van der Knijff et al., Citation2000). Many researchers calculated the C factor with different equations (Durigon et al., Citation2014; Van der Knijff et al., Citation2000; Karaburun, Citation2010), and the sum of these measurements using the formula EquationEq. (5)(5)
(5) :
where C is land-use and land-cover factor, and NDVI is Normalized Difference Vegetation Index.
where NIR is the reflectance value in near-infrared band, red is the reflectance value in the visible red band.
2.3.5. Estimation of support practice factor (P)
The P-factor represents the role of conservation practices in reducing erosion. In this perspective, soil erosion can be reduced by adjusting the flow pattern and direction of runoff. The type of conservation measures implemented and require conserved areas to be mapped can determine the value of P (Daniel et al., Citation2015). As observed during field visits, contour plowing is the main soil erosion control practiced among the farmers in cultivated lands improved by the construction of soil and stone bunds in some parts in the study area. The P-factor modifies the potential of erosion by contouring, strip cropping, and terraced contour farming (Kim & Julien, Citation2006; Kuok et al., Citation2013; Wischmeier & Smith, Citation1978). According to Wischmeier and Smith (Citation1978), the support practices (P) factors can be computed for agricultural lands of different slope classes but non-agricultural lands are aggregated together and the P-values range from 0 to 1 depending on the slope classes of arable lands and non-arable lands. P-values can be derived from either image classification using remote sensing data, or even expert knowledge (Panagos et al., Citation2015). Some studies recommended that the P-value is highly varied due to slope inclination (Karamage et al., Citation2016; Lufafa et al., Citation2003; Wenner, Citation1980; Wischmeier & Smith, Citation1978); it is calculated by farming practices (Stone & Hilborn, Citation2012). On the other hand, the P-values suggested by Bewket and Teferi (Citation2009) and Asmamaw and Mohammed (Citation2019) by considering two types of land-uses agricultural and non-agricultural land uses and their corresponding slope. For this study, the P factor was computed by the cultivation and slope based on land-use map and DEM database as used by Shin (Citation1999). To further understand the process behind the LULC dynamics, major causes of the changes were explored using key informant interviews and focus group discussions, including from local communities, government officials, and NGO workers in the study site.
3. Results
3.1. Rainfall and runoff erosivity factor map
The various RUSLE factors identified in the study area are shown in and . The R-factor values varied within ranges 653.8 − 680.5 (low), 680.5 − 711.3 (moderate), and 711.3 − 760.1 (high) MJ ha−1 y−1 over area coverage of 23%, 45%, and 32%, respectively (). shows the average, maximum, and minimum annual R factor values for each rain gauge were reported. Moreover, the monthly R factor distribution was reported. The effect of rainfall on soil erosion is high (760.1 MJ ha−1 y−1) in the northern part and gradually decreases at the southern part due to low elevation and presence of forestland, bush-land, and grassland, reaching a minimum erosivity value of 653.8 MJ ha−1 y−1. Moreover, it has been observed two dominated rainfall periods (June to July and August to September) recorded about 80% of the total mean rainfall. Despite the spatial variation of the erosivity factor, the entire watershed is highly erosive as the R-factor is by far greater than the global average R-factor of 760.1 MJ ha−1 y−1.
Figure 3. Thematic maps of R-factor (a), K-factor (b), LS-factor (c), C-factor (d), and P-factor (e) of the Coka watershed.
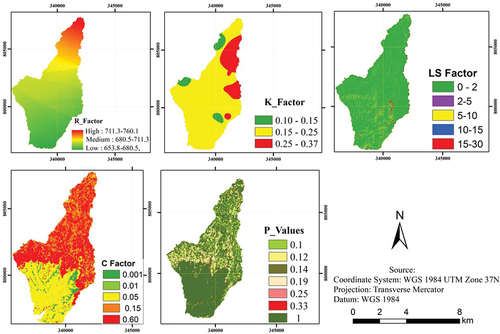
Table 4. Area distribution of RUSLE factors values in Coka watershed.
Table 5. Soil erodibility (K) factor values of different textures and organic matter content.
3.2. Soil erodibility factor map
The soil erodibility map in the study area is reported in . Soil erodibility ranged from 0.10 − 0.15 (low), 0.15 − 0.25 (moderate) and 0.25 − 0.37 (high) within area coverage of 11%, 68% and 21%, respectively (). K-values show an increasing trend in order such as loam sandy < clay < sandy loam and sandy clay loam < silty clay loam (). The result noticed that lowest K-value (0.10) is showed high organic matter and loamy sand soil texture in forestland, bush-land, and foot slopes (). The highest K-value (0.37) has resulted from low organic matter and silty clay loam soil texture in cultivated land, bare-land and grassland, and middle and upper slopes ().
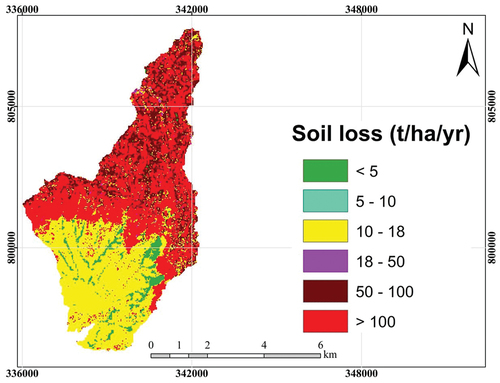
Figure 4. Spatial distribution of soil loss within the study area.
3.3. Slope gradient factor map
The LS-factor represents the overall contribution of topographic features such as length and steepness of the slope on soil erosion. The LS factor is expected in the catchment due to the high value of the contributing inputs. The topography accelerates progressively the runoff downslope and increases the erosivity of runoff. The result indicated that ranges from 0 to 30 and considered 0 − 2 (lowest) and 15 − 30 (highest) represented by 27% and 12%, respectively ( and ). About 54% of total areas were found in LS classes between 5 − 30. The result revealed that high LS-factor predominates the southern, and middle parts to eastern highlands and those areas are characterized by very steep slopes.
3.4. Cover and management practice factor map
The dimensionless C-factor values ranged from 0.60 in bare-land to 0.001 in dense forestland with area coverage from total watershed 1.8% and 23.0%, respectively. The observed considerable change in LULC is likely to impact and expose the watershed to severe soil erosion due to the drastic increase of high C-factor in space and time. The highest area coverage is by cultivated-land covering 38.5% with C-value of 0.15 (, ). This showed that the risk in the order such as forestland < bush-land < grassland < built-up-area < cultivated-land < bare-land which was with minimum (2.33) in forestland and maximum (236.16) t ha−1 y−1 in bare-land (), Which fact can increase the surface runoff due to the absence of vegetation while the latter plays a role in dissipating the rainfall energy before it impacts the soil. The proper conservation measures are the alternative to counter the high occurrence of soil erosion. P-values ranged from 0.1 − 0.33 for agricultural land-use based on the slope gradient classes and 1 for all non-agricultural land-use (). Area coverage of the highest (42.4%) and lowest 20 ha (1.4%) represented by P-values of 0.19 and 0.1 from agricultural land-use areas (). This signifies inexistent conservation measures and a high risk of soil erosion.
3.5. Distribution of soil erosion
The soil erosion rate and the total soil loss are presented in . Amounts of annual soil loss and priority of land management were used to classify the degree of severity of erosion and priority into six classes as <5 (very low), 5 − 10 (low), 10–18 (moderate), 18 − 50 (high), 50 − 100 (very high) and >100 (severe) soil erosion risk with coverage of the study area 8%, 6%, 13%, 11%, 20%, and 42%, respectively (). The actual erosion rate is high (18 − 50) to severe (>100) t ha−1 y−1) soil erosion distributed on steep slope landscape, cultivated-land, bare-land, and high rainfall area of northern parts and east-west middle and upper parts of Coka watershed. About, 2723 ha (73%) of the total study area was found to have soil loss rates above 18 t ha−1 y−1. The soil loss exceeding 100 t ha−1 y−1 covered 1567 ha (42%) of the total Coka watershed which was cultivated and poorly vegetated steep slopes area. The mean soil loss rate in the area was 62.15 t ha−1 y−1 which the soil depth may be lowering by 4.97 mm y−1.
Table 6. Estimation of soil erosion rates.
4. Discussion
Habitat cover is an important factor affecting soil erosion. As known, the vegetation has an impact effect on soil erosion by protecting the surface soil either from the raindrop impact or runoff detachment and transport, and this effect for soil conservation usually increases as the vegetation cover increases, which is named as the C factor in RULSE. The spatial distribution and pattern of vegetation can greatly influence the flow process and thus greatly correlated with soil erosion (Atoma et al., Citation2020; Chakrabortty et al., Citation2020b; Gebreegziabher et al., Citation2021; Pal & Shit, Citation2017; Tadesse et al., Citation2017). Land-use and land-cover changes in the Coka watershed for last 30 years (during 1988–2018) shows that most of the area is cultivated-land and rural-settlement, bare land, built-up-area and water body have increased at an annual rate of 23.1, 2.2, 0.8 and 1.1 ha/year but forestland, bush-land and grassland have decreased at an annual rate of 14.4, 4.1 and 8.7 ha/year, respectively (Tadele et al., Citation2022). In contrast of that noted by Tadele et al. (Citation2022), projected that the increase in cultivated-land, bare-land, built-up-area, and waterbody but decreases the forestland, grassland and bush-land from 2018 to 2060 years. This indicates that LULC change was occurred in the Coka watershed during specified periods. In the Coka watershed, the RUSLE model has revealed that areal distribution of mean annual soil loss quantity varied from <5 to >100 t ha−1 y−1 which highly affected north, northern-east, and northern-west parts.
Present results are in conformity with Asmamaw and Mohammed (Citation2019) demonstrated that it varied from less than 10 to over 80 t ha−1 y−1 in Ethiopia. Soil loss rates between 18 − 50, 50 − 100, and >100 t ha−1 y−1 are above 18 t ha−1 y−1which is above the soil loss tolerable limit (loss tolerance of 18 t ha−1 yr−1 and formation rate of 2 − 22 t ha−1 y−1) for Ethiopia developed by , (Hurni, Citation1983a, Hurni, Citation1983b). Similarly, FAO (Citation2019) showed that the threshold soil loss value between 4.5 − 11.2 t ha−1 y−1 established by USDA and a range for threshold soil loss between 1 t ha−1 y−1 for shallow sandy soils and 5 t ha−1 y−1on deeper and well-developed soils set by the European Environment Agency. The average annual soil loss rate from the study area was 62.15 t ha−1 y−1which may be lowering the soil depth by 4.97 mm. This study finding shows that about 2723 ha (73%) of the total area was found to have soil loss rates above 18 t ha−1 y−1. This finding is in line with Asmamaw and Mohammed (Citation2019) above 75% of Gerado catchment and Abate (Citation2011) over 50% of Borena district that the rate of soil loss exceeds the tolerable soil loss rate estimated for Ethiopia. These results agree with Addis and Klik (Citation2015) reported that soil erosion is greater than rate of soil formation which reduces the existing production systems with decreased soil productivity. Similarly, Panagos et al. (Citation2016) and FAO (Citation2019) reported that annual crop yield reduction was estimated between 0.1 − 0.4% due to soil erosion. The loss of topsoil leads to a decrease in nutrient-holding and nutrient-supplying power of soil (FAO, Citation2019).
Concerning the deviations (%) between the analytically and empirically estimated R factors, there is no clear remark on the prevalence of a certain method, since more than one display similar behavior by Arnoldus (Citation1977) equation seems to perform best). The R-values exceed from 50 MJ ha–1yr−1 which the amount and degree of erosion depend on the rainfall precipitation variability in the study area as opined by Meliho et al. (Citation2016). R-values exceeding 50 MJ ha–1yr−1indicated that the entire watershed is subject to a high climatic aggressiveness. Management factors that improve the soil carbon, cover and conservation efforts could reduce the effective K factor (Gebreegziabher et al., Citation2021). The highest K-value (0.37) has resulted from low organic matter and silty clay loam soil texture which is least resistant and highly susceptible to soil erosion in the study area. According to (Das et al., Citation2020) silt particles tend to be more susceptible to soil erosion than sand or clay particles. These findings are in line with Asmamaw and Mohammed (Citation2019) reported that the K-values ranged between 0.19 − 0.42 in the Gerado catchment, Ethiopia. Similar to the K-values of most soils of Ethiopia vary between 0.05 − 0.6 (FAO, Citation1984), tropical soils 0.06 − 0.48 (El-Swaify et al., Citation1992).
Soil erosion is primarily driven by modifications in land-use and management. The mean annual soil loss LULC changes ranged between 2.33 in forestland and 236.16 t ha−1 y−1 in bare-land with average soil loss 62.15 t ha−1 y−1 which may be lowering the soil depth by 4.97 mm in the study area (). All LULC types expect forestland observed as soil erosion hotspot areas with requirement of management priority. The present results agree with Asmamaw and Mohammed (Citation2019) reported that land-use and land-cover and topographic factors as the major agents of soil erosion in Ethiopia. Bui et al. (Citation2010) and FAO (Citation2019) demonstrated that vulnerable soils soil loss of 1 t ha−1 y−1 equivalent to a value of soil depth lowering of 0.08 mm.
The length and steepness of a slope affect the area and are accounted by the LS-factor in RUSLE model. In addition to steepness and length, other factors such as compaction, consolidation and disturbance of the soil were also considered while generating the LS-factor. Erosion increases with slope steepness but, in contrast to the L-factor representing the effects of slope length, the RUSLE makes no differentiation between rill and inter-rill erosion in the S-factor that computes the effect of slope steepness on soil loss (Carlos et al., Citation2016; Lulseged et al., Citation2017; Zhang et al., Citation2013). Approximately, 54% of total study areas were found in LS-classes between 5 − 30 which are largest LS-value range and highest area coverage (). Most parts of steep slope study area faced from high (18–50) to severe (>100) t ha−1 y−1 erosion hazard which was bare-land, cultivated and poorly vegetated steep slopes area. This finding shows that the severity of erosion hazard is governed by the combined interaction of environmental (topographic) and anthropogenic (LULC change) factors. According to Zhou et al. (Citation2013), when the slope steepness was < 10° and > 40°, the mean soil loss varied from 11.6 and 59.7 t ha−1 y−1, respectively. The same author states that high soil loss from steep slope areas was due to high runoff from steep gradients. This is supported by FAO (Citation2019), erosion increases in a linear relationship with slope increases, and the velocity of the runoff increases as the slope gradient increases.
Soil erosion effect might become up with the consequence of land degradation and lowering soil productivity in the north, northern-east, and northern-west parts in the study area. Management interventions might be reduced soil erosion and improve soil productivity by increasing the soil macro and micronutrients availability for plants. Daniel et al. (Citation2015) reported that the reduction of soil erosion following improvement in the soil organic matter content. Similarly, Ndah et al. (Citation2015) proposed deduction of livestock as a conservation device that possibly reduces erosion by reducing runoff in the grassland. According to (FAO, Citation2019), the loss of nutrient-supplying power can be replaced by increasing use of fertilizer while there are economic costs to increased fertilizer use as well as environmental costs to minimize agrochemical contamination of surface waters. Additionally, Bizoza (Citation2014) reported that soil amendments through animal wastes reduce bulk density and compaction which ultimately reduce runoff and soil erosion by increasing pore spaces and infiltration capacity. Therefore, the values obtained from RUSLE modeling were regarded as indicators of soil erosion and associated long-term environmental change rather than the tool for precise estimation of net soil loss.
5. Conclusion
A quantitative assessment of soil erosion in the Coka watershed using the RUSLE equation in a GIS interface successfully provided a set of spatially different management approaches to stop erosion in the study area. The process of calculating RUSLE factors, especially the up scaling methods for R-factor and C-factor, may be helpful for the relative studies. The study findings have identified the presence of high to severe soil erosion in most parts of the Coka watershed of north, north-eastern, north-western, Ethiopia. The study divided the Coka watershed into five erosion severity categories and areas coverage from 299 ha (8%) to 1567 ha (42%) of the study area were observed by the soil loss rates from very low (<5) to severe (>100 t ha−1 y−1), respectively. This indicates that large amount of study area covered by potentially severe erosion. From this, spatial variability in soil loss severity shows the necessity to prioritize land management interventions to the hotspots of soil erosion in the study area. The predicted amount of soil loss and its spatial distribution can provide a basis for comprehensive management and sustainable land-use for the watershed. The areas with high and severe soil erosion hotspots warrant special priority for the implementation of control measures and ultimately improve the livelihood of the local communities. Thus, the government and local community should make mechanisms to protect loss of topsoil by erosion and mitigate climate change which can improve soil fertility and productivity to ensure food security of local community in the study area.
Data availability
All data sets are available on request from the corresponding author (Tadele). The data are not publicly available because they contain information that could compromise the privacy of research participants.
Acknowledgments
We are thankful to the Center of Environmental science at Addis Ababa University and Wachemo University for providing academic and financial support. Mr. Tadele also thanks Dr. Surya, for constant encouragement. We also wish to thank the two anonymous reviewers, and Dr. Daren Jones, Associate Editor, whose suggestions were helpful in significantly improving this manuscript.
Disclosure statement
No potential conflict of interest was reported by the author(s).
References
- Abate, S. (2011). Estimating soil loss rates for soil conservation planning in the Borena woreda of South Wollo highlands, Ethiopia. Journal of Sustainable Development in Africa, 13(3), 87–106.
- Addis, H. K., & Klik, A. (2015). Predicting the spatial distribution of soil erodibility factor using USLE monograph in an agricultural watershed, Ethiopia. International Soil and Water Conservation Research, 3(4), 282–290. https://doi.org/10.1016/j.iswcr.2015.11.002
- Alemu, L., & Tadele, B. (2018). Soil classification and agricultural potentials of soils of Tembaro. Environmental Science, 10(6), 75–91.
- Amsalu, A., Stroosnijder, L., & de Graaf, J. (2007). Long-term dynamics in land resource use and the driving forces in the Beressa watershed, highlands of Ethiopia. Journal of Environmental Management, 83(4), 448–459. https://doi.org/10.1016/j.jenvman.2006.04.010
- Angima, S. D., Stott, D. E., O’neill, M. K., Ong, C. K., & Weesies, G. A. (2003). Soil erosion prediction using RUSLE for central Kenyan highland conditions. Agriculture, Ecosystems & Environment, 97(1–3), 295–308. https://doi.org/10.1016/S0167-8809(03)00011-2
- Arnoldus, H. M. J. (1977). Methodology used to determine the maximum potential range average annual soil loss to sheet and rill erosion in Morocco. Assessing Soil Degradation, FAO Soils Bulletin (FAO), 34, 39–48.
- Asmamaw, L. B., & Mohammed, A. (2019). Identification of soil erosion hotspot areas for sustainable land management in the Gerado catchment, North-eastern. Remote Sensing Applications: Society and Environment, 13(3), 306–317. https://doi.org/10.1016/j.rsase.2018.11.010
- Atoma, H., Suryabhagavan, K. V., & Balakrishnan, M. (2020). Soil erosion assessment using RUSLE model and GIS in Huluka watershed, Central Ethiopia. Sustainable Water Resources Management, 6(1), 12. https://doi.org/10.1007/s40899-020-00365-z
- Berhan, G., Woldeamlak, B, & Bräuning, A. (2014). Model-based characterization and monitoring of runoff and soil erosion in response to land use/land cover changes in the Modjo watershed, Ethiopia. Land Degradation & Development, 26, 711–724. https://doi.org/10.1002/ldr.2276
- Bewket, W., & Teferi, E. (2009). Assessment of soil erosion hazard and prioritization for treatment at the watershed level: Case study in the Chemoga Watershed, Blue Nile Basin, Ethiopia. Land Degradation and Development, 20(6), 609–622. https://doi.org/10.1002/ldr.944
- Biggelaar, C. D., Lal, R., Wiebe, K., & Breneman, V. (2003). The global impact of soil erosion on productivity:I: Absolute and relative erosion-induced yield losses. Journal of Advances in Agronomy, 81, 1–48. https://doi.org/10.1016/S0065-2113(03)81001-5
- Billi, P. (2015). Geomorphological landscapes of Ethiopia. In Landscapes and Landforms of Ethiopia, World Geomorphological Landscapes (pp. 3–32). Dordrecht: Springer. https://doi.org/10.1007/978-94-017-8026-1
- Bizoza, A. R. (2014). Three-stage analysis of the adoption of soil and water conservation in the highlands of Rwanda. Land degradation & development, 25(4), 360–372. https://doi.org/10.1002/ldr.2145
- Bui, E. N., Hancock, G. J., Chappell, A., & Gregory, L. J. (2010). Evaluation of tolerable erosion rates and time to critical topsoil loss in Australia. CSIRO Sustainable Agriculture Flagship.
- Carlos, A. G., Joachim, M., IlseGeijizen, D., & Marc, J. M. (2016). An assessment of soil erosion prevention by vegetation in Mediterranean a Europe: Current trends of ecosystem service provision. Ecological Indicators, 60, 213–222. https://doi.org/10.1016/j.ecolind.2015.06.043
- Cerdà, A., & Doerr, S. H. (2008). The effect of ash and needle cover on surface runoff and erosion in the immediate post-fire period. Catena, 74, 256–263.
- Chakrabortty, R., Pal, S. C., Arabameri, A., Thi Ngo, P. T., Chowdhuri, I., Roy, P., Malik, S., & Das, B. (2022). Water-induced erosion potentiality and vulnerability assessment in Kangsabati river basin, eastern India. Environment, Development and Sustainability, 24(3), 3518–3557. https://doi.org/10.1007/s10668-021-01576-w
- Chakrabortty, R., Pal, S. C., Sahana, M., Ayan Mondal, A., Jie Dou, J., Pham, B. T., & Yunus, A. P. (2020a). Soil erosion potential hotspot zone identification using machine learning and statistical approaches in eastern India. Natural Hazards, 104(2), 1259–1294. https://doi.org/10.1007/s11069-020-04213-3
- Chakrabortty, R., Pradhan, B., Mondal, P., & Pal, S. C. (2020b). The use of RUSLE and GCMs to predict potential soil erosion associated with climate change in a monsoon-dominated region of eastern India. Arabian Journal of Geosciences, 13(20), 1073. https://doi.org/10.1007/s12517-020-06033-y
- Chowdary, V. M., Chakraborthy, D., Jeyaram, A., Murthy, Y. V. N. K., Sharma, J. R., & Dadhwal, V. K. (2013). Multi criteria decision making approach for watershed prioritization using analytic hierarchy process technique and GIS. Water Resources Management, 27(10), 3555–3571. https://doi.org/10.1007/s11269-013-0364-6
- CSA. (2021). Central statistic authority data for Tembaro woreda. Addis Abeba, Ethiopia: Central Statistical Agency.
- Daniel, M., Woldeamlak, B., & Lal, R. (2015). Soil Erosion Hazard Under the Current and Potential Climate Change Induced Loss of Soil Organic Matter in the Upper Blue Nile (Abay) River Basin, Ethiopia. In R. Lal (Ed.), Sustainable intensification to advanced food security and enhance climate resilience in Africa (pp. 137−163). Springer.
- Das, S., Deb, P., Bora, P. K., & Katre, P. (2020). Comparison of RUSLE and MMF soil loss models and evaluation of catchment scale best management practices for a mountainous watershed in India. Sustainability, 13(1), 232. https://doi.org/10.3390/su13010232
- De Asis, A. M., & Kenji Omasa, K. (2007). Estimation of vegetation parameter for modeling soil erosion using linear spectral mixture analysis of Landsat ETM data. ISPRS Journal of Photogrammetry and Remote Sensing, 62(4), 309–324. https://doi.org/10.1016/j.isprsjprs.2007.05.013
- Descheemaeker, K., Nyssen, J., Poesen, J., Raes, D., Haile, M., Muys, B., & Deckers, S. (2006). Runoff on slopes with restoring vegetation: A case study from the Tigray highlands, Ethiopia. Journal of Hydrology, 331(1–2), 219–241. https://doi.org/10.1016/j.jhydrol.2006.05.015
- Durigon, V. L., Carvalho, D. F., Antunes, M. A. H., Oliveira, P. T. S., & Fernandes, M. M. (2014). NDVI time series for monitoring RUSLE cover management factor in a tropical watershed. International Journal of Remote Sensing, 35(2), 441–453. https://doi.org/10.1080/01431161.2013.871081
- El-Swaify, S. A., Dangler, E. W., & Armstrong, C. L. (1992). Soil erosion by water in the tropics. Research extension series, University of Hawaii.
- Elias, E. (2016). Soils of the Ethiopian highlands: Geomorphology and properties. ALTERA, Wageingen University and Research Centre.
- FAO. (1984). (Food and agriculture organization/United Nations development programme), methodology used in the development of soil loss rate map of the Ethiopian highlands. Field document 5 (Rome: FAO). https://doi.org/10.1016/j.iswcr.2019.01.003
- FAO. (2017). Voluntary guidelines for sustainable soil management. Food and Agriculture Organization of the United Nations: Rome, Italy.
- FAO. (2019). Proceedings of the Global Symposium on Soil Erosion, 15–17 May 2019, FAO: Rome. Outcome Document. Available Online: http://www.fao.org/3/ca5697en/ca5697en.pdf
- Fu, B., Zhao, W., Chen, L., Lü, Y., & De, W. (2006). Multi-scale soil loss evaluation index. Chinese Science Bulletin, 51(16), 1936–1943. https://doi.org/10.1007/s11434-006-0448-2
- Ganasri, B. P., & Ramesh, H. (2015). Assessment of soil erosion by RUSLE model using remote sensing and GIS-A case study of Nethravathi basin. Geoscience Frontiers, 7(6), 1–9. https://doi.org/10.1016/j.gsf.2015.10.007
- Garg, V., & Jothiprakash, V. (2012). Sediment yield assessment of a large basin using PSIAC approach in GIS environment. Water Resources Management, 26(3), 799–840. https://doi.org/10.1007/s11269-011-9945-4
- Gebreegziabher, T., Suryabhagavan, K. V., & Raghuvanshi, T. K. (2021). WebGIS-based decision support system for soil erosion assessment in Legedadi watershed, Oromia Region, Ethiopia. Geology, Ecology, and Landscapes, 1–18. https://doi.org/10.1080/24749508.2021.1924441
- Gebreyesus, B., & Kirubel, M. (2009). Estimating soil loss using universal soil loss equation (USLE) for soil conservation planning at Medego Watershed, Northern Ethiopia. Journal of American Science, 5(1), 58–69.
- Gimenez-Morera, A., Ruiz Sinoga, J. D., & Cerda, A. (2010). The impact of cotton geotextiles on soil and water losses from Mediterranean rainfed agricultural land. Land Degradation & Development, 21(2), 210. https://doi.org/10.1002/ldr.971
- Gitas, L. Z., Douros, K., Minakou, C., Silleos, G. N., & Christos, G. K. (2009). Multi-temporal soil erosion risk assessment in N. Chalkidiki using a modified USLE raster model. EARSel eproceedings, 8(1), 40–52. https://doi.org/10.2174/187152809787582507
- GSP (Global Soil Partnership). (2017). Endorses guidelines on sustainable soil management. http://www.fao.org/global-soilpartnership/resources/highlights/detail/en/c/416516/
- Haile, G. W., & Fetene, M. (2012). Assessment of soil erosion hazard in Kilie catchment, East Shoa, Ethiopia. Land Degradation & Development, 23(3), 293–306. https://doi.org/10.1002/ldr.1082
- Hurni, H. (1983a). Soil formation rates in Ethiopia. Working paper 2. Addis Ababa: Ethiopian Highlands Reclamation Studies.
- Hurni, H. (1983b). Soil erosion and soil formation in agricultural ecosystems in Ethiopia and Northern Thailand. Mountain Research and Development, 3(2), 131–142. https://doi.org/10.2307/3672994
- Hurni, H. (1985). Erosion-Productivity Conservation Systems in Ethiopia. 4th ISCO Conference, Venezuala, 654−674.
- Hurni, H. (1993). Land degradation, famine, and land resource scenarios in Ethiopia. In D. Pimentel (Ed.), pp. 27–62.
- Ighodaro, I. D., Lategan, F. S., & Yusuf, S. F. G. (2013). The impact of soil erosion on agricultural potential & performance of sheshegu community farmers in Eastern Cape of South Africa. Journal of Agricultural Science, 5(5), 140–147. https://doi.org/10.5539/jas.v5n5p140
- Karaburun, A. (2010). Estimation of C factor for soil erosion modeling using NDVI in Buyukcekmece watershed. Ozean Journal of Applied Science, 3(1), 77–85.
- Karamage, F., Zhang, C., Kayiranga, A., Shao, H., Fang, X., Ndayisaba, F., Nahayo, L., Mupenzi, C., & Tian, G. (2016). USLE-based assessment of soil erosion by water in the Nyabarongo River Catchment, Rwanda. International Journal of Environmental Research and Public Health, 13(8), 835. https://doi.org/10.3390/ijerph13080835
- Kim, H. S., & Julien, P. Y. (2006). Soil erosion modeling using RUSLE and GIS on the Imha watershed. Water Engineering and Research, 7(1), 29–41. https://doi.org/10.1016/j.jhydrol.2010.01.024
- Kinnel, P. I. A. (2010). Event soil loss, runoff and the universal soil loss equation family of models: A review. Journal of Hydrology, 385(1–4), 384–397. https://doi.org/10.1016/j.jhydrol.2010.01.024
- Kishtawal, C., Niyogi, D., Tewari, M., Pielke, R. A., Sr., & Shepherd, M. (2010). Urbanization signature in the observed heavy rainfall climatology over India. International Journal of Climatology, 30(13), 19081916. https://doi.org/10.1002/joc.2044
- Kuok, K., Mah, D., & Chiu, P. (2013). Evaluation of C and P factors in universal soil loss equation on trapping sediment: Case study of Santubong river. Journal of Water Resource and Protection, 5(12), 1149–1154. https://doi.org/10.4236/jwarp.2013.512121
- Le Roux, J. J., Morgenthal, T. L., Malherbe, J., Pretorius, D. J., & Sumner, P. D. (2008). Water erosion prediction at a national scale for South Africa. Water SA(3), 34, 305–314. https://doi.org/10.4314/wsa.v34i3.180623
- Leh, M., Bajwa, S., & Chaubey, I. (2013). Impact of land use change on erosion risk: An integrated remote sensing, geographic information system and modeling methodology. Land Degradation & Development, 24(5), 409–421. https://doi.org/10.1002/ldr.1137
- Liu, B. Y., Nearing, M. A., Shi, P. J., & Jia, Z. W. (2000). Slope length effects on soil loss for steep slopes. Soil Science Society of America Journal, 64(5), 1759–1763. https://doi.org/10.2136/sssaj2000.6451759x
- Lu, D., Li, G., Valladares, G.S., & Batistella, M. (2004). Mapping soil erosion risk in Rondonia, Brazilian Amazonia: using RUSLE, remote sensing and GIS. Land Degradation & Development, 15(5), 499−512. https://doi.org/10.1002/ldr.634
- Lufafa, A., Tenywa, M. M., Isabirye, M., Majaliwa, M. J. G., & Woome, P. L. (2003). Prediction of soil erosion in a Lake Victoria basin catchment using a GIS-based universal soil loss model. Journal of Agricultural Systems, 76(3), 883–894. https://doi.org/10.1016/S0308-521X(02)00012-4
- Lulseged, T., & Vlek, P. L. G. (2008). Soil erosion studies in Northern Ethiopia. In A. K. Braimoh & V. P.l.g. (Eds.), Land use and soil resources. (pp. 73–100). Springer. https://doi.org/10.1007/9781-4020-6778-5-5
- Lulseged, T., Zenebe, A., James, E., Tesfaye, Y., Kifle, W., Kindu, M., Peter, T., & Quang, B. L. (2017). Mapping soil erosion hotspots and assessing the potential impacts of land management practices in the highlands of Ethiopia.
- Meliho, M., Khattabi, A., Mhammdi, N., & Hongming, Z. (2016). Impact of land use and vegetation cover on risks of erosion in the Ourika watershed (Morocco). American Journal of Engineering Research, 5(9), 75–82.
- Milward, A., & Mersey, J. E. (1999). Adapting the RUSLE to model soil erosion potential in a mountainous tropical watershed. Catena, 38(2), 109–129. https://doi.org/10.1016/S0341-8162(99)00067-3
- Mitasova, H., & Mitas, Z. (1999). Modeling soil detachment with RUSLE 3D using GIS. University of Illinois at Urbana champaign.
- Ndah, H. T., Schuler, J., Uthes, S., Zander, P., Triomphe, B., Mkomwa, S., & Corbeels, M. (2015). Adoption potential for conservation agriculture in Africa: A newly developed assessment approach (QATOCA) applied in Kenya and Tanzania. Land Degradation Development, 26(2), 133–141. https://doi.org/10.1002/ldr.2191
- Oliveira, P. T. S., Alves Sobrinho, T., Rodrigues, D. B. B., & Panachuki, E. (2011). Erosion risk mapping applied to environmental zoning. Water Resources Management, 25(3), 1021–1036. https://doi.org/10.1007/s11269-010-9739-0
- Oliveira, A. H., da Silva, M. A., Silva, M. L. N., Curi, N., Neto, G. K., & Franca de Freitas, D. A. (2013). Development of topographic factor modeling for application in soil erosion models in soil processes and current trends in quality assessment. Intech.
- Pal, S. C., & Chakrabortty, R. (2019). Simulating the impact of climate change on soil erosion in sub-tropical monsoon dominated watershed based on RUSLE, SCS runoff and MIROC5 climatic model. Advances in Space Research, 64(2), 352–377. https://doi.org/10.1016/j.asr.2019
- Pal, S. C., Chakrabortty, R., Arabameri, A., Santosh, M., Saha, A., Chowdhuri, I., Roy, P., & Shit, M. (2022). Chemical weathering and gully erosion causing land degradation in a complex river basin of Eastern India: An integrated field, analytical and artificial intelligence approach. Natural Hazards, 110(2), 847–879. https://doi.org/10.1007/s11069-021-04971-8
- Pal, S. C., Chakrabortty, R., Roy, P., Chowdhuri, I., Das, B., Saha, A., & Shit, M. (2021). Changing climate and land use of 21st century influences soil erosion in India. Gondwana Research, 94, 164–185. https://doi.org/10.1016/j.gr.2021.02.021
- Pal, S. C., & Shit, M. (2017). Application of RUSLE model for soil loss estimation of Jaipanda watershed, West Bengal. Spatial Information Research, 25(3), 399–409. https://doi.org/10.1007/s41324-017-0107-5
- Panagos, P., Borrelli, P., & Meusburger, K. (2015). A new European slope length and steepness factor (LS-factor) for modeling soil erosion by water. Journal OD Geosciences, 5(2), 117–126. https://doi.org/10.3390/geosciences5020117
- Panagos, P., Borrelli, P., Poesen, J., Ballabio, C., Lugato, E., Meusburger, K., Montanarella, L., & Alewell, C. (2015). The new assessment of soil loss by water erosion in Europe. Environmental Science & Policy, 54, 438–447.
- Paveen, R., & Kumar, U. (2012). Integrated approach of universal soil loss equation (USLE) and geographical information system (GIS) for soil loss risk assessment in upper south Koel basin, Jharkhand. Journal of Geographic Information System, 4(6), 588–596. https://doi.org/10.4236/jgis.2012.46061
- Pielke, R. A., Sr., Pitman, A., Niyogi, D., Mahmood, R., McAlpine, C., Hossain, F., Goldewijk, K. K., Nair, U., Betts, R., Fall, S., Reichstein, M., Kabat, P., & de Noblet, N. (2011). Land use/land cover changes and climate: Modeling analysis and observational evidence. Wiley Interdisciplinary Reviews:Climate Change, 2(6), 828–850. https://doi.org/10.1002/wcc.144
- Prasannakumar, V., Vijith, H., Abinod, S., & Geetha, N. (2012). Estimation of soil erosion risk within a small mountainous sub-watershed in Kerala, India, using Revised Universal Soil Loss Equation (RUSLE) and geo-information technology. Geoscience Frontiers, 3(2), 209–215. https://doi.org/10.1016/j.gsf.2011.11.003
- Randolph, J. (2004). Environmental land use planning and management. Island Press.
- Renard, K. G., Foster, G. R., Weesies, G. A., McCool, D. K., & Yoder, D. C. (1997). Predicting soil erosion by water: A guide to conservation planning with the revised universal soil loss equation (RUSLE),Agriculture handbook no. 703. USDA-Agricultural Research Service.
- Risse, L. M., Nearing, M. A., Nicks, A. D., & Laflen, J. M. (1993). Error assessment in the universal soil equation. Soil Science Society of America Journal, 57(3), 825–833. https://doi.org/10.2136/sssaj1993.03615995005700030032x
- Robert, P. S., & Hilborn, D. (2000). Factsheet: Universal soil loss equation (USLE). Index No-572/751. Queen’s printer for Ontario.
- Samuel, G., Kirui, O. K., & Mirzabaev, A. (2016). Economics of Land Degradation and Improvement in Ethiopia. In E. Nkonya, A. Mirzabaev, J. von Braun (Eds.), Economics of Land Degradation and Improvement – a Global Assessment for Sustainable Development. Springer. https://doi.org/10.1007/978-3-319-19168-3_14
- Schmidt, J., Werner, M., & Michael, A. (1999). Application of the EROSION 3D model to the CATSOP watershed, The Netherlands. Catena, 37(3–4), 449–456. https://doi.org/10.1016/S0341-8162(99)00032-6
- Seutloali, K. E., & Beckedahl, H. R. (2015). Understanding the factors influencing rill erosion on roadcuts in the south eastern region of South Africa. Solid Earth, 6(2), 633–641. https://doi.org/10.5194/se-6-633-2015
- Shabani, F., Kumar, L., & Esmaeili, A. (2014). Improvement to the prediction of the USLE K factor. Journal of Geomorphology, 201(1), 229–234. https://doi.org/10.1016/j.geomorph.2013.08.008
- Sheikh, A. H., Palria, S., & Alam, A. (2011). Integration of GIS and Universal soil loss equation (USLE) for soil loss estimation in a Himalayan watershed. Journal of Recent Research in Science and Technology, 3(3), 51–57. https://updatepublishing.com/journal/index.php/rrst/article/view/642
- Shin, G. J. (1999). The analysis of soil erosion analysis in watershed using GIS [Ph.D. Dissertation]. Department of Civil Engineering, Gang-won National University.
- Simms, A. D., Woodroffe, C. D., & Jones, B. G. (2003). Application of RUSLE for erosion management in a coastal catchment, Southern NSW. In: Proceedings of the international congress on modeling and simulation: integrative.
- Sonneveld, B.S. (2002). Land under pressure: The impact of water erosion on food production in Ethiopia. Netherlands: Shaker Publishing
- Sonneveld, B. G. J. S., & Keyzer, M. A. (2003). Land under pressure: Soil conservation concerns and opportunities for Ethiopia. Land Degradation & Development, 14(1), 5–23. https://doi.org/10.1002/ldr.503
- Stone, R. P., & Hilborn, D. (2012). Universal soil loss equation (USLE) factsheet. Ministry of Agriculture, Food and Rural Affairs.
- Tadele, B., Eyasu, E., & Alemu, L. (2022). Analysis and prediction of land-use and land-cover changes and driving forces by using GIS and remote sensing in the coka watershed, Southern Ethiopia. Indian Journal of Agricultural Research. https://doi.org/10.18805/IJARe.A-699
- Tadesse, L., Suryabhagavan, K. V., Sridhar, G., & Gizachew, L. (2017). Land use and land cover changes and soil erosion in Yezat watershed, north western Ethiopia. International Soil and Water Conservation Research, 5(2), 85–94. https://doi.org/10.1016/j.iswcr.2017.05.004
- Tamirie, H. (1995). The Survey of the Soil and Water Resources of Ethiopia. Tokyo: United Nations University.
- Tesfaye, A., Negatu, W., Brouwer, R., & van der Zaag, P. (2013). Understanding soil conservation decision of farmers in the Gedeb watershed, Ethiopia. Land Degradation & Development, 25(1), 71–79. https://doi.org/10.1002/ldr.2187
- Uwemeye, J., Nsanzumukiza, M. V., Maniragaba, A., Ndaruhutse, T., Kulimushi, L. C., Harera, E., & Mucyo, J. C. (2020). Role of local community in Gishwati forest reserve rehabilitation and its implication on local community livelihood. American Journal of Environment and Sustainable Development, 5(3), 43–51.
- Van der Knijff, J. M. F., Jones, R. J. A., & Montanarella, L. (1999). Soil erosion risk assessment in Italy.
- Van der Knijff, J. M., Jones, R. J. A., & Montanarella, L. (2000). Soil erosion risk assessment in Europe. Office for Official Publications of the European Communities. Luxembourg.
- Van Reeuwijk, L. P. (1992). Procedures for Soil Analysis (3rd ed.) International Soil. Reference and Information Center (ISRIC).
- Wainwright, J., & Mulligan, M. (2013). Environmental modeling: Finding simplicity in complexity. Wiley Blackwell Publishing Ltd.
- Walkley, A. J., & Black, I. A. (1934). Estimation of soil organic carbon by the chromic acid titration method. Soil Science, 37(1), 29–38. http://dx.doi.org/10.1097/00010694-193401000-00003
- Wang, G., Jiang, H., Xu, Z., Wang, L., & Yue, W. (2012). Evaluating the effect of land use changes on soil erosion and sediment yield using a grid based distributed modeling approach. Journal of Hydrological process, 26(23), 3579–3592. https://doi.org/10.1002/hyp.9193
- WAO (Woreda Agricultural office), 2022. Annual report of Tembaro woreda agricultural office report SWOT analysis.
- Wenner, C. G. (1980). Soil Conservation in Kenya: Especially in small-scale farming in high potential areas using labor intensive methods ISRIC library.
- Wischmeier, W. H., Johnson, C. B., & Cross, B. V. (1971). A Soil Erodibility Nomograph for Farmland and Construction Sites. Journal of Soil and Water Conservation, 26, 189–193.
- Wischmeier, W. H., & Smith, D. D. (1978). Predicting rainfall erosion losses. A guide to conservation planning. In USDA agriculture handbook n. 537. USDA, p. 58.
- Xin, Z., Yu, X., Li, Q., & Lu, X. X. (2011). Spatiotemporal variation in rainfall erosivity on the Chinese loess plateau during the period 1956–2008. Regional Environmental Change, 11(1), 149–159. https://doi.org/10.1007/s10113-010-0127-3
- Zhang, H., Yang, Q., Li, R., Liu, Q., Moore, D., He, P., Ritsema, C. J., & Geissen, V. (2013). Extension of a GIS procedure for calculating the RUSLE equation LS factor. Computers & Geosciences, 52, 177–188. https://doi.org/10.1016/j.cageo.2012.09.027
- Zhou, Q., Yang, S., Zhao, C., Cai, M., & Ya, L. (2013). A soil erosion assessment of the upper Mekong river in Yunnan Province, China. Mountain Research and Development, 34(1), 36–47. https://doi.org/10.1659/MRD-JOURNAL-D-13-00027.1