
ABSTRACT
Properly mapping the spatial variability of the practiced crop calendars is useful for precise planning of agricultural activities. A seasonal calendar based on the livelihood zone (LHZ) map is widely employed as a crop calendar in Ethiopia. However, using the LHZ-based crop calendar for agricultural purposes may cause problems of doubtful accuracy, since non-ecological parameters are included in the LHZ map. This research was conducted in the central and southeastern parts of Ethiopia to compare the hypertemporal normalized difference vegetation index (NDVI) and LHZ-based stratification methods in explaining the spatial variability of the farmers’ actual crop calendar. A NDVI strata generated from SPOT-VGT and PROBA-V NDVI data of 16 years and the 2008 LHZ map of Ethiopia were processed to select sampling sites that represented three NDVI strata and four LHZs in common. Interview data were collected randomly from individual farmers on ploughing, planting and expected harvesting dates of teff (Eragrostis tef), wheat and barley (fields), and were analysed using non-parametric tests. The results revealed that the NDVI strata had greater spatial quality and precision than the LHZs in terms of uniqueness and internal homogeneity of the spatial units, indicating its suitability as a preferable alternative crop calendar.
Introduction
A crop calendar is defined differently in various literature. According to Kotsuki and Tanaka (Citation2015), a crop calendar is the period during which farmers plant and harvest crops on their cropland. Others describe it broadly as a schedule of all cropping activities starting from the fallow period (International Rice Research Institute [IRRI], Citation2018), through land preparation and planting up to harvesting (De Bie, Citation2000; International Rice Research Institute [IRRI], Citation2018; Van Heemst, Citation1986), storage, and marketing (International Rice Research Institute [IRRI], Citation2018; Van Heemst, Citation1986), including all the required crop management operations (Van Heemst, Citation1986).
A crop calendar is an essential tool for all the parties involved in the agricultural sector (Guo, Citation2013). It is useful for proper timing of planting and other agronomic practices (FAO, Citation2014b, Citation2019; Rea & Ashley, Citation1976), for providing a sufficient amount of input at the right time and place (Guo, Citation2013), for crop monitoring, for accurately estimating agricultural water demand, and for food production or yield forecasting (FAO, Citation2014a; Kotsuki & Tanaka, Citation2015). Thus, it significantly contributes to reduced production costs (International Rice Research Institute [IRRI], Citation2018) and optimum yield. A crop calendar can also be applied in seed relief and rehabilitation programs (FAO, Citation2019; Food and Agriculture Organization of the United Nations [FAO], Citation2010) and for estimating supply, demand, and price fluctuations (MAFFIS, Citation2012).
A crop calendar can be estimated using a variety of techniques, but all are associated with some specific merits and demerits. For instance, the census-based approach, which depends on the agricultural census data collected by national and/or international institutions (Fritz et al., Citation2019; Kotsuki & Tanaka, Citation2015), has high reliability in areas with adequate census data (Portmann et al., Citation2010). However, this method is time-consuming (Fritz et al., Citation2019), labour-intensive and costly because it involves complete enumeration of the population.
In the modelling approach, a crop calendar is estimated based on crop growth models, which predict crop growth by simulation using agricultural and meteorological data such as soil moisture, solar radiation, and temperature (Kotsuki & Tanaka, Citation2015). This method can accurately predict crop growth when parameters are well-calibrated though this is difficult in areas with insufficient census data. Furthermore, this approach has difficulty in identifying the planting dates (Portmann et al., Citation2010) if the cultivation period is significantly influenced by factors other than those considered in the model.
The satellite-based method estimates a crop calendar by using hypertemporal remote sensing data. Time-series data of vegetation indices show the spatial and temporal dynamics of vegetation on the land surface (Fatiha et al., Citation2013), and are thus significantly useful for estimating crop calendars (Kotsuki & Tanaka, Citation2015; Zheng et al., Citation2016). This approach has several advantages, including the use of near-real-time data with consistent spatial and temporal coverage (Khorram et al., Citation2012), and the ability to work at an agro-ecology level (Mumby et al., Citation1999). However, the inability to obtain data through the cloud (National Research Council, Citation2001) and the need for a highly skilled workforce for data processing and analysis are among the drawbacks of the remote sensing-based technique (Umali & Exconde, Citation2003).
Seasonal calendars are extensively used as reference crop calendars for cropping operations in Ethiopia. A seasonal calendar is a chart that depicts the distribution of social and natural events that vary seasonally across months of the year (Sontheimer et al., Citation1999). It is estimated by locally knowledgeable people through rapid rural appraisal or participatory rural appraisal techniques (Sontheimer et al., Citation1999). As a result, a seasonal calendar can be prepared rapidly at low cost (Sontheimer et al., Citation1999) and tends to have high accuracy (Heaver, Citation1992). The seasonal calendars are prepared using the livelihood zones (LHZs) as spatial units (MoARD, Citation2010b). The LHZs are the result of the combined effect of geographic factors such as altitude, rainfall and population density as well as market forces (MoARD, Citation2010a). The LHZ is distinguished at the level of regional states of Ethiopia, and kebele (or neighbourhood) is its smallest administrative unit (MoARD, Citation2010a). Therefore, the seasonal calendar based on LHZ is confounded by non-ecological factors such as population density, market force and administrative boundaries at regional state and kebele levels. In addition, the seasonal calendar is generalized to a monthly basis and tends to exclude the inter-annual variability as local analysts are unlikely to remember the long-term trend of seasonal variation.
NDVI data can also be used to estimate crop phenological attributes such as ploughing, planting, and harvesting dates because these phenological stages are associated with specific NDVI values. Thus, an NDVI data-based stratification approach could serve as a viable alternative to the LHZ-based technique for estimating the crop calendars practiced by farmers. A comparative assessment of these two mapping methods is necessary to identify a preferable method for preparing crop calendars with better spatial accuracy. Thus, the objective of this research was to compare NDVI map-based strata with the LHZ map-based zonation in terms of accurately representing the spatial variability of the practiced crop calendars.
Materials and methods
Data description
The LHZ map published in 2010 jointly by the Ministry of Agriculture and Rural Development (MoARD) of Ethiopia and the USAID was used for this study. The shape file of the LHZ map was downloaded from the web page of the FEWSNET (Citation2009). On the other hand, a total of 576 SPOT-VGT and PROBA-V 10-daily maximum value composite NDVI products at 1 km2 resolution spanning from January 1999 to December 2014 (http://land.copernicus.eu/global/) were used for this study. The image dataset was classified using the ISODATA (ERDAS Inc., Norcross, GA, USA) in a series of unsupervised classification runs with a pre-specified number of classes (10 to 100), and a run with 60 classes was chosen for further study.
The study area
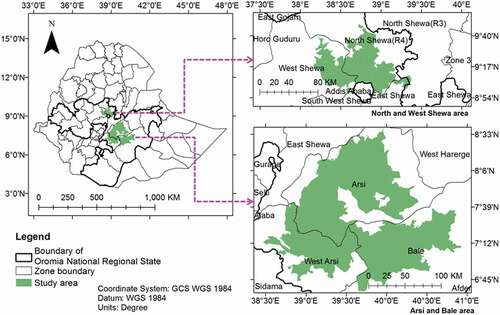
Two neighbouring LHZs with two dominant NDVI classes in common were selected from the central and southeastern parts of Ethiopia as a study area (). The area selected from central Ethiopia consisted of two LHZs named “Ambo-Selale-Gindeberet teff and wheat (AMT)” and “Selale-Ambo highland barley, wheat and horse bean belt (SAW).” The area chosen from the southeastern part of the country is composed of three polygons classified into two LHZs named “Arsi-Bale wheat, barley and potato (ABW)” and “Robe, Chole, Sude and Seru teff, maize and haricot bean belt (RCS).”
Figure 1. Map of the study area.
Description of the LHZs
The AMT LHZ, with two rainy seasons named arfasa/belg (short rainy season extending from March to April) and ganna/kiremt/meher (main rainy season that lasts from June to September), is known for the production of teff and wheat as major crops. The SAW LHZ, where barley, wheat, oats and horse beans are the dominant crops, also has two rainy seasons with similar naming and durations to the AMT LHZ. The ABW LHZ, characterized by bimodal rainfall distribution distinguished as ganna and bona seasons, is known for the cultivation of wheat, barley, pulses, rapeseed and flax. The RCS LHZ, where maize, sorghum, haricot beans, teff and khat (Catha edulis) are the major crops, also has two seasons: arfasa (March–May/June) and ganna (July–November), with the latter being the major (MoARD, Citation2010b).
Description of the NDVI strata
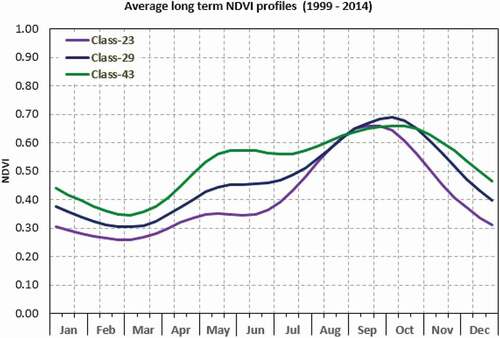
The long-term average NDVI profiles of the NDVI strata studied are presented in . The NDVI profiles of the three NDVI strata are typically characterized by a double peak, indicating the presence of two cropping seasons. The minor and the major peaks represent the short and main cropping seasons of the area, as described in (MoARD, Citation2010b). Stratum 23 is characterized by low level of greenness as well as early start and end of the two seasons because the peaks of the seasons occur earlier in stratum 23 than in the others. Although the beginning of the shorter season is about the same, the major season starts and ends earlier in stratum 29 than in 43. Late seasons, a high amount of greenness and a relatively long duration of the short season are all characteristics of stratum 43.
Figure 2. Average long term (1999–2014) NDVI profile of the NDVI classes studied.
Sampling strategy
Seven towns that were found in the selected units of the two maps (Bekoji, Gasera, Gorfo, Muger, Chole, Chancho, and Holeta) were used to access the sampling sites, called survey strata, for field data collection. A stratified random sampling strategy was employed for selecting the sampling sites.
Field data collection
Farmers from the specific sampling strata were randomly selected and interviewed about the ploughing, planting and expected harvesting dates of teff, wheat and barley for the 2015 major cropping season (known as ganna in the AMT and SAW LHZs and bona in the ABW and RCS LHZs or keremt. Interview data were collected as absolute dates or as dekadal data, designated as early (1–10), mid (11–20) and end (21–30) of a month in the Ethiopian Calendar, during the 28th of September to the 26th of October 2015. Converting the unit of the field data to early, middle and end of a month was necessary to change the absolute dates to the same unit (i.e., decad) with the other field data, and to align the length of duration of the field data with the NDVI data.
Data analysis
The GPS coordinate data were converted from DMS (degrees, minutes and seconds) to DD (decimal degree) and the sample points were mapped with ArcGIS software (ESRI, Citation2016). The data, collected in the Ethiopian Calendar (E.C.), were converted to the Gregorian Calendar and then to Julian date, such that day 1 represented 1 January 2015. Furthermore, dekadal data was converted to absolute dates by representing each dekad by its fifth day. For analysis, the data were arranged following the classifications of the two mapping methods under study, NDVI strata and LHZs.
The data were tested for normality and homogeneity of variance with SPSS software Version 23 (IBM, Citation2016) using the Shapiro-Wilk normality test (Yap & Sim, Citation2011) and Levene’s test, respectively. The Kruskal-Wallis one-way ANOVA was computed to assess whether the spatial units of each mapping technique were significantly different from one another. The Mann-Whitney U test was used to evaluate if two spatial units significantly varied from one another. The median absolute deviation (MAD) and interquartile range (IQR) were used to compare the homogeneity of the spatial units of NDVI and LHZ in order to identify the stratification technique that produced more homogeneous spatial units. The statistical summary and distribution of the data on first ploughing, planting and expected harvesting dates were visualized in a nested box plot using RStudio (RStudio Team, Citation2015).
Results
Description of the field data
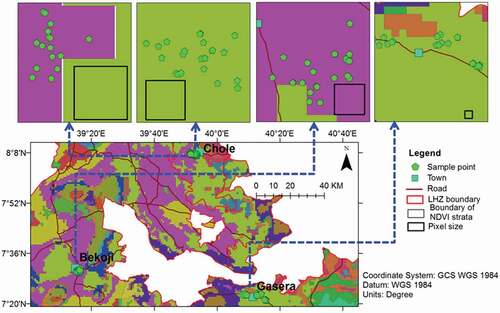
The distribution of the sampling points is shown . The practiced crop calendar data were collected through interview from 53, 89 and 64 fields for teff, wheat and barley, respectively. However, some crops were grown at a few sampling sites during the major cropping season of the survey year. For instance, wheat was not planted at one survey stratum (RCS 29), while barley was not cultivated at two sampling sites (AMT 29 and RCS 29). Furthermore, teff was not planted in half of the total locations sampled (ABW 29, ABW 43, RCS 43 and SAW 23).
Figure 3. Distribution of sample points from the survey strata in North and West Shewa Zones.
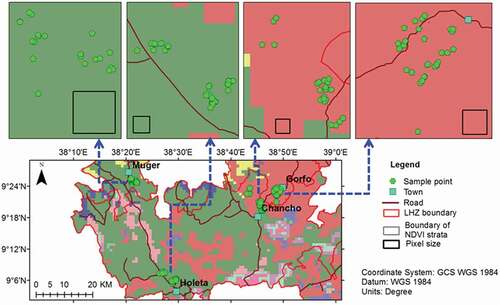
Figure 4. Distribution of sample points from the survey strata in Arsi, West Arsi and Bale Zones.
Among a total of 222 crop fields for which data were collected, 203 fields that were not fallowed in 2014 (2006/07 E.C.) were used for final analysis. The data from 19 crop fields that were fallowed in 2014 were not considered for analysis because the ploughing dates of such fields differed from those that were not fallowed.
The data collected were in different units of date, which necessitated their conversion to the same unit. About two-thirds of the data were in dekad, while the remaining were in absolute date. In terms of the variables studied, 90% and 67% of the data on first ploughing and expected harvesting dates respectively were in dekad, while 75% of the planting date data were in absolute date. Thus, the data collected in absolute dates were converted to decadal data by categorizing days 1–10 as early, 11–20 as middle, and 20-end of month as late, so that the units of the field data aligned and fit with the time units of the remote-sensing data.
Pre-processing of the practiced crop calendar data
The data of all variables for the NDVI classes and the LHZs, except for NDVI class 29 and RCS LHZ for planting date, showed significant (p < 0.05) deviation from normality. Similarly, the variances of the data for many spatial units were not homogeneous, while only a very few were homogeneous (p < 0.05). When the dependent variable deviates from normality, the nonparametric statistic is preferred over the parametric general linear model analysis (Nancy & Anthony, Citation2002). Thus, nonparametric tests were employed.
Overall comparison between the spatial units of each mapping method
Establishing whether the spatial units of the two mapping methods were statistically different from one another was of paramount importance in determining the variability of the crop calendars practiced in separate units of each classification method. In this regard, the Kruskal-Wallis one-way ANOVA revealed highly significant (p < 0.01) differences between all NDVI classes and all LHZs (). This suggests that different crop calendars were practiced by farmers in different NDVI strata as well as LHZs emphasizing the need for pairwise comparison between the spatial units of each mapping method.
Table 1. Kruskal-Wallis rank sum test between all NDVI classes and LHZs.
The other important point was to determine which of the two mapping methods maximized the variability between the corresponding spatial units. The variances of the NDVI classes, represented by chi square values, were higher than those of the LHZs for the three variables studied correspondingly (). This suggests that the NDVI stratification method was better than the livelihood-based zoning technique in maximizing the variability between the resulting spatial units.
Comparison of the NDVI strata versus the LHZs
A pair-wise comparison between the NDVI strata and LHZs was required to determine if there were differences between the spatial units of the two classification methods. This was accomplished through the use of a Mann-Whitney U test, which revealed a significant (P < 0.05) difference between the corresponding NDVI classes and LHZs in many cases (). In the relevant NDVI class versus LHZ comparisons, 75% (6/8) of ploughing and planting dates as well as 62.5% (5/8) of expected harvesting date revealed significant (p < 0.05) difference, while the rest did not show statistical difference (). This indicates the existence of variation between the two mapping methods in terms of explaining the spatial variability of the practiced crop calendars. Therefore, it is worthwhile to identify a method with better spatial quality in terms of precisely representing the farmers’ crop calendars.
Table 2. Mann-Whitney U test between NDVI classes and LHZs.
Pair-wise comparison of the spatial units of each mapping method
A pair-wise comparison of the spatial units of the two mapping methods separately is useful to determine a stratification method that classifies the study area into mutually exclusive units. In this case, the Mann-Whitney U test revealed highly significant (p < 0.01) differences between all pairs of the NDVI classes for all the variables studied (). This indicates that the NDVI stratification method classified the study area into independent units or classes for all the variables studied. In contrast, some livelihood zones (such as ABW vs RCS and AMT vs SAW) were not significantly (p < 0.05) different from one another for planting and harvesting dates when tested with the Mann-Whitney U test, though significant (p < 0.05) variation was observed between all the rest for all variables (). This suggests that the NDVI stratification method outperformed the livelihood-based zoning technique in maximizing the variability between classes.
The other important point was to identify a mapping method that was better in maximizing the internal homogeneity of its corresponding spatial units. For this purpose, the median absolute deviation (MAD) was mostly used to assess the variability of the spatial units of the two mapping methods. However, in some cases, although the Mann-Whitney U test showed significant differences between the relevant spatial units of the two mapping techniques, the MAD of the units were equal. This could be attributed to the data unit, dekad. In such cases, the interquartile range (IQR) was used to assess the internal homogeneity of each spatial unit. Comparison of the MAD and IQR of the spatial units of the two maps () revealed that the NDVI strata were significantly (p < 0.05) better in homogeneity than the LHZs in 10 out of 24 (41.67%) NDVI class vs livelihood zone comparisons, while the LHZs were significantly (p < 0.05) better than the NDVI classes by 29.17% (7/24). The strata of the two maps were statistically equally homogeneous in 7 out of 24 (29.17%) relevant comparisons. Thus, the NDVI strata-based crop calendars () were prepared since the NDVI strata were better than the LHZs in maximizing the heterogeneity between classes and homogeneity within classes.
Figure 5. A NDVI strata-based calendar of the study area for ploughing date using interview data of 2015. The box plot is based on median.
Figure 6. A NDVI strata-based calendar of the study area for planting and expected harvesting dates using interview data of 2015. The box plot is based on median.
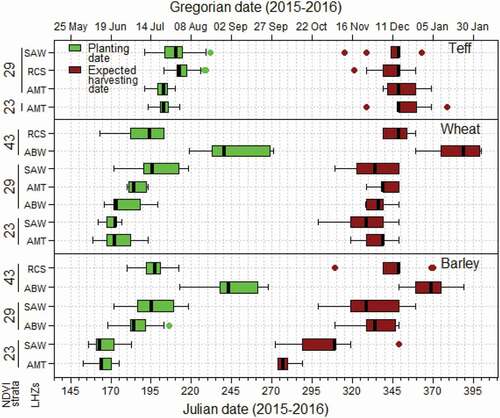
Table 3. Strata homogeneity statistics for NDVI classes and livelihood zones.
Discussion
A crop calendar is an important tool in the agricultural sector because it defines the optimal duration for various agricultural activities and, hence, is useful for effective and resource-efficient planning as well as crop monitoring and rehabilitation programs. A crop calendar that is prepared based on agro-ecological parameters reflects the optimum crop phenology, which in turn implies the precise timing for the relevant agronomic practices. However, the LHZ-based reference crop calendar of Ethiopia is estimated by using ecological (altitude and rainfall) as well as non-ecological (population density and market forces) parameters, in addition to its weakness that it is limited by administrative boundaries (MoARD, Citation2010a). Hence, it may be spatially imprecise. This study has demonstrated that NDVI strata were better than the LHZs in terms of precisely representing and explaining the spatial variability of the farmers’ crop calendars.
The purpose of stratification is to maximize the variation between strata and minimize the variation within strata (Cox & Cohen, Citation1985), so that each stratum is unique and internally homogeneous. The NDVI classification method showed high variability between NDVI classes and low variability within NDVI classes as compared to the level of variability revealed by the LHZ approach between and within the corresponding LHZs. The improvement in spatial quality of the NDVI strata could be explained by the advantages offered by the NDVI data and the ISODATA clustering method. Temporal NDVI variation corresponds to vegetation change and growth, and hence, areas that have the same vegetation dynamics exhibit similar NDVI curves (Zhao et al., Citation2017) or vegetation phenology. On the other hand, the in-built techniques of the ISODATA clustering method maximize the homogeneity within segments and the heterogeneity between segments (Baatz & Schäpe, Citation2000) of the time-series NDVI data that were used as input in the unsupervised classification process.
Although this study has clearly demonstrated the improvements that the NDVI map-based crop calendar can offer over the LHZ map-based crop calendar, the research was associated with some limitations: only a small number of interview data (about 10–17) were collected for each crop; most of the sample points were closer to one another; only the major crops in the survey strata were sampled, despite the fact that farmers grew multiple crops next to one another; the number of pixels sampled per strata was very small in number (approximately between 3–10); and the temporal coverage of the field data was limited to one year of survey work.
Disclosure statement
No potential conflict of interest was reported by the author(s).
References
- Baatz, M., & Schäpe, A. (2000). Multiresolution segmentation: An optimization approach for high quality multi-scale image segmentation. In Strobl, J., Blaschke, T., & Griesbner, G. (Eds.), Angewandte Geographische Informationsverarbeitung XI (p. 270). Karlsruhe, Germany: Herbert Wichmann Verlag.
- Cox, B. G., & Cohen, S. B. (1985). Methodological issues for health care surveys. CRC Press.
- de Bie, C. A. J. M. (2000). Comparative performance analysis of agro-ecosystems (Wageningen University) [Doctoral dissertation]. https://www.wur.nl
- ESRI. (2016). ArcGIS desktop 10.5
- FAO. (2014a). Crop forecasting: Inputs. FAO (Food and agriculture organization of the united nations). http://www.fao.org/nr/climpag/agromet/inputs_en.asp
- FAO. (2014b). Length of growing season. FAO (Food and Agriculture Organization of the United Nations). http://www.fao.org/nr/climpag/about_en.asp
- FAO. (2019). AGP - information resources. FAO (Food and agriculture organization of the united nations). http://www.fao.org/agriculture/crops/information-resources/en/
- Fatiha, B., Abdelkader, A., Latifa, H., & Mohamed, E. (2013). Spatio temporal analysis of vegetation by vegetation indices from multi-dates satellite images: Application to a semi arid area in Algeria. Energy Procedia, 36, 667–675. https://doi.org/10.1016/j.egypro.2013.07.077
- FEWSNET. (2009). Ethiopia - livelihood zone map. http://www.fews.net/east-africa/ethiopia/livelihood-zonemap/november-2009
- Food and Agriculture Organization of the United Nations [FAO]. (2010). Crop calendar. http://www.fao.org/agriculture/seed/cropcalendar/welcome.do
- Fritz, S., See, L., Bayas, J. C. L., Waldner, F., Jacques, D., Becker-Reshef, I., … McCallu, I. (2019). A comparison of global agricultural monitoring systems and current gaps. Agricultural Systems, 168, 258–272. https://doi.org/10.1016/j.agsy.2018.05.010
- Guo, Z. (2013). Mapping the planting dates: An effort to retrive crop phenology information from MODIS NDVI time series in Africa. IEEE International Geoscience and Remote Sensing Symposium - IGARSS, 21-26 July 2013 (pp. 3281-3284). Melbourne, VIC, Australia: IEEE. https://doi.org/10.1109/IGARSS.2013.6723528
- Heaver, R. (1992). Participatory rural appraisal: Potential applications in family planning, health and nutrition programmes. RRA Notes, (16), 13–21. https://www.iied.org/rra-notes-16-applications-for-health
- IBM. (2016). IBM SPSS statistics for windows, version 24.0.
- International Rice Research Institute [IRRI]. (2018). How to develop a crop calendar. http://www.knowledgebank.irri.org/step-by-step-production/pre-planting/crop-calendar
- Khorram, S., Koch, F. H., van der Wiele, C. F., & Nelson, S. A. C. (2012). Remote sensing: SpringerBriefs in space development. Springer.
- Kotsuki, S., & Tanaka, K. (2015). SACRA – Global data sets of satellite-derived crop calendars for agricultural simulations: An estimation of a high-resolution crop calendar using satellite-sensed NDVI. Hydrology and Earth System Sciences Discussions, 12, 1329–1353. https://doi.org/10.5194/hessd-12-1329-2015
- MAFFIS. (2012). AMIS crop calendar. MAFFIS (Mexican agri-food and fishery information service). Agricultural Market Informtion System [AMIS].
- MoARD. (2010a). An atlas of Ethiopian livelihoods. MoARD (Ministry of agriculture and rural development).
- MoARD. (2010b). Oromia region livelihood profiles. MoARD (Ministry of agriculture and rural development).
- Mumby, P. J., Green, E. P., Edwards, A. J., & Clark, C. D. (1999). The cost-effectiveness of remote sensing for tropical coastal resources assessment and management. Journal of Environmental Management, 55(3), 157–166. https://doi.org/10.1006/jema.1998.0255
- Nancy, L. L., & Anthony, O. J. (2002) A call for greater use of nonparametric statistics [Paper presentation]. Paper presented at the paper presented at the annual meeting of the Mid-South educational research association, November 6-8, 2002. Chattanooga, TN, 26 (Research in the Schools/MSERA). https://eric.ed.gov/?id=ED471346.
- National Research Council. (2001). Transforming remote sensing data into information and applications. National Academy Press.
- Portmann, F. T., Siebert, S., & Döll, P. (2010). MIRCA2000 - global monthly irrigated and rainfed crop areas around the year 2000: A new high-resolution data set for agricultural and hydrological modeling. Global Biogeochemical Cycles, 24(1). https://doi.org/10.1029/2008GB003435
- Rea, J., & Ashley, M. (1976). Phenological evaluations using landsat—1 sensors. International Journal of Biometeorology, 20, 240–248. https://doi.org/10.1007/BF01553667
- RStudio Team. (2015). RStudio: Open source and enterprise-ready professional software for R. https://www.rstudio.com/
- Sontheimer, S., Callens, K., & Seiffert, B. (1999). Conducting a PRA training and modifying PRA tools to your needs: An example from a participatory household food security and nutrition project in Ethiopia - PRA tool box. http://www.fao.org/3/x5996e/x5996e00.htm
- Umali, C. G., & Exconde, A. B. (2003) Problems in using remote sensing and GIS in the Philippines [Paper presentation]. Paper presented at the XII world forestry congress ,21-28 September 2003, Quebec, Canada. FAO. http://www.fao.org/3/XII/0261-B1.htm
- van Heemst, H. D. J. (1986). Crop calendar, workability and labour requirements. In H. van Keulen & J. Wolf (Eds.), Modelling of agricultural production: weather, soils and crops (pp. 251–262). Pudoc.
- Yap, B. W., & Sim, C. H. (2011). Comparisons of various types of normality tests. Journal of Statistical Computation and Simulation, 81, 2141–2155. https://doi.org/10.1080/00949655.2010.520163
- Zhao, L., Zhang, P., Ma, X., & Pan, Z. (2017). Land cover information extraction based on daily NDVI time series and multiclassifier combination. Mathematical Problems in Engineering, 2017, 1–13. https://doi.org/10.1155/2017/6824051
- Zheng, Y., Wu, B., Zhang, M., & Zeng, H. (2016). Crop phenology detection using high spatio-temporal resolution data fused from SPOT5 and MODIS products. Sensors, 16(12), 2099. https://doi.org/10.3390/s16122099