
 ?Mathematical formulae have been encoded as MathML and are displayed in this HTML version using MathJax in order to improve their display. Uncheck the box to turn MathJax off. This feature requires Javascript. Click on a formula to zoom.
ABSTRACT
It is becoming increasingly common for cattle grazing routes to be encroached upon and changed to other land uses, and there is no clear indication of just how far these changes will go. The dynamics of land cover and how land is being used in the corridor of cattle grazing routes have received a great deal of attention. In view of this, it is imperative to assess past and future land use and land cover (LU/LC). The study aims to examine the trajectory of LU/LC changes in the cattle grazing route corridor in Benue state. The study used Landsat satellite images from 1980, 2000, and 2020, with a combination of field observations and interviews. A 200-meter buffer was created around the grazing routes, which were used to subset the Landsat images. The Random Forest supervised classification algorithm was used to classify the Landsat images. Cellular Automata (CA) and Land Change Modeler (LCM) were used to simulate the future LU/LC pattern of the grazing routes for 2050. Based on the findings, cropland and built-up areas had grown dramatically at the expense of forest and grassland. Cropland increased at an average rate of 18.18 km2/yr between 1980 and 2000. The study recommends stringent measures to regulate the causes of LU/LC changes in cattle grazing corridors.
1. Introduction
Land use and land cover dynamics (LU/LC) are crucial to a sustainable environment and development, which have been defined in a variety of ways (Hassan et al., Citation2016). Land use denotes land that is used for functional purposes such as economic activity, whereas land cover denotes the distribution of features on the earth’s surface such as plants, water, and soil (Nedd et al., Citation2021). Changes in LU/LC are a key driver of environmental change, which has become a global concern due to its impact on local, regional, and global habitats (Karki et al., Citation2018). Changes in LU/LC are influenced by anthropogenic and natural forces both globally and locally (Kolb et al., Citation2013). Population growth, deforestation, urbanization, and other anthropogenic activities are known to play a substantial influence in driving these changes (Permatasari et al., Citation2021).
Changes in LU/LC have far-reaching repercussions that are felt at the local, regional, and global levels (Girma & Hassan, Citation2014). Grazing is the primary land use across at least a quarter of the world’s land surface, with animals grown on food primarily derived from grazing lands (Wright et al., Citation2015). Population expansion, climate change, drought, and government policies all have a significant impact on the level of degradation of grazing pastures in Sub-Saharan Africa (SSA; Mohammed et al., Citation2017). The most significant LU/LC conversion in SSA has been the conversion of vegetated land to agricultural land (Permatasari et al., Citation2021).
Between 1992 and 2015, agricultural expansion in Nigeria was by far the biggest. As a result, farming and urbanization have encroached on many historic grazing routes used for both daily grazing and migration (Usman & Nichol, Citation2022). Tropical grasslands alone will cover 18 million square kilometers, with natural vegetation utilized by nomadic animals in need of feed and water all year. Land use intensification has resulted from rising demand for grain and animal-based food, as well as raw materials for industry and export (Food and Agriculture Organization, Citation2009).
Remote sensing of satellites can now provide forecasts and assessments of the LU/LC change at various spatio-temporal scales (Wentz et al., Citation2014). The crucial thing is to take proactive measures and simulate future land use, which is where Remote Sensing and Geographic Information Systems (GIS) come in. Satellite technology has played a huge role in improving the state of the world and will continue to do so as technological innovation allows large new fleets of small satellites with radical new capabilities to be deployed (Woldai, Citation2020). Earth Observation (EO) satellites allow for the monitoring of urbanization, deforestation, and desertification, as well as the making of informed decisions (World Economic Forum, Citation2015).
Human activities have had a significant impact on LU/LC, which has been identified as a global environmental issue. As a result, determining the pattern of LU/LC changes and the drivers behind them is critical for making land use planning and management decisions (Arowolo & Deng, Citation2018; Ji et al., Citation2014). Qualitative and quantitative information can be visualized and analyzed using Remote sensing and GIS (Hussain et al., Citation2022). Remote sensing and GIS have shown tremendous promise in understanding landscape dynamics and environmental monitoring (Armin et al., Citation2020). Because of their multi-temporal, multi-spectral, and multi-spatial resolution potential, satellite remote sensing and GIS have been widely deployed and regarded as powerful and effective tools in identifying LU/LC changes (Kumar et al., Citation2018).
Several studies have been carried out to assess changes in grazing routes and land. Usman and Nichol (Citation2022) evaluated changes in agricultural and grazing land in West Africa and discovered that the availability of grazing area in Kano City, West Africa declined by 150% and followed by 300% between 1980 and 2014. Fenetahun et al. (Citation2020) noted that between 1992 and 2019, there was a significant change in rangeland to other land use categories in Southern Ethiopia. Shapero et al. (Citation2022) assessed changes in land cover and land use in Santa Barbara County, USA, and reported that between 1984 and 2019, 13% of range land parcels have been converted to vineyards. However, an analysis of the impacts of LU/LC changes on the corridors of cattle grazing routes has never been explored. Cattle grazing routes are encroached on and converted to other land uses. Therefore, the purpose of this study was to investigate and forecast LU/LC changes in the cattle grazing corridors in Benue State, Nigeria. This research is critical because it will aid in the development of regulations governing land management practices and the sustainable use of natural resources in the grazing routes.
2. Materials and methods
2.1 Study area
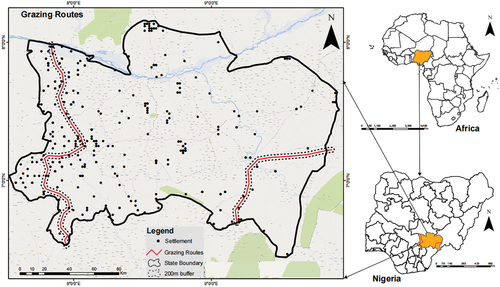
The cattle grazing routes run through Benue State, spanning the western and eastern parts of the state. The western part lies between Latitudes 6° 32’ 37” N and 8° 0’ 34”N and Longitudes 7° 49’ 22”E and 7° 50’ 18”E. The eastern part lies between Latitudes 6° 41’ 40” N and 7° 13’10’N’ and Longitudes 9° 09’ 35”E and 9° 10’ 43”E (). They are situated within the Lower Benue Trough, which separates the north-central highlands from the south-eastern scarp lands and the Cross-River Plains (Ujoh, Citation2014). The total length of the grazing routes is 327.69 km and covers an area of 950.54 km2
Figure 1. Geographic location of the case study in Benue State, Nigeria.
2.2 Data
In this study, the Landsat Multispectral Scanner (MSS) of 1980, Enhanced Thematic Mapper (ETM) of 2000, and Landsat 8 Operational Land Imager/Thermal Infrared Sensor (OLI/TIRS) of 2020 were utilized for this study. All images of 30 m resolution with paths/rows of 188/55, 187/55, 188/54, 188/56, and 187/57 were obtained from United State Geological Survey for Earth Resources Observation and Science (USGS-EROS) via https://earthexplorer.usgs.gov/. The shapefile of the grazing routes was obtained from the Federal Ministry of Agriculture and Rural Development ().
Table 1. Specification of Raster and Vector Datasets.
The perspectives of farmers and cattle herders were gathered through interviews. Land-use history, status, drivers, and implications of LU/LC modifications were evaluated with the help of farmers and cattle herders. To identify the challenges and opportunities perceived by farmers and herders, transect walks were conducted with the assistance of a cattle herder to determine the official/traditional landmarks that define the extent of the grazing routes. The distance between the landmarks and the grazing route was measured on-site. A total of 53 informants were randomly selected and interviewed.
2.3 LU/LC classification
Grazing routes are defined by landmarks that act as setbacks to ensure cattle’s right of way. Between the landmarks and the routes, a distance of 200 meters was measured. This led to the creation of a buffer of 200 meters, which was superimposed on the three satellite images and clipped.
The Landsat images have been enhanced geometrically and atmospherically. In ArcGIS Pro 2.8 software, composite bands were used to conduct the False Color Composite (FCC) procedure. Landsat MSS and ETM images were stacked in the order of bands 4, 3, and 2, while Landsat 8 OLI/TIRS images were stacked in the order of bands 5, 4, and 3 (Atubi et al., Citation2018; Onilude & Vaz, Citation2020; Shittu et al., Citation2016). The spectral signature of the features was used to analyze, extract, and create training samples using visual image interpretation (). A supervised classification was performed using the Random Forest algorithm. Field data and Google Earth were utilized to verify the classification’s accuracy. The post-processing technique was used to detect changes between 1980 and 2020 ().
Figure 2. Methodology flowchart.
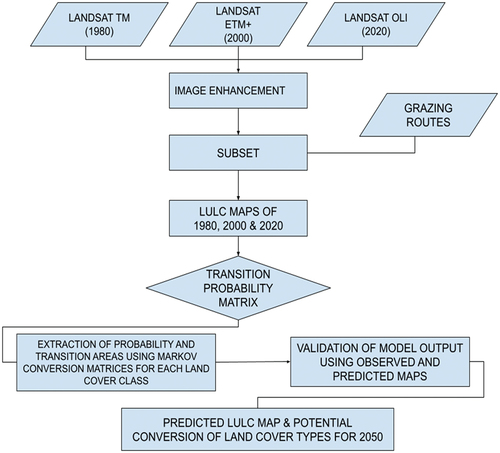
Table 2. Table showing the LULC types and their descriptions.
The rate of change and percent of change was computed for LU/LC classes by using Equation (1) and (2).
where Lx is the area of an earlier land cover image, Ly is the area of a later land cover image, and T is the time interval between Lx and Ly in years.
2.4 LU/LC transformation
This study predicted the LU/LC changes on the cattle grazing routes for 2050 using Land Change Modeller (LCM). The TerrSet software’s LCM module is developed to assess changes in LU/LC and predict potential future changes. This model is built on artificial neural networks (ANN), Markov Chain matrices, and transition suitability maps obtained by training logistic regression models (Ansari & Golabi, Citation2019). The LCM incorporates past LU/LC maps to quantitatively model the relationship between LC transitions and driver variables to model future LU/LC (Eastman & Toledano, Citation2018). The prediction of LU/LC changes is based on the assessment of historical LU/LC changes, evaluation of the transition potential/driver variables, simulation of future LU/LC, and model validation. The LU/LC maps for the years 1980 and 2020 were used to derive the transition probabilities image using the Markov change analysis. The change probabilities maps were used as input to the Cellular Automata (CA) to model future LU/LC distribution. The LU/LC transition between 2000 and 2020 was used to predict LU/LC for 2050. Sub-model transition was generated for LU/LC with significant changes. Three sub-models were used to predict 2050 (Cropland to Built-up, Grassland to Cropland, and Forest to Cropland). The change detection statistics were computed by comparing the images of successive periods and the predicted image for 2050 (Eastman, Citation2016; Fathizad et al., Citation2015). The Markov matrix model forecasts LU/LC change using the Bayes equation, which evaluates the change.
where 0 ≤ Pij < 1 and ∑ = 1 Pij = 1, (i, j = 1, 2, …, n). The cellular automata model can be expressed in the equation:
where S(t) and S(t + 1) are the system status at times t and t + 1, respectively, N – cellular field, The state of each cell at time t + 1 is determined by the neighboring cells’ states based on predefined transition methods in discrete dynamical systems known as CA. CA simulates the spatial dynamics and temporal evolution of two-dimensional objects (Ye & Bai, Citation2007). The CA model incorporated both global and local activities. CA can simulate global changes even though it is achieved through local computation. In global models, all variables are assumed to be the same (Yang et al., Citation2016). Because of its ability to fit complex spatial nature using simple and effective rules, the CA approach is increasingly being used to model urban growth and LU/LC (Nouri et al., Citation2014).
2.4.1 Accuracy assessment and kappa coefficient
To assess the accuracy of the classifications, a total of two hundred random sampling points were used. The classification accuracy was assessed by overall accuracy and kappa coefficients using an error matrix (Anand et al., Citation2017; Mathur & Foody, Citation2008). The accuracy is assessed using Equationequation 6(6)
(6) :
The kappa coefficient is determined using equation 7:
3. Results
3.1 Analysis of LU/LC changes on the corridor of the Grazing routes
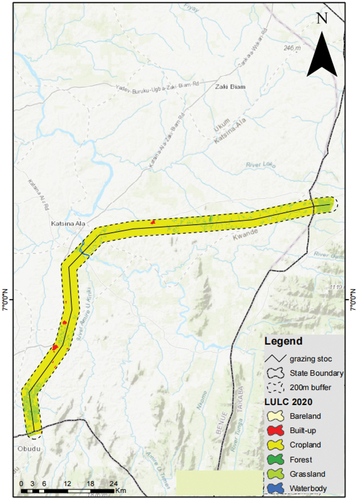
The LU/LC have been created for the years 1980, 2000, and 2020. show the distribution of LU/LC on the western and eastern parts of the grazing corridor. In 1980, grassland and forests were the predominant land use. However, in 2000, the rapid transformation of the grazing routes into other land uses was observed. Cropland increased sporadically, which resulted in the decline of grassland and forest. In 2020, there was a minor growth in the built-up (urban) area while cropland expansion was observed, leading to further degradation of grassland and forest.
Figure 3. a LULC on the western side of the grazing route in 1980. b: LULC on the eastern side of the grazing route in 1980. c LULC on the western side of the grazing route in 2000. d LULC on the eastern side of the grazing route in 2000. e: LULC on the western side of the grazing route in 2020. f LULC on the eastern side of the grazing route in 2020.
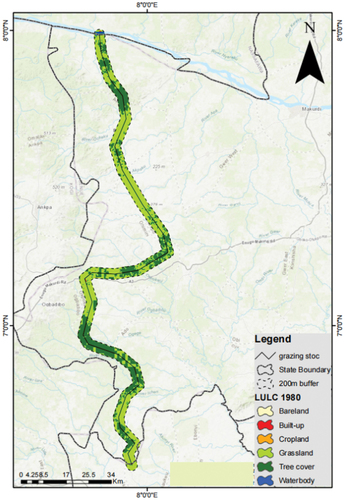
Figure 3. (Continued).
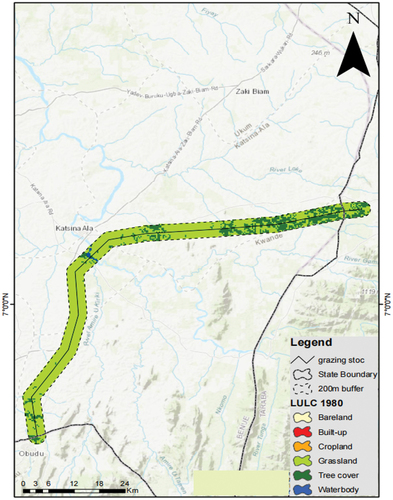
Figure 3. (Continued).
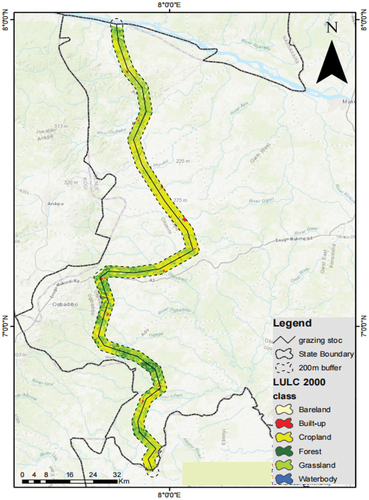
Figure 3. (Continued).
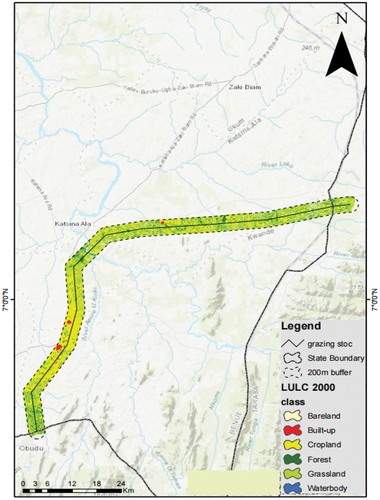
Figure 3. (Continued).
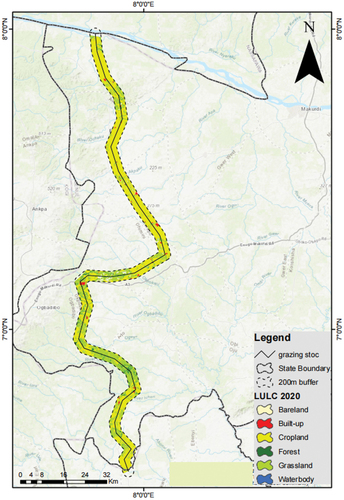
Figure 3. (Continued).
The distribution of LU/LC in the grazing routes is shown in . In 1980, grassland and forest made up 54.28% and 45.34% of the routes, respectively, while cropland and built-up areas made up 0.01% and 0.13%. Cropland grew astronomically to 38.38% in 20 years (1980–2000), while forest and grassland decreased to 13.29% and 46.54%, respectively. Additionally, the built-up increased somewhat to 0.95%. In 2020, built-up increased to 1.05%, while cropland continued to rise quickly to 66.41%. Significantly, forest and grassland reduced to 3.09% and 28.69%, respectively ().
Figure 4. Chart showing the Spatio-temporal Change of the various land cover types.
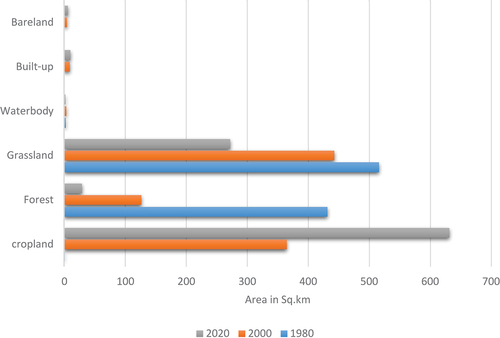
Table 3. LULC coverage along grazing routes of 1980, 2000 and 2020.
3.1.1. Accuracy assessment
shows the level of accuracy for the various LU/LC for the years 1980, 2000, and 2020. For the years 1980, 2000, and 2020, the classification’s overall accuracy is 80.1%, 82.5%, and 85.2%, respectively. The classification’s Kappa coefficients are 0.79, 0.81, and 0.83 for 1980, 2000, and 2020, respectively.
Table 4. Accuracy assessment and kappa coefficient.
3.2 Rate of change
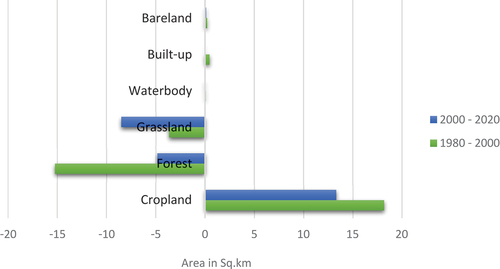
With an average rate of change of 18.18 km2/yr, cropland changed positively between 1980 and 2000. Grassland and forest were negative with an average rate of change of −3.67 km2/yr and −15.23 km2/yr. With an average rate of change of 0.45 km2/yr, built-up was positive. The average rate of change for waterbody and bareland were 0.054 km2/yr and 0.216 km2/yr. While the average rate of change in cropland and built-up between 2000 and 2020 was 13.30 km2/yr and 0.049 km2/yr. Grassland and forest had an average rate of change of −8.53 km2/yr and −4.84 km2/yr. The average rate of change for the waterbody was −0.0715 km2/yr ().
Figure 5. Chart showing the Rate of Change among the various land cover types.
3.3 Projected LULC changes
The transition probability matrix (TPM) was obtained from the LCM module in IDRISI Terrset. Based on area suitability and the presence of driving forces, TPM assesses the likelihood of LU/LC switching from one class to another. shows the TPM produced by modeling the period between 2020 and 2050. The bolded values along the TPM diagonal axis indicate that the Transition Probability (TP) of a given LU/LC type will remain constant from time (t1) to time (t2), whereas the off-diagonal TPM axes indicate that a given LU/LC will change from one class to another. The cross-tabulation method is used to calculate the amounts of change and conversions between various land cover maps. Cropland has a probability of 4.8% and 0.65% to change into grassland and waterbody respectively. The probability that Cropland will remain as Cropland is 93.54%. The TP that the forest will remain unchanged is 12.01% while the TP of a forest changing into cropland and grassland is 49.5% and 34.8% respectively. The likelihood of grassland transiting into cropland and built-up is 71.01% and 0.3%. The probability that grassland will remain grassland is 23.56%. The TP that waterbody will remain unchanged is 3.89%. Waterbody transiting to cropland will be 71.4% while grassland will be 22.6%. The propensity that built-up will remain unchanged is 88.8%. The likelihood of built-up changing to cropland and grassland is 2.51% and 2.75% respectively. The probability of bareland changing to built-up and cropland is 0.19% and 6.6%, while the TP that bareland will remain constant is 78.3%.
Table 5. Table showing the TPM produced by modeling the period between 2020 and 2050.
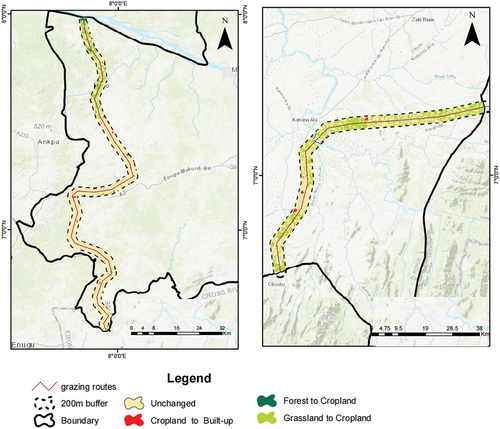
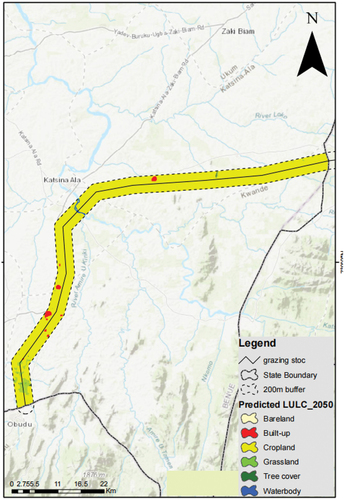
The most significant transition between different land cover types by 2050 is shown in . In the north of the study area’s western side and very much everywhere along the grazing route on the east, the transition between grassland and crops will be apparent.
Figure 6. The potential conversion of various land cover types by 2050.
The findings of the simulation for 2050 using the 2020 LU/LC as the base map are shown in . Based on the projection, it can be seen that built-up is expected to increase on the western side of the grazing route more than on the eastern side. The conversion of land to cropland will also increase on the eastern side than on the western side.
Figure 7. a Projected LULC of the grazing route on the western side in 2050. b Projected LULC of the grazing route on the eastern side in 2050.
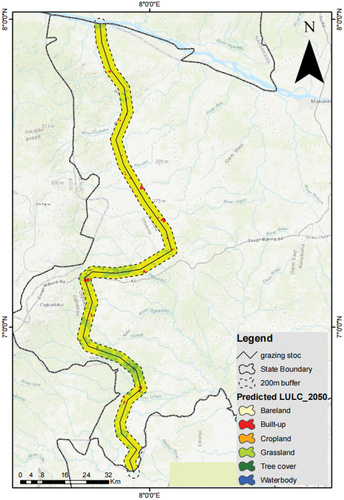
Figure 7. (Continued).
shows the spatial and temporal variations between 2020 and 2050 in terms of area and size. According to the outcome, cropland will rise from 66.41% in 2020 to 82.91% in 2050. By 2050, built-up is projected to rise from 1.05% in 2020 to 1.15%. Grassland will drastically decline from 28.60% in 2020 to 13.31% in 2050, and the forest is predicted to decline from 3.09% in 2020 to 2.02% in 2050. By 2050, the waterbody will shrink to 0.21%. The area coverage of bareland will decrease to 0.05% in 2050 from 0.63% in 2020.
Table 6. Descriptive statistics of LULCs that show the areal extent and Spatio-temporal changes between 2020 and 2050.
3.4 Drivers and impacts of the LU/LC changes
The main drivers of the LU/LC changes between 1980 and 2020 have been identified. According to , 41% of respondents ascribed the changes to population growth. Agriculture (small-scale farms) and grazing came in second and third, with 26% and 17%, respectively. Firewood extraction accounted for 13%, with logging accounting for 3%.
Figure 8. a. Perceived drivers of LU/LC change. b. Perceived impacts of LU/LC change.
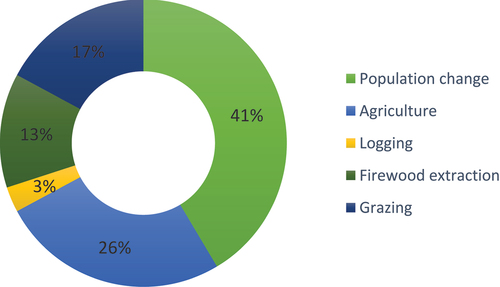
Figure 8. (Continued).
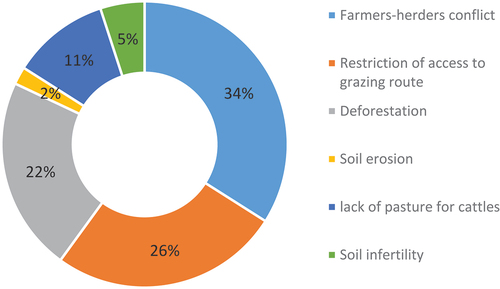
Similarly, the impacts of these LU/LC changes on grazing corridors between 1980 and 2020 include conflict between farmers and herders (34%), restricted access to grazing routes (26%), deforestation (22%), scarcity of pasture for cattle (11%), soil infertility (5%), and soil erosion (2%; ).
4. Discussion
The study investigated LU/LC changes around the 200-meter radius of the cattle grazing routes from 1980 to 2020 and predicted future land use. Findings revealed that grassland and forest were the major LU/LC accounting for 54.28% and 45.34% of the grazing routes in 1980 while built-up was 0.01%. In 2000, cropland and built-up increased to 38.38% and 0.95% while forest and grassland decreased to 13.29% and 46.54% respectively. The findings are similar to studies that were done by Habte et al. (Citation2020) and Fenetahun et al. (Citation2020).
Furthermore, a 66.41% increment in cropland was observed as grassland and forest areas continue to decrease in 2020. Between 1980–2000, cropland gained considerably with an average rate of change of 18.18 km2/y while the loss in grassland and forest were −3.67 km2/yr and −15.23 km2/y respectively. Built-up gained at an average rate of change of 0.45 km2/yr. In the period 2000–2020, cropland and built-up further gained with an average rate of change of 13.30 km2/yr and 0.049 km2/yr, negatively affecting grassland and forest with an average rate of change of −8.53 km2/yr and −4.84 km2/yr.
In 2050, based on Markov chain prediction, cropland will increase to 82.91%, and built-up to 1.51%. By extension, these projected increases in cropland and built-up will further reduce forest and grassland cover to 2.02% and 13.31% by 2050. The projected increase in the cropland and its detriments to grassland and forest were also observed in studies conducted by Kuule et al. (Citation2022); Daba and You (Citation2022).
Drivers accelerating the LU/LC transitions include population growth, grazing, firewood extraction, logging, and deforestation. Some farmers and cattle herders living in communities along the grazing routes were unanimous in their perception that population growth is the most influential driver of the changes (Ihemezie & Dallimer, Citation2021; Obayelu, Citation2014). The rapid increase in population has transformed communities that were hitherto farmsteads into towns and they are already encroaching into the grazing route without due recourse to its right of way. As the population increase further, residents along the grazing route take up land to build houses and cultivate into these routes. From the herders’ perspectives, these routes have become highly restrictive to the point that livestock can no longer access lush vegetation and water point. The backlash to this restriction is deadly clashes between farmers and herders (Chunwate et al., Citation2021). Traditional land use of the routes is grazing, which is usually done by the nomadic Fulani ethnic group. Cattle herding is an age-long occupation and tradition of the Fulani who migrate southward from the north through designated routes in search of pasture and water for the survival of their livestock but cattle migration along these routes has destroyed the vegetation and reduced soil quality.
Farming activities have resulted in deforestation and reduced pasture for cattle. Farmers clear out forests and grasslands to create more space for cultivation while others engage in extracting firewood for energy and business (Chiteculo et al., Citation2018). Agricultural expansion, logging, and firewood extraction have harmed biodiversity and habitat. A similar loss of habitat through the removal of vegetation for agriculture has been observed in rangeland areas in central Uganda (Kuule et al., Citation2022). In 2010, it was reported that Benue state had 73.5kha of tree cover, extending over 2.3% of its land area. In 2021, it lost 853 hectares of tree cover, equivalent to 232kt of CO2 emission (Global Forest Watch, Citation2021). The projected LU/LC analysis for 2050 indicates that cropland will expand further at the expense of forest and grassland. Community members have reported a decline in commercial logging activities but these were intense in the 80s and 90s (Leta et al., Citation2021). The ecological footprint of the logging activities between 1980–2000 was enormous, almost depriving the corridors of an assemblage of tree cover. Logging is part of a supply chain that provides the raw material for a local industry that specializes in the production of mortar and pestle used for pounding and crushing food ingredients in homes across Nigeria. These local industries are concentrated around major towns along the grazing routes.
Around the world, grassland, and forest are decreasing while cropland and built-up are increasing (Cheruto et al., Citation2016; Keshtkar & Voigt, Citation2016; Liu et al., Citation2014). The findings of this study can provide the basis for the formulation of policy critical for future sustainable land management/monitoring, and planning to mitigate the impacts of LU/LC changes on the grazing routes.
5. Conclusion
The study assesses the Spatio-temporal LU/LC changes on the corridor of grazing in Benue state from 1980–2020 and predicted the LU/LC for 2050 using Landsat data. The result shows that between 1980 − 2000 cropland and built-up have increased by 38.38% and 0.95% respectively whereas grassland and forest decreased by 46.54% and 13.29%. In 2020, cropland expanded to 66.41% and built up by 1.05%. Concomitantly, grassland and forest decreased to 28.60% and 3.09%. Projection of future LU/LC shows that built-up and cropland will increase to about 1.51% and 82.91% while grassland and forest will reduce to 13.31% and 2.02% by 2050. Based on community perception, the two major drivers influencing the changes include population growth, and agricultural expansion while their impacts include farmers-herders clash, deforestation, restriction of access to grazing routes, and lack of pasture for cattle. The study underscores the relevance of the geospatial technique and local knowledge in understanding the dynamics of LU/LC on the corridor of the grazing routes. The study recommends that actionable policy must be formulated to ensure sustainable monitoring and management of the grazing routes across the country to mitigate the impacts of dynamics of LU/LC changes.
Acknowledgments
The authors appreciate the contributions of the Department of Strategic Space Applications (NASRDA) in providing the necessary data and a conducive environment for conducting this research. The authors appreciate the anonymous reviewers and editor for the constructive critique and suggestions.
Disclosure statement
No potential conflict of interest was reported by the author(s).
References
- Anand, R., Veni, S., & Aravinth, J. (2017). Big data challenges in airborne hyperspectral image for urban landuse classification. 2017 international conference on advances in computing, communications and informatics (ICACCI), 1808–1814.
- Ansari, A., & Golabi, M. H. (2019). Prediction of spatial land use changes based on LCM in a GIS environment for Desert Wetlands–A case study: Meighan Wetland, Iran. International Soil and Water Conservation Research, 7(1), 64–70. https://doi.org/10.1016/j.iswcr.2018.10.001
- Armin, M., Majidian, M., & Kheybari, V. G. (2020). Land use/land cover change detection and prediction in the Yasouj City Suburbs in Kohgiluyeh Va Boyerahmad Province in Iran. Arid Ecosystems, 10(3), 203–210. https://doi.org/10.1134/S2079096120030129
- Arowolo, A. O., & Deng, X. (2018). Land use/land cover change and statistical modelling of cultivated land change drivers in Nigeria. Regional Environmental Change, 18(1), 247–259. https://doi.org/10.1007/s10113-017-1186-5
- Atubi, A. O., Awaritefe, D. O., & Toyon, A. B. (2018). Analysis of land use and land cover change characteristics in Warri metropolis, Nigeria. International Journal of Development and Sustainability, 7(3), 1143–1168. https://www.isdsnet.com/ijds-v7n3-22.pdf
- Cheruto, M. C., Kauti, M. K., Kisangau, D. P., & Kariuki, P. C. (2016). Assessment of Land Use and Land Cover Change Using GIS and Remote Sensing Techniques: A Case Study of Makueni County, Kenya. https://doi.org/10.4175/2469-4134.1000175
- Chiteculo, V., Lojka, B., Surový, P., Verner, V., Panagiotidis, D., & Woitsch, J. (2018). Value chain of charcoal production and implications for forest degradation: Case study of Bié Province, Angola. Environments, 5(11), 113. https://doi.org/10.3390/environments5110113
- Chunwate, B. B., Simon Yerima, Y., Samuel, A. Α., Simon Yerima, C. B., & Samuel Ρ, A, Σ. Y. (2021). Analysis of Land-Use Conflict between Farmers and Pastoralists in Gwagwalada Area Council of Abuja, Nigeria. https://journalofscience.org/index_php/GJSFR/article/view/2952
- Daba, M. H., & You, S. (2022). Quantitatively assessing the future land-use/land-cover changes and their driving factors in the upper stream of the Awash river based on the ca–Markov model and their implications for water resources management. Sustainability (Switzerland), 14(3). https://doi.org/10.3390/su14031538
- Eastman, J. R. (2016). Terrset: geospatial monitoring and modeling system manual. Clark University (www.clarklabs.org). Clask Labs.
- Eastman, J. Ronald., & Toledano, James. (2018). A short presentation of the land change modeler (LCM). In Geomatic approaches for modeling land change scenarios (pp. 499–505). Springer. https://doi.org/10.1007/978-3-319-60801-3_36
- Fathizad, H., Rostami, N., & Faramarzi, M. (2015). Detection and prediction of land cover changes using Markov chain model in semi-arid rangeland in western Iran. Environmental Monitoring and Assessment, 187(10), 1–12. https://doi.org/10.1007/s10661-015-4805-y
- Fenetahun, Y., Yong-Dong, W., You, Y., & Xinwen, X. (2020). Dynamics of forage and land cover changes in Teltele district of Borana rangelands, southern Ethiopia: Using geospatial and field survey data. BMC Ecology, 20(1), 1–16. https://doi.org/10.1186/s12898-020-00320-8
- Food and Agriculture Organization. (2009). Review of evidence on drylands pastoral systems and climate change: Implications and opportunities for mitigation and adaptation. Land and Water Discussion Paper, 8, 38. https://www.fao.org/3/cb8461en/cb8461en.pdf
- Girma, H. M., & Hassan, R. M. (2014). Drivers of land-use change in the Southern Nations, nationalities and People’s Region of Ethiopia. African Journal of Agricultural and Resource Economics, 9(2), 148–164. Girma and Hassan.pdf. http://www.afjare.org/resources/issues/vol_9_no2/6
- Global Forest Watch. (2021). No Title. https://www.globalforestwatch.org/dashboards/country/NGA/
- Habte, M., Eshetu, M., Legesse, A., Maryo, M., & Andualem, D. (2020). Land use/cover change analysis and its implication on livestock feed resource availabilities in southeastern rangeland of Ethiopia. doi:10.22541/au.160157507.76047878.
- Hassan, Z., Shabbir, R., Ahmad, S. S., Malik, A. H., Aziz, N., Butt, A., & Erum, S. (2016). Dynamics of land use and land cover change (LULCC) using geospatial techniques: A case study of Islamabad Pakistan. SpringerPlus, 5(1), 812. https://doi.org/10.1186/s40064-016-2414-z
- Hussain, S., Lu, L., Mubeen, M., Nasim, W., Karuppannan, S., Fahad, S., Tariq, A., Mousa, B. G., Mumtaz, F., & Aslam, M. (2022). Spatiotemporal variation in land use land cover in the response to local climate change using multispectral remote sensing data. Land, 11(5), 595. https://doi.org/10.3390/land11050595
- Ihemezie, E. J., & Dallimer, M. (2021). Stakeholders’ perceptions on agricultural land-use change, and associated factors, in Nigeria. Environments - MDPI, 8(11). https://doi.org/10.3390/environments8110113
- Ji, W., Wang, Y., Zhuang, D., Song, D., Shen, X., Wang, W., & Li, G. (2014). Spatial and temporal distribution of expressway and its relationships to land cover and population: A case study of Beijing, China. Transportation Research Part D: Transport and Environment, 32, 86–96. https://doi.org/10.1016/j.trd.2014.07.010
- Karki, S., Thandar, A. M., Uddin, K., Tun, S., Aye, W. M., Aryal, K., Kandel, P., & Chettri, N. (2018). Impact of land use land cover change on ecosystem services: A comparative analysis on observed data and people’s perception in Inle Lake, Myanmar. Environmental Systems Research, 7(1), 25. https://doi.org/10.1186/s40068-018-0128-7
- Keshtkar, H., & Voigt, W. (2016). A spatiotemporal analysis of landscape change using an integrated Markov chain and cellular automata models. Modeling Earth Systems and Environment, 2(1), 1–13. https://doi.org/10.1007/s40808-015-0068-4
- Kolb, M., Mas, J.-F., & Galicia, L. (2013). Evaluating drivers of land-use change and transition potential models in a complex landscape in Southern Mexico. International Journal of Geographical Information Science, 27(9), 1804–1827. https://doi.org/10.1080/13658816.2013.770517
- Kumar, N., Singh, S. K., Singh, V. G., & Dzwairo, B. (2018). Investigation of impacts of land use/land cover change on water availability of Tons River Basin, Madhya Pradesh, India. Modeling Earth Systems and Environment, 4(1), 295–310. https://doi.org/10.1007/s40808-018-0425-1
- Kuule, D. A., Ssentongo, B., Magaya, P. J., Mwesigwa, G. Y., Okurut, I. T., Nyombi, K., Egeru, A., & Tabuti, J. R. S. (2022). Land use and land cover change dynamics and perceived drivers in Rangeland areas in central Uganda. Land, 11(9), 1402. https://doi.org/10.3390/land11091402
- Leta, M. K., Demissie, T. A., & Tränckner, J. (2021). Modeling and prediction of land use land cover change dynamics based on land change modeler (LCM) in nashe watershed, upper blue Nile Basin, Ethiopia. Sustainability, 13(7), 3740. https://doi.org/10.3390/su13073740
- Liu, J., Kuang, W., Zhang, Z., Xu, X., Qin, Y., Ning, J., Zhou, W., Zhang, S., Li, R., & Yan, C. (2014). Spatiotemporal characteristics, patterns, and causes of land-use changes in China since the late 1980s. Journal of Geographical Sciences, 24(2), 195–210. https://doi.org/10.1007/s11442-014-1082-6
- Mathur, A., & Foody, G. M. (2008). Multiclass and Binary SVM Classification: Implications for Training and Classification Users. Geoscience and Remote Sensing Letters, IEEE, 5(2), 241–245. https://doi.org/10.1109/LGRS.2008.915597
- Mohammed, M., Habtamu, T., & Yared, M. (2017). Land use/cover change analysis and local community perception towards land cover change in the lowland of Bale rangelands, Southeast Ethiopia. International Journal of Biodiversity and Conservation, 9(12), 363–372. https://doi.org/10.5897/ijbc2017.1131
- Nedd, R., Light, K., Owens, M., James, N., Johnson, E., & Anandhi, A. (2021). A synthesis of land use/land cover studies: Definitions, classification systems, meta-studies, challenges and knowledge gaps on a global landscape. Land, 10(9), 33. https://doi.org/10.3390/land10090994
- Nouri, A., Raman, B., Bozga, M., Legay, A., & Bensalem, S. (2014). Faster statistical model checking by means of abstraction and learning. International conference on runtime verification, 340–355. https://hal.inria.fr/ha-01087676
- Obayelu, A. E. (2014). Assessment of Land Use Dynamics and the Status of Biodiversity Exploitation and Preservation in Nigeria. https://digitalcommons.unl.edu/jade/7
- Onilude, O. O., & Vaz, E. (2020). Data analysis of land use change and urban and rural impacts in Lagos state, Nigeria. Data, 5(3), 1–19. https://doi.org/10.3390/data5030072
- Permatasari, R. J., Damayanti, A., Indra, T. L., & Dimyati, M. (2021). Prediction of land cover changes in Penajam Paser Utara Regency using cellular automata and Markov model. {IOP} Conference Series: Earth and Environmental Science, 623(1), 12005. https://doi.org/10.1088/1755-1315/623/1/012005
- Shapero, M., Siegel, K., Gallo, J. A., Brice, J., & Butsic, V. (2022). Land cover conversion and land use change combine to reduce grazing. Journal of Land Use Science, 17(1), 339–350. https://doi.org/10.1080/1747423X.2022.2086311
- Shittu, W. J., Galtima, M., & Yakubu, D. (2016). The application of geospatial analytical techniques in the assessment of land use conflicts among farmers and cross-boundary nomadic cattle herders in the Gombe Region, Nigeria. Journal of Global Initiatives: Policy, Pedagogy, Perspective, 10. http://digitalcommons.kennesaw.edu/jgi/vol10/iss2/9
- Ujoh, F. (2014). Population growth and land resource Conflicts in Tivland, Nigeria. Resources and Environment, 4(1), 67–78. https://doi.org/10.5923/j.re.20140401.08
- Usman, M., & Nichol, J. E. (2022). Changes in agricultural and grazing land, and insights for mitigating farmer-herder conflict in West Africa. Landscape and Urban Planning, 222, 104383. https://doi.org/10.1016/j.landurbplan.2022.104383
- Wentz, E. A., Anderson, S., Fragkias, M., Netzband, M., Mesev, V., Myint, S. W., Quattrochi, D., Rahman, A., & Seto, K. C. (2014). Supporting global environmental change research: A review of trends and knowledge gaps in urban remote sensing. Remote Sensing, 6(5), 3879–3905. https://doi.org/10.3390/rs6053879
- Woldai, T. (2020). The status of Earth Observation (EO) \& Geo-Information Sciences in Africa – Trends and challenges. Geo-Spatial Information Science, 23(1), 107–123. https://doi.org/10.1080/10095020.2020.1730711
- World Economic Forum. (2015). Q&A: Bringing Space Down to Earth. Physics, 8(March. https://doi.org/10.1103/physics.8.115
- Wright, I., Ericksen, P., Mude, A., Robinson, L. W., & Sircely, J. (2015). Importance of livestock production from grasslands for national and local food and nutritional security in developing countries. International Grasslands Congress. https://cgspace.cgiar.org/handle/10568/69389
- Yang, W., Tao, J., & Ye, Z. (2016). Continuous sign language recognition using level building based on fast hidden Markov model. Pattern Recognition Letters, 78, 28–35. https://doi.org/10.1016/j.patrec.2016.03.030
- Ye, B., & Bai, Z. (2007). Simulating land use/cover changes of Nenjiang County based on CA-Markov model. International conference on computer and computing technologies in agriculture, 321–329. doi:10.1007/978-0-387-77251-6_35.