
ABSTRACT
The study presents a GIS-based morphometric analysis characterizing the watersheds in Bohol, Philippines. An IfSAR-derived DEM data were processed and used to delineate the watersheds and evaluate morphometric parameters in QGIS/QSWAT. The analysis revealed that Loboc Watershed (LW) and Wahig-Inabanga Watershed (WIW) were sixth-order watersheds. Covering 675 km2 (LW) and 610 km2 (WIW), the watersheds encompassed about 34% of the mainland area. The bifurcation ratios, 3.91 (WIW) and 4.06 (LW), suggested highly dissected watersheds with high flood peaks. LW has low permeability, and high runoff and erosion susceptibility compared to WIW, as indicated by higher values for the form factor, circulatory ratio, drainage density, and stream frequency. The ruggedness numbers of 1.653 (WIW) and 1.457 (LW) indicated steep slopes in WIW than in LW, associated with high erosion and environmental degradation. The hypsometric integral of 0.22 (WIW) and 0.37 (LW) implied lesser erosional areas in WIW than in LW. The study found that both watersheds were highly susceptible to erosional processes. The two watersheds performed critical environmental functions on Bohol Island; hence, the results of this study present a piece of baseline information for resource managers to conduct further investigations that would identify hotspot areas and enable targeted soil and water conservation initiatives.
I. Introduction
Philippine watersheds provide environmental services to downstream communities (Francisco & Rola, Citation2004) by supplying water for crop production, domestic use, hydroelectric power generation, or a mix of these. However, adversities also occur in watersheds in response to climate extremes and tectonic activities. These natural responses of a hydrologically defined landform are described and better understood by analyzing surface features in the study of watershed morphology (Beven et al., Citation1988; Kabite & Gessesse, Citation2018; Zavoianu, Citation1985).
Watershed morphometric analysis is crucial in providing insights into the connections between landform dynamics and the hydrologic responses within the unit. A watershed’s morphologic feature is a function of its topography and the form and extent of its stream system or drainage network (Horton, Citation2004). A morphometric analysis measures the mathematical properties of watersheds and stream networks, including the landform’s length, surface area, size, and slope. These parameters are significant determinants of water dynamics within watersheds which can give valuable knowledge for land and water resource management in regions with limited hydrological data (Meshram & Sharma, Citation2020). Horton’s efforts were crucial in developing the analytical method for assessing the watershed’s morphological characteristics (Strahler, Citation1957).
Flood forecasting and hazard studies (Alam et al., Citation2021; Charizopoulos et al., Citation2019; Taha et al., Citation2017) are a few of the applications of watershed morphometric analyses. Within a geographic information system (GIS) platform, spatial datasets such as the digital elevation model (DEM) are the primary input for delineating watersheds and extracting morphometric parameters. Flood zoning studies in southeastern Bangladesh (Alam et al., Citation2021) and in the Wadi Qena basin, Eastern Desert of Egypt (Taha et al., Citation2017), integrated morphometric analysis. Alam et al. combined the morphometric parameters of a watershed with local topographic effects, such as the topographic wetness index and the topographic position index, to map flash flood susceptibility areas. In a similar study by Taha et al. (Citation2017), high flood hazard catchments have low bifurcation ratio, high stream frequency, and high drainage density values. Flood hazards were investigated and linked with tectonic faulting on Samos Island in Greece (Charizopoulos et al., Citation2019). The study by Charizopoulos et al. (Citation2019) observed that where fault orientation and flow directions differ, tectonics had little effect on the evolution of the drainage systems. Despite data constraints to carry out detailed flood assessment, morphometric analysis in flood hazard studies produced valuable information to comprehend watershed flood hydrology better for developing mitigation strategies in the study areas.
Morphometric parameters are proxies of the erodibility status of a watershed. Several studies demonstrate the application of morphometric analysis to identify and prioritize areas for land and water conservation initiatives and other natural resources management efforts (Benzougagh et al., Citation2022; Bharath et al., Citation2021; Fenta et al., Citation2017; Puno & Puno, Citation2019). Watershed morphometric parameters, derived and analyzed using a digital elevation model in a GIS environment, were grouped into linear, aerial, and relief aspects. The linear and relief parameters directly relate to erodibility, while the aerial parameters indirectly associate erodibility (Nookaratnam et al., Citation2005). The ranking of parameter values, classification and prioritization of watersheds and sub-watersheds, as presented in Nookaratnam et al. (Citation2005), is commonly adopted in several studies. Other methods, such as hierarchical cluster analysis and principal component analysis, were presented in the study of Kulimushi et al. (Citation2021). The hierarchical cluster analysis grouped the watersheds and sub-watersheds based on morphometric characteristics. The principal component analysis reduced the number of morphometric parameters by identifying several factors that explain most of the variance observed in the parameters considered. Puno and Puno (Citation2019) included landuse/landcover information to arrive at compound values in the final prioritization of areas. In the studies mentioned, morphometric analysis in erosion assessment across watersheds enables the development of maps showing spatial erosion variability and priority areas. These maps serve as a basis for improved planning, management, and decision-making to ensure the sustainable use of watershed resources.
Morphometric analysis studies also helped comprehend the evolution of river basins in response to climatic and tectonic activities (Mahadev et al., Citation1947; Singh et al., Citation2021). A study by Mahadev et al. (Citation1947) combined morphometric analysis with OSL dating of sediments collected from rivers to help understand climatic and tectonic activities with the evolution of watersheds and drainage systems. Morphometric analysis and luminescence chronology established channel shift time frames in response to tectonic activity (Mahadev et al., Citation1947). The study of Singh et al. (Citation2021) quantified various aspects of a river basin employing a morphometric analysis.
As demonstrated in the cited studies, the morphometric analysis provided a rapid but scientific way of assessing watershed flood hazards and erodibility status and the connections between tectonics and climate factors. Several studies have shown that with GIS’s advanced capability and spatial datasets’ availability, watershed characterization using morphometric analysis produced datasets critical for decision-makers and resource managers. Hence, in the present study, a morphometric analysis is carried out to assess the watersheds of Bohol Island in the central Philippines, where such an approach has not been applied. This study is limited to using a digital elevation model to extract watershed morphometric parameters and decipher surface processes as initial steps to watershed characterization activities. The information generated will contribute to a better understanding of watershed hydrology in support of sustainable resource management efforts in the study area.
II. Materials and methods
Description of the study area
depicts the Visayas region of the Philippine archipelago, where Bohol Island is located (A). Bohol is the tenth-largest island in the country, covering about 4,110 km2, where 66% of the area is devoted to agriculture-related activities (PPDO, Citation2006). The overall land area has an existing forest cover that accounts for 24.6% of the total.
Figure 1. The geographic location of the study area. A) The major watersheds, drainage networks, and fault lines overlay on an elevation map. B) The mouth of Loboc Watershed. C) The midstream agricultural area of Wahig – Inabanga Watershed.
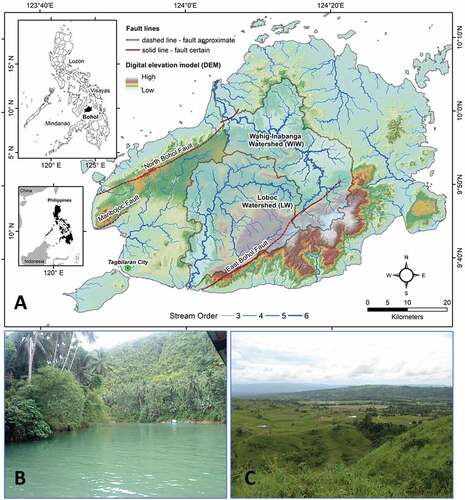
The island lies on several Cretaceous oceanic lithosphere formed and deposited in various geological settings and patterns (Dimalanta et al., Citation2006). The geology of Bohol island (JICA, Citation1985) is composed of volcanic rock in the eastern and western parts and a sizable area of sedimentary rock in the middle of the island known as the Ilihan formation. The formation is a relatively broad sequence of well-bedded sandstone, shale, and mudstone/siltstone. These units often consist of volcanic buildup formed by weathering nearby country rocks. About 30% of the province’s rocks are intrusive and extrusive igneous rocks, particularly in the island’s northeastern region. Uplifted reef limestone facies of significant height surrounded the perimeter of mainland Bohol. On the island, sedimentary rocks make up roughly 70% of the terrain.
The island has two major drainage networks: the Loboc Watershed (LW) and the Wahig-Inabanga Watershed (WIW). The significant economic activities in these watersheds, primarily tourism and agriculture, highlight the importance of studying landform dynamics concerning resource conservation and sustainable use. LW hosts the Loboc River (), where the cruise is a tourist attraction. At the same time, WIW supports crop production activity in the island province (). LW and WIW, encompassing 675 km2 and 610 km2, respectively, cover about 34% of the mainland area. The two drainage systems, with contrasting geometry, drain the island in different directions, as shown in .
Water resources in LW are indispensable to tourism and energy production. In WIW, the resource is vital to irrigation for agriculture. However, natural catastrophes such as flooding, erosion, and drought are commonplace. These are significant concerns to the local government units and the people. Typhoons and other weather disturbances frequently visit the country, with an average of 20 storms per year. Generally, according to the modified Coronas classification, the island’s climate is under Type IV, characterized as having rainfall more or less evenly distributed over the whole year. The mean annual rainfall from 2000 to 2012 is approximately 1653 mm, as recorded in the provincial capital of Tagbilaran City. The average monthly precipitation records show that April and December are the driest and wettest months, with 78 mm and 185 mm of precipitation, respectively. The island’s temperature ranged between 24°C and 32°C, while the relative humidity averaged 83%.
Bohol is a tectonically active island. shows two prominent fault lines running through the province, the East Bohol Fault and the newly discovered North Bohol Fault (Kobayashi, Citation2014). The faults’ presence raises the risk of tectonic hazards such as earthquakes and earthquake-induced hazards (e.g., tsunamis and landslides). A combined tectonic movement and eventual land erosion shaped the island in the last 150 million years. Although these features provide vital information in the watershed characterization process, the current study is limited to topographic analysis using a digital elevation model as a preliminary step.
Data sources and processing
The morphometric analysis reported in this study uses an IfSAR-derived digital elevation model (DEM) from the National Mapping and Resource Information Authority (NAMRIA), the mapping agency of the Philippines. The DEM has a spatial resolution of 5 m with 1.0-m root-mean-square error vertical accuracy and a 0.625-meter resolution ORI (orthorectified radar image) at 2.0-m horizontal accuracy (NAMRIA, Citation2021, page 12). The study also adopts the watershed delineation process of the QSWAT model to extract the drainage network, the watersheds, and the geometric attributes. shows the process flow of the analysis.
Figure 2. The process flow of morphometric analysis in Bohol watersheds.
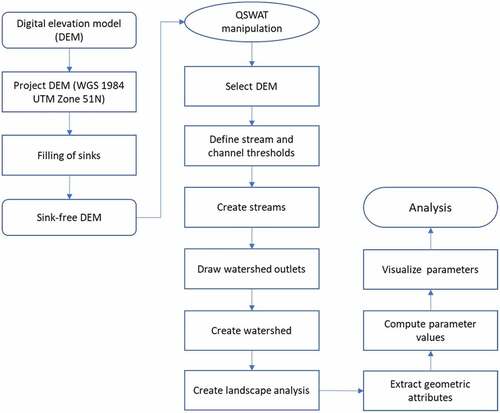
The DEM preprocessing consists of projecting the data to a local projection system and filling the sinks to remove spurious areas to produce sink-free elevation data. Watershed delineation uses the QSWAT software (https://swat.tamu.edu/software/qswat) and follows the process presented in the QSWAT User manual available on the SWAT website. Briefly, watershed delineation involves defining a threshold area to create streams and channels. Once the channels and streams are defined, QSWAT delineates the watershed boundaries using user-identified outlet points or drainage locations. The delineation process also includes assigning a stream order to channel and stream, calculating the stream and watershed geometry, and landscape analysis. A text file output stores the attributes calculated in the landscape analysis. Following the equations in , the morphometric analysis proceeds using a spreadsheet and visualization in QGIS software.
Table 1. List of morphometric parameters used in the study, equations, and the source of information.
Evaluation of morphometric parameters
The morphometric parameters, grouped into linear, areal, and relief aspects (Asfaw & Workineh, Citation2021; Bharath et al., Citation2021), are given in with the corresponding equations to quantify the values. These parameters directly or indirectly affect runoff characteristics and erosion processes, so they can be used to characterize watersheds.
III. Results and discussion
Linear aspects of LW and WIW
A watershed’s linear aspects comprise the streams and the stream network and are typically one-dimensional quantities (Asfaw & Workineh, Citation2021). lists the linear parameter values of the study watersheds.
Table 2. Stream network characteristics and the linear aspects of LW and WIW.
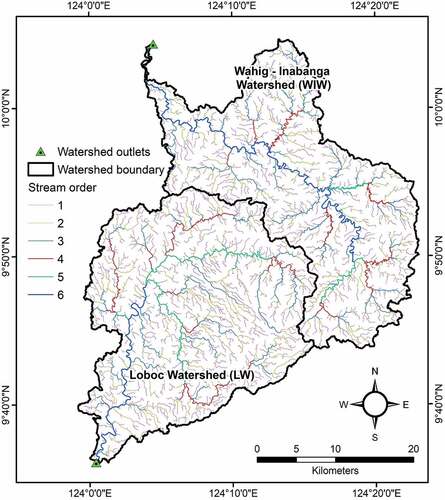
The stream order (U) is a metric used to describe the position of a stream within its tributary hierarchy. According to Horton (Citation1932), U is a quantitative basis for comparing the degree of development of the drainage networks of watersheds of similar size. Strahler’s (Citation1957) stream ordering scheme applied in the study assigns an order to the streams in this way: The first orders are the smallest finger type and non-branched tributaries; the second orders streams formed when two first stream orders meet; the third orders formed when the second orders meet, and so on. The analysis found the two watersheds as sixth order and generally of dendritic patterns, as shown in . A drainage network with a dendritic pattern suggests textural homogeneity and a lack of structural control (Christopher et al., Citation2010).
Figure 3. Drainage network organization and the stream orders in the watersheds under study.
The stream number (Nu) refers to each order’s total count of stream segments, providing information on surface runoff characteristics. According to Horton (Citation1932), Nu of a given stream order U forms an inverse geometric series: Nu decreases with increasing U. The analysis reveals that LW has 12% more first-order streams than WIW. Further, LW has about 20% more streams on the total count of streams than WIW, implying a better drainage system but higher chances of erosion and a lower potential for groundwater recharge. As Saha et al. (Citation2022) noted, a watershed with numerous first-order streams has a high probability of flash floods during heavy rainfall than a watershed with fewer first-order streams.
When other factors are held constant, the time required for the water to flow a given distance is directly proportional to the stream length (Langbein, Citation1947). Stream length (Lu) refers to the mean stream length in a given stream order U. As noted in , Lu increases as U increases which means that the Lu of the first-order stream is lower than the Lu of the next higher-order stream. Also noted is the considerably more extended length of the sixth-order stream in WIW, which is more than twice the length of LW’s sixth order stream. Watersheds with longer stream lengths tend to be flatter, while watersheds with short stream lengths are steeper (Christopher et al., Citation2010; Kabite & Gessesse, Citation2018). also revealed that stream orders 2, 3, 4, and 6 of LW are shorter than the length of the same stream orders of WIW, suggesting steeper and faster runoff in LW. Longer stream lengths tend to have higher chances of infiltration and slower runoff velocity, thus reducing surface erosion. The sum of all stream lengths (LT) in a given order is inversely proportional to U: LT decreases with increasing U. Asfaw and Workineh (Citation2021) observed the same pattern in their empirical study.
The stream-length ratio (Rl,u) is the ratio of the mean stream length of a given stream order (Lu) to the mean stream length of the next lower stream order (Lu-1; Horton, Citation1932). The mean stream-length ratio (Rl,m) is a watershed’s average Rl,u.Rl,u changes with U, as shown in , where such change, according to Mahala (Citation2020), is related to geomorphic development stages and the irregularity of hydrological behaviour. The Rl,m of LW is lower than the Rl,m of WIW, suggesting that LW is at an earlier stage of geomorphic development than WIW, as implied in the study of Mahala (Citation2020).
Table 3. Results of the areal aspect analysis in LW and WIW.
Horton’s bifurcation ratio (Rb) is the ratio of the stream number of any order to the stream number of the next higher order (Strahler, Citation1957). In Horton’s (Citation1932) study, Rb values range from about 2 for flat or rolling and 3–4 for mountainous or highly dissected drainage basins. Hence, Rb is higher for hilly and well-dissected watersheds than for rolling watersheds. Further, Fitzpatrick (Citation2017) indicated that Rb values falling between 2 and 4 indicate runoff peakedness. Low ratios are associated with flashy hydrographs with high flood peaks for small watersheds (Fitzpatrick, Citation2017). From the Rb values in , both LW and WIW can be described as highly dissected and mountainous and could potentially experience high flood peaks. Within the Rb values of 3.0 to 5.0, according to Strahler (Citation1957), the geological structures of LW and WIW cannot be associated with stream pattern development.
Watershed length (Lb) is the dimension that runs parallel to the primary drainage channel. The maximum watershed length is close to twice the diameter of a circle having the same area as the watershed for circular-shaped catchments (Schumm, Citation1956). Lb reveals the watershed’s main channel, which carries most water, and is commonly used to compute the time element of water flow over a watershed. Longer Lb indicates more time for surface water to reach the mouth of the watershed. Using GIS, this study measures the watershed length as the distance between the mouth and the most distant point in the watershed. Using this approach, the length of WIW is 8.4 km longer than LW. Hence, runoff water from WIW would travel longer than the runoff in LW.
The mainstream length (LM) is the longest flow path in the watershed. The analysis revealed that WIW longest flow path is about thrice of the LM of LW. One of the consequences of a longer runoff distance is the high tendency of runoff to infiltrate the ground, recharging groundwater sources because of the longer travel time.
Areal aspects of the LW and WIW
The areal aspects or shape indices of watersheds, given in , are associated with drainage characteristics and hydrological properties. The watershed area (A) is the upslope area that contributes flow to an identified reference point. In the study, the reference point refers to the outlets or mouths of the watersheds. A watershed’s area directly reflects the water volume that will flow or pass through a reference point. According to Langbein (Citation1947), the discharge volume in a humid climate varies directly with the size of the tributary drainage area. As depicted in , LW has about 10% more watershed area than WIW, indicating more runoff from LW.
A watershed’s perimeter (P) refers to the outer boundary’s total length. P indirectly influences the drainage texture, relative relief, and circulatory ratio and directly affects the compactness coefficient. As P increases with increasing catchment area, the geometry of the enclosed area dictates its magnitude. As shown in , LW’s area is 10% bigger than that of the WIW, but its perimeter is about 24% shorter than that of the WIW.
The form factor, elongation ratio, and circulatory ratio are indicators of watershed shape, volume, and the duration of runoff. The form factor (Rf; Horton, Citation2004) is the ratio of the watershed area divided by the square of the length. Rf explains a watershed’s flow property (Bogale, Citation2021) as affected by shape. In , the Ff values of the watersheds suggest the elongated shape of WIW and the round shape of LW. Low Ff values reflect an elongated shape, while high Ff values indicate rounded-shaped watersheds. High values of Ff are associated with increased runoff and short-time concentration and are highly sensitive to flooding (Bogale, Citation2021). The elongation ratio (Re) is the ratio of the diameter of a circle having the same area as the watershed to the watershed length, which varies from 0.6 to 1.0 (Fitzpatrick, Citation2017). Re values between 0.6 and 0.8 are associated with high relief and steep ground slopes (Schumm, Citation1956). Re value closer to 0.6 is a character of an elongated basin with slower runoff and less flashy floods, while a ratio of 1.0 is a round watershed (Fitzpatrick, Citation2017). shows similar Re values of the two watersheds, which indicate similar behaviour. The circulatory ratio (Rc) is the ratio of the watershed area to the area of the circle having the same circumference as the perimeter of the watershed (Miller, 1953). Rc for elongated watersheds approaches zero, while Rc for circular watersheds approaches 1. Rc values also indicate the shape of a watershed where a circular to oval shape allows quick disposal of runoff resulting in a high-peaked and narrow hydrograph. In contrast, the elongated shape allows slow water removal, resulting in a broad and low-peaked hydrograph (Pandey et al., Citation2005). The circular shape of LW with Rc of 0.315 suggests quick and high-peak runoff, which encourages soil erosion, while an elongated shape WIW (Rc = 0.186) implies slow and low peaked runoff and less erosion.
Horton (Citation1932) defines drainage density (Dd) as the total length of channels per unit watershed area. Dd reflects channel development, according to Langbein (Citation1947) and indicates the physical-environmental conditions that favour erosion in the watershed, as suggested by Rodrigues et al. (Citation2019). A low drainage density watershed sits on surfaces highly resistant to erosion or has a highly permeable substratum (Strahler, Citation1952), forming a relief with gentle slopes covered by dense vegetation (Zavoianu, Citation1985). Dd implies runoff characteristics (Fitzpatrick, Citation2017), whereby a dense stream network watershed will have flashy high peak flows (Horton, Citation1932). Drainage density seldom exceeds 3.0 and is commonly 1.0 to 2.0 in humid regions where soil erosion is active (Horton, Citation1932). Results of the analysis show that the Dd of the two watersheds is close, about 2 km per square kilometre of the watershed area, indicating that the runoff characteristics do not differ across the two catchments.
The drainage texture (Dt) represents the total number of streams per unit perimeter of a watershed (Horton, Citation1932) and reflects the topography’s fundamental lithology, infiltration potential, and relief (Rai et al., Citation2018). Smith (Citation1950) classified Dt into coarse (≤4), moderate (4–10), and fine (>10). The drainage textures of LW and WIW fall between 5 and 8, described as moderately textured drainage, which, according to Fenta et al. (Citation2017), is associated with the dominance of low permeability soft rock with low erosion resistance.
The stream frequency (Fs) is the total number of streams in a watershed divided by area. Fs may not be comparable for watersheds of different sizes (Horton, Citation1932). However, the study results show that the Fs of the two watersheds are almost the same at about two streams per square kilometre watershed area.
The compactness coefficient (Cc) represents the ratio of the actual basin perimeter to the perimeter of a circle of equal area (Horton, Citation1932). Cc equals unity when the watershed shape is a perfect circle, increases to 1.128 in the case of a square, and may exceed 3 for a very elongated basin (Zavoianu, Citation1985). Cc does not depend on watershed size but is highly slope-dependent (Pareta & Pareta, Citation2011; Verma et al., Citation2022). shows that Cc of WIW is higher than that of LW, which suggests that WIW is more elongated than LW.
Relief aspects of LW and WIW
Relief analysis is critical for developing a thorough understanding of the spatial organization of landforms. shows the result of the relief aspect analysis in the study watersheds. The relief aspects are related to the elevation differences between reference points in a watershed.
Table 4. Relief aspect analysis and the computed values in LW and WIW.
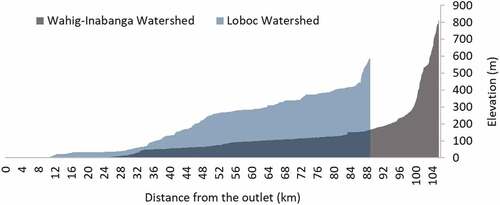
LW and WIW drain into the sea on opposite sides of the island (see, ), and their minimum elevations (Emin) are at zero. The island’s highest point (Emax) is inside WIW, but WIW’s mean elevation (Emean) is 76 m lower than LW. As shown in , the river profiles of the two watersheds revealed that a large portion of the LW lies between 100 and 400 m in elevation. The elevation values are critical in the hypsometric analysis, which examines a catchment’s geological development stages.
Figure 4. Elevation profile of the LW and WIW main rivers from the headwaters to their outlets. The main trunk’s length and peak elevations are 89 km and 732 m, and 105 km and 869 m for LW and WIW, respectively.
A watershed’s total relief (R) is the elevation difference between the highest and lowest points. High R is associated with high erosion susceptibility. R has an essential role in landform development, drainage development, surface and subsurface water flow, permeability, and erosional properties of the terrain (Magesh et al., Citation2011). Between the two watersheds, the WIW has a higher R than LW, which indicates that WIW has a higher potential for erosion.
The relief ratio (Rr; Schumm, Citation1956) is the elevation difference per unit of watershed length expressed in m/km. Compared to R, the parameter Rr provides a better representation of the relief aspects of a watershed. One practical application of Rr is estimating sediment loss (Schumm, Citation1956). A higher relief ratio is associated with increased susceptibility to erosion. WIW is more prone to erosion between the two watersheds because of its higher Rr than LW.
The relative relief (Rhp) is the watershed’s total relief per unit perimeter (Schumm, Citation1956). Across the two study watersheds, Rhp shows identical values. Similar to other relief aspects, Rhp is also directly affecting erosion susceptibility. With this metric, the two watersheds are on an equivalent level of erosion susceptibility.
The ruggedness number (Rn) is the product of the watershed’s drainage density and relief. Rn represents the intricacy of the landform structure and the average slope steepness along its length. In the study of Guidolini et al. (Citation2020), Rn stands as an environmental parameter that directs potential land use regarding soil capability, where higher Rn values connote higher erosion and environmental degradation. Rodrigues et al. (Citation2019) suggested that areas with high Rn are for forest use because of steep slopes and dense drainage networks, whereas areas with low Rn are appropriate for natural cropland use. shows that WIW has a higher Rn value than LW, associating WIW with a higher erosion potential than LW.
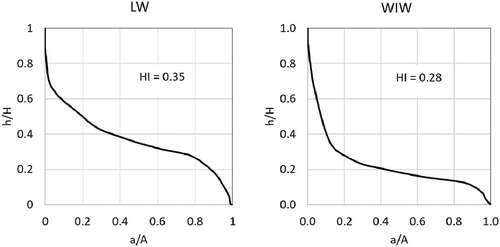
shows the study watershed’s hypsometric curve and hypsometric integral (HI). The HI values indicated that only 35% and 28% of the total landmass remained after erosion for LW and WIW, respectively. Both watersheds are considered geologically matured landscapes. However, WIW is at an advanced maturity stage because of a lower HI than LW. A previous study on the island landscape revealed a spatial variation of HI ranging from 0.1 to 0.6, indicating young to mature geologic development stages (Torrefranca et al., Citation2022a).
Figure 5. Hypsometric curve and hypsometric integral (HI) of the watersheds under study.
Implications for soil and water conservation
LW and WIW watersheds offer a range of environmental services, such as the provision of water flow for several economic activities. However, these watersheds are threatened by severe resource degradation, as soil erosion is a serious environmental problem in many Philippines watersheds (Puno & Puno, Citation2019) due to changing climatic conditions, tectonic settings, and anthropogenic factors. For example, erosion studies in the upper WIW found that areas cultivated for crop production generated a high soil loss of 42.5 t/ha-yr compared to forested and grassland areas with only 0.2 t/ha-yr and 6.4 t/ha-yr, respectively (Genson, Citation2006). Further, the study also found that high rainfall intensities resulted in high sediment concentrations in monitored rivers.
Land and water resources in the island landscape are also exposed to tectonic activities owing to geographic location. In 2013, a 7.2 magnitude earthquake hit the island and caused landslides that spoiled agricultural areas, cut transportation networks, and blocked irrigation infrastructures, to name a few. Landslides are commonplace on the island, so resource use must consider the long-term impact of landform evolution. One study on the landscape incorporated landform dynamics in identifying potential small-scale hydropower sites (Torrefranca et al., Citation2022b). Although the study was an initial table assessment, it incorporated proxies of tectonic activity and showed the spatial distribution and the geohazards associated with each potential hydropower site. The information provided insights to data-limited resource managers and energy planners in targeting possible locations and minimizing field investigation costs and time.
Soil and water resource degradation in the watershed are critical issues. Identifying a watershed’s erosion vulnerability status is a precondition for taking appropriate and relevant actions to tackle the situation (Asfaw & Workineh, Citation2021). However, the lack of hydrology-related datasets and field observations to proceed with watershed characterization is another constraint to hurdle in the watersheds. As a result, many studies employ morphometric analysis as a rapid approach to characterize hydrologic responses of watersheds using topographic data and GIS (Benzougagh et al., Citation2022; Negese et al., Citation2021; Puno & Puno, Citation2019) to proceed with planning for soil and water conservation actions.
Results of the morphometric analysis indicated that both LW and WIW were susceptible to erosion. Hence, there is a need for a more thorough evaluation and assessment of watersheds to better understand resource degradation. As noted in many studies, it is advantageous to disaggregate a large watershed into smaller and manageable units in identifying and prioritizing areas of urgent concern (Benzougagh et al., Citation2022; Najia et al., (Citation2018).; Negese et al., Citation2021; Puno & Puno, Citation2019).
IV. Conclusion
The morphometric analysis conducted in LW and WIW characterizes the watersheds in terms of their susceptibility to erosion using a digital elevation dataset and GIS. It links the watershed’s linear, areal, and relief aspects to hydrologic responses and surface erosional processes. The study made the following conclusions:
The linear aspects indicated that LW and WIW are sixth-order watersheds dominated by lower-order streams. The bifurcation ratio of around 4 for both watersheds suggested highly dissected landscapes with a high potential for flood peaks.
LW’s areal aspects, such as form factor, circulatory ratio, and drainage texture, implied that its nearly circular shape is associated with runoff’s short concentration time and quick disposal, which encourages flash flooding and erosion.
The greater relief characteristics of WIW suggested steep slopes in the watershed, implying increased soil loss generation compared to LW.
Both watersheds are susceptible to erosion.
The study recommends further investigations on the two watersheds to identify erosion hotspot areas and enable targeted conservation programs and initiatives. Future studies should disaggregate the watersheds into smaller and more manageable units to identify and prioritize areas for conservation and protection initiatives.
Acknowledgments
The main author is grateful for the Graduate Scholarship Grant from DOST-ERDT at the School of Engineering at the University of San Carlos – TC, Cebu City, and the Bohol Island State University – Bilar Campus support.
Disclosure statement
No potential conflict of interest was reported by the authors.
Additional information
Funding
References
- Alam, A., Ahmed, B., & Sammonds, P. (2021). Flash flood susceptibility assessment using the parameters of drainage basin morphometry in SE Bangaladesh. Quaternary International, 575-576, 295–307. https://doi.org/10.1016/j.quaint.2020.04.047
- Asfaw, D., & Workineh, G. (2019). Quantitative analysis of morphometry on Ribb and Gumara watersheds: Implications for soil and water conservation. International Soil and Water Conservation Research, 7(2), 150–157. https://doi.org/10.1016/j.iswcr.2019.02.003
- Benzougagh, B., Meshram, S. G., Dridri, A., Boudad, L., Baamar, B., Sadkaoui, D., & Khedher, K. M. (2022). Identification of critical watersheds at risk of soil erosion using morphometric and geographic information system analysis. Applied Water Science, 12(1). https://doi.org/10.1007/s13201-021-01532-z
- Beven, K. J., Wood, E. F., & Sivapalan, M. (1988). On hydrological heterogeneity - catchment morphology and catchment response. Journal of Hydrology, 100(1–3), 353–375. https://doi.org/10.1016/0022-1694(88)90192-8
- Bharath, A., Kumar, K. K., Maddamsetty, R., Manjunatha, M., Tangadagi, R. B., & Preethi, S. (2021). Drainage morphometry based sub-watershed prioritization of Kalinadi basin using geospatial technology. Environmental Challenges, 5(100277), 1–15. https://doi.org/10.1016/j.envc.2021.100277
- Bogale, A. (2021). Morphometric analysis of a drainage basin using geographical information system in Gilgel Abay watershed, Lake Tana Basin, upper Blue Nile Basin, Ethiopia. Applied Water Science, 11(7), 1–7. https://doi.org/10.1007/s13201-021-01447-9
- Charizopoulos, N., Mourtzios, P., Psilovikos, A., & Karamoutsou, L. (2019). Morphometric analysis of the drainage network of Samos Island (northern Aegean Sea): Insights into tectonic control and flood hazards. Comptes Rendus - Geoscience, 351(5), 375–383. https://doi.org/10.1016/j.crte.2019.03.001
- Christopher, O., Idowu, A. O., & Olugbenga, A. S. (2010). Hydrological analysis of Onitsha North East drainage basin using geoinformatic techniques. World Applied Science Journal, 11(10), 1297–1302. http://www.idosi.org/wasj/wasj11(10)/15.pdf
- Dimalanta, C. B., Suerte, L. O., Yumul, G. P., Tamayo, & R. A., Ramos, E. G. L. (2006). A Cretaceous supra-subduction oceanic basin source for Central Philippine ophiolitic basement complexes: Geological and geophysical constraints. Geosciences Journal, 10(3), 305–320. https://doi.org/10.1007/BF02910372
- Fenta, A. A., Yasuda, H., Shimizu, K., Haregeweyn, N., & Woldearegay, K. (2017). Quantitative analysis and implications of drainage morphometry of the Agula watershed in the semi-arid northern Ethiopia. Applied Water Science, 7(7), 3825–3840. https://doi.org/10.1007/s13201-017-0534-4
- Francisco, H. A, & Rola, A. C.(2004). Realities of watershed management in the Philippines: Synthesis of cases studies. PIDS Discussion Paper Series, No. 2004-24, 19. https://www.pids.gov.ph/publication/discussion-papers/
- Genson, I. C. (2006). Erosion and water resources assessment in the Upper Inabanga Watershed , Philippines : Application of WEPP and GIS tools. Western Sydney University. https://researchdirect.westernsydney.edu.au/islandora/object/uws:2440/datastream/PDF/view
- Guidolini, J., Ometto, J., Arcoverde, G., & Giarolla, A.(2020). Environmental land use conflicts in a macroscale river basin: A preliminary study based on the ruggedness number. Water (Switzerland),12(5),1–13. https://doi.org/10.3390/W12051222
- Horton, R. E. (1932). Drainage‐basin characteristics. Transactions American Geophysical Union,13(1), 350–361. https://doi.org/10.1029/TR013i001p00350
- Horton, R. E. (1945). Erosion development of streams and their drainage basins: Hydrophysical approach to quantitative morphology. Geological Society of America Bulletin, 56(1), 275–370. https://doi.org/10.1130/0016-7606(1945)56
- JICA. (1985). Feasibility study on Bohol irrigation development project (Phase II). https://openjicareport.jica.go.jp/pdf/10305472_03.pdf
- Kabite, G., & Gessesse, B. (2018). Hydro-geomorphological characterization of Dhidhessa River Basin, Ethiopia. International Soil and Water Conservation Research, 6(2), 175–183. https://doi.org/10.1016/j.iswcr.2018.02.003
- Kobayashi, T.(2014). Remarkable ground uplift and reverse fault ruptures for the 2013 Bohol earthquake (Mw 7.1), Philippines, revealed by SAR pixel offset analysis.Geoscience Letters,1(1),1–10. https://doi.org/10.1186/2196-4092-1-7
- Kulimushi, L. C., Choudhari, P., Maniragaba, A., Elbeltagi, A., Mugabowindekwe, M., Rwanyiziri, G., Byizigiro, R. V., Pingale, S. M., & Singh, S. K. (2021). Erosion risk assessment through prioritization of sub-watersheds in Nyabarongo River catchment, Rwanda. Environmental Challenges, 5(100260), 1–20. https://doi.org/10.1016/j.envc.2021.100260
- Langbein, W. B. (1947). Topographic characteristics of drainage basins. US Geological Society Water Supply Paper 968-C. http://pubs.usgs.gov/wsp/0968c/report.pdf
- Magesh, N. S., Chandrasekar, N., & Soundranayagam, J. P.(2011). Morphometric evaluation of Papanasam and Manimuthar watersheds, parts of Western Ghats, Tirunelveli district, Tamil Nadu, India: A GIS approach. Environmental Earth Sciences, 64(2), 373–381. https://doi.org/10.1007/s12665-010-0860-4
- Mahala, A. (2020). The significance of morphometric analysis to understand the hydrological and morphological characteristics in two different morpho-climatic settings. Applied Water Science, 10(1), 1–16. https://doi.org/10.1007/s13201-019-1118-2
- Meshram, S. G., Sharma, S. K. (2018). Application of principal component analysis for grouping of morphometric parameters and prioritization of watershed. Singh, V., Yadav, S., Yadava, R. (Eds.), Hydrologic Modeling. Water Science and Technology Library. vol 81. (Singapore: Springer.) pp. 447–458. https://doi.org/10.1007/978-981-10-5801-1_31
- Najia, F., Bouchta, E. F., Mohamed, M., & Brahim, B. (2021). Evaluation of morphometric parameters and prioritization of the Oued Joumouaa watershed. Ecology, Environment and Conservation, 27, S403–S419. http://www.envirobiotechjournals.com/EEC/v27novSuppl2021/EEC-51-without%20email.pdf
- NAMRIA. (2014). Informapper, 21. A publication on Surveys, Mapping and Resource Information Technology. 0117-1674. National Mapping and Resource Information Authority. https://www.namria.gov.ph/
- Negese, A., Fekadu, E., & Getnet, H. (2021). Potential soil loss estimation and erosion-prone area prioritization using RUSLE, GIS, and remote sensing in Chereti Watershed, Northeastern Ethiopia. Air, Soil and Water Research, 14, 1–17. https://doi.org/10.1177/1178622120985814
- Nookaratnam, K., Srivastava, Y. K., Venkateswararao, V., Amminedu, E., & Murthy, K. S. R. (2005). Check dam positioning by prioritization of micro-watersheds using SYI model and morphometric analysis — Remote sensing and GIS perspective. Journal of the Indian Society of Remote Sensing, 33(1), 25–38. https://doi.org/10.1007/BF02989988
- Pandey, A., Chowdary, V. M., Mal, B. C., & Dabral, P. P. (2011). Remote sensing and GIS for identification of suitable sites for soil and water conservation structures. Land Degradation and Development, 22(3), 359–372. https://doi.org/10.1002/ldr.1012
- Pareta, K., & Pareta, U. (2011). Quantitative morphometric analysis of a watershed of Yamuna Basin, India using ASTER (DEM) Data and GIS. International Journal of Geomatics and Geosciences, 2(1), 248–269. https://asset-pdf.scinapse.io/prod/2284898316/2284898316.pdf
- PPDO. (2006). Bohol Agricultural Master Plan CY 2006-2026. Provincial Planning and Development Office. Tagbilaran City 6300 Philippines. https://ppdo.bohol.gov.ph/plan-reports/
- Puno, G. R., & Puno, R. C. C. (2019). Watershed conservation prioritization using geomorphometric and land use-land cover parameters. Global Journal of Environmental Science and Management, 5(3), 279–294. https://doi.org/10.22034/gjesm.2019.03.02
- Rai, P. K., Chandel, R. S., Mishra, V. N., & Singh, P. (2018). Hydrological inferences through morphometric analysis of the lower Kosi river basin of India for water resource management based on remote sensing data. Applied Water Science, 8(1), 1–16. https://doi.org/10.1007/s13201-018-0660-7
- Rodrigues, V. S., Do Valle Júnior, R. F., Sanches Fernandes, L. F., & Pacheco, F. A. L. (2019). The assessment of water erosion using partial least squares-path modeling: A study in a legally protected area with environmental land use conflicts. Science of the Total Environment, 691, 1225–1241. https://doi.org/10.1016/j.scitotenv.2019.07.216
- Saha, S., Das, J., & Mandal, T. (2022). Investigation of the watershed hydro-morphologic characteristics through the morphometric analysis: A study on Rayeng basin in Darjeeling Himalaya. Environmental Challenges, 7(100463), 1–16. https://doi.org/10.1016/j.envc.2022.100463
- Schumm, S. A. (1956). Evolution of drainage systems and slopes in badlands at Perth Amboy, New Jersey. Bulletin of the Geological Society of America, 67(5), 597–646. https://doi.org/10.1130/0016-7606(1956)67[597:EODSAS]2.0.CO;2
- Singh, S., Singh, A. K., Kumar, P., & Jaiswal, M. K. (2021). Morphotectonic analysis of the Bihar River, Madhya Pradesh, India. Proceedings of the Indian National Science Academy, 87(1), 163–174. https://doi.org/10.1007/s43538-021-00023-8
- Smith, K. G.(1950). Standards for grading texture of erosional topography. American Journal of Science, 248(9), 655–668. https://doi.org/10.2475/ajs.248.9.655
- Strahler, A. N. (1952). Hypsometric (area-altitude) analysis of erosional topography. Geological Society of America Bulletin, 63, 1117–1142. https://doi.org/10.1130/0016-7606(1952)63[1117:HAAOET]2.0.CO;2
- Strahler, A. N. (1957). Quantitative analysis of watershed geomorphology. Transactions, American Geophysical Union, 38(6), 913–920. https://doi.org/10.1029/TR038i006p00913
- Taha, M. M. N., Elbarbary, S. M., Naguib, D. M., & El-Shamy, I. Z.(2017). Flash flood hazard zonation based on basin morphometry using remote sensing and GIS techniques: A case study of Wadi Qena basin, Eastern Desert, Egypt. Remote Sensing Applications: Society and Environment, 8, 157–167. https://doi.org/10.1016/j.rsase.2017.08.007
- Torrefranca, I. G., Otadoy, R. E. S., & Tongco, A. F. (2022a). Dynamic river basins and hypsometric analyses: Implications to land management and prioritization in Bohol, central Philippines. International Journal of River Basin Management, 1–34. https://doi.org/10.1080/15715124.2022.2092487
- Torrefranca, I. G., Otadoy, R. E. S., & Tongco, A. F. (2022b). Incorporating landscape dynamics in small-scale hydropower site location using a GIS and spatial analysis tool: The case of Bohol, central Philippines. Energies, 15(1130), 1–31. https://doi.org/10.3390/en15031130
- Verma, N., Patel, R. K., & Choudhari, P. (2022). Watershed prioritization for soil conservation in a drought prone watershed of Eastern India: Tel River Basin, Odisha. Geology, Ecology, and Landscapes, 1–14. https://doi.org/10.1080/24749508.2021.2022830
- Zavoianu, I. (1985). Morphometry of drainage basins. Developments in Water Science 20, Elsevier, Amsterdam, https://doi.org/10.1016/0022-1694(87)