
 ?Mathematical formulae have been encoded as MathML and are displayed in this HTML version using MathJax in order to improve their display. Uncheck the box to turn MathJax off. This feature requires Javascript. Click on a formula to zoom.
ABSTRACT
This study sought to integrate the Cellular Automata-Markov Model (CA-Markov) and the Cellular Automata (CA) using sensing data for land cover maps for the years: 1988, 2000, 2013 and 2020 to monitor, detect, and predict the spatial and temporal of Land Use/Land Cover (LULC) change in Al-Hassa Oasis, Saudi Arabia. The maximum likelihood classifier (MLC) method was used as a supervised classification algorithm to super control classification coefficients. Training areas were extracted to classify green and water from Landsat images using The Natural Vegetation Index (NDVI) and Normalized Difference Water Index (NDWI) indicators, respectively. The Markov form has been used Cellular Automata (CA)To create a Transition probability Matrix (TPM)), Transition Area Matrix (TAM) and Transition Suitability Maps (TSM), which is the main factor for obtaining to simulate the prediction of the future of land use/land cover in the years 2030 and 2050, while was used Cellular Automata-Markov Model (CA-Markov) To validate and Forecasting LULC. The results showed an expansion in urban areas by 63.5% equivalent to about 105.7 km2, and an increase in agricultural land by 6.6% equivalent to 10.7 km2 despite the loss of about 3.2% of the old agricultural land during the period 2000–2013 AD. Also, the area of marshes and water increased by about 41.7% equivalent to about 8.7 km, which led to the loss of 5.9% or the equivalent of about 139 km2 of arid lands during the past three decades. The projected LULC maps for 2030 and 2050 indicate that these patterns of arid lands that change into built-up areas and agricultural lands will continue over the next thirty years due to urban growth and the development of agricultural activities. The main strength of this study is the use of a relatively long period that allowed us to conduct a very good assessment of LULC in the study area, as well as to predict the different patterns for 2030 and 2050. Moreover, the results obtained in this study provide information to help decision makers to carry out effective practices for future planning and management of urban land growth and land use planning, especially in the Saudi Vision 2030.
1. Introduction
Knowledge related to the monitoring and control of past and present land use/land cover plays an important role in the decision-making process (Moghadam & Helbich, Citation2013; Patino & Duque, Citation2013) and its prediction simulation can provide input data for various environmental and planning models (Dimitrios et al., Citation2019; Islam et al., Citation2018; Li, Chen, et al., Citation2017). Monitoring and observing land use/land cover help advance our understanding of past trends, while modeling, based on prediction simulation, provides insight into potential future developments (Appiah et al., Citation2017; Chim et al., Citation2019; Mishra et al., Citation2020). Both complementary approaches are considered necessary strategies to formulate better land/land cover use policies (Taubenböck et al., Citation2009).
A variety of land-use models have been developed to simulate and predict the future of land use/land cover change primarily by coupling remote sensing (RS) and geographic information system (GIS) data (Sohl et al., Citation2016). Land cover change models are tools used to analyze and provide a better understanding of the causes and consequences of land use/land cover changes, they can also be used to investigate the complex driving forces that influence spatiotemporal patterns of land use/land cover changes (Verburg et al., Citation2004)
Models that are characterized by simplification and abstraction play a very important role in monitoring, observing, and predicting spatial patterns of land use/land cover, and in recent years many models of monitoring and prediction simulations of land use/land cover change have been applied, the most important of which are as follows: Markov (Guan et al., Citation2019; Mohamed & El-Reay, Citation2018; Mondal et al., Citation2019). The SLEUTH model (a cellular automata-based computer simulation model) (Clarke & Gaydos, Citation1988). Multi-criteria analysis and the Analytical Hierarchy Process (AHP) (Svoray et al., Citation2012; Zakerinejad & Marker, Citation2014). Multivariable statistical methods (MSMs) such as: Linear regression (LiR) (Chaplot et al., Citation2005). Logistic regression (LR) (Conoscenti et al., Citation2014; Vanwalleghem et al., Citation2008). Machine Learning Methods (SVM) (Kheir et al., Citation2007; Märker et al., Citation2011; Pourghasemi et al., Citation2017). Artificial Neural Networks (ANN) (Märker et al., Citation2011).
In this study, an innovative approach has been integrated for three computer software models, two of which are within the IDRISI Selva v.17.0 program, these models are the Land Change Model (LCM) and the CA-Markov Model, whereas the third model is the multi-criteria analysis model based on geographic information systems (GIS-MCA). The Analytic Hierarchy Process (AHP) was also used to determine the weights of the criteria affecting the spatial suitability map, and the land change model (LCM) was used to monitor the features of change in the land use/land cover map during the period 1988–2020. The Land Change Model (LCM) is an integrated software environment for land use/land cover analysis and prediction. To validate the results, LCM has been included in the IDRISI program (Tewolde & Cabral, Citation2011), where only thematic bitmaps that have the same land cover classes are listed in the same sequential order in the land use/land cover analysis (Roy et al., Citation2014), then the LCM assesses land cover changes between two different times, calculates the changes, and presents the results with various graphs and maps. This model was adopted because it proved effective in predicting land use/land cover change in the study area (Megahed et al., Citation2015; Shooshtari & Gholamalifard, Citation2015).
In recent decades, the cellular automata (CA) model has been of interest to researchers because of its simplicity, flexibility, and ability to combine spatiotemporal dimensions (Chen et al., Citation2016; Santé et al., Citation2010). According to various studies, the cellular automata model is a useful tool for modeling land use/land cover changes. It is also applicable to various topics, such as urban growth prediction, traffic simulation, and land use/land cover changes (Rezazadeh & Mirahmadi, Citation2009; Ward et al., Citation2000).
The cellular automata model – Markov (CA-Markov) is based on the main hypothesis, which is the extrapolation of future growth by tracking its behavior in the past and assuming the stability of the trends of this growth and the values of change in the future. Successive satellite visualizations of the city are an important basis for this stability.
Among all the spatiotemporal simulation techniques, the CA-Markov model is the most popular and applied in most prediction and simulation studies of urban growth (Aburas et al., Citation2016; Li, Chen, et al., Citation2017; Santé et al., Citation2010; White & Engelen, Citation2000). It has been used to model land-use changes and to predict future urban growth since the 1990s (Batty & Xie, Citation1994; Wu, Citation1998, Citation2002), where prediction simulations are based on the assumption that “historic urban areas will influence patterns of future growth through interactions between different types of land use” (Clarke et al., Citation1997).
Studies related to monitoring land use changes and predicting them in the arid and semi-arid environments in general, and the Kingdom of Saudi Arabia in particular, can be divided into two main sections. The first section is concerned with studies that dealt with detecting land-use changes only without predicting. The most important thing to note in this study is that it is numerous and widespread across the Kingdom, and most of it is based on different Landsat visuals, whose archives cover different dates or visuals of the type Sentinel-2. The classification process was based on the supervised classification method or the controlled classification or the uncontrolled classification using some indicators, such as NDVI and NDWI. The maximum likelihood classifier (MLC) mostly captured the vast majority in most of the studies reviewed, and the resulting classification category ranges from four to seven categories: The most important of which are bare lands, desert lands, urban areas, agricultural lands, marshes, water, and roads. The results of the validity of the classification are verified through the kappa indicator. The most prominent studies that represent this trend are studies (Chouari Citation2021; Alharthi et al. Citation2020; Alqurashi and Kumar Citation2016; Abdelkarim, et al., Citation2020; Alqurashi & Kumar, Citation2014; Alsharif et al., Citation2022; Shrahily et al., Citation2022);
As for the second type of studies, they are studies that dealt with detecting changes while predicting the future of land uses. It is noted that these studies are very few in the dry environment of the Kingdom of Saudi Arabia. Moreover, these studies used the Cellular Automata-Markov Model (CA-Markov) mainly in the process of predicting land uses (Abdelkarim et al., Citation2022; Al-Alola et al., Citation2021; Alsharif et al., Citation2022). The research methodology, methods, and tools do not differ much in studies conducted outside the Kingdom of Saudi Arabia, with the availability of various methods for producing maps of spatial suitability (driving force), which help in the process of predicting land uses, as the methods and techniques vary in producing these maps, such as: Frequency rate, fuzzy logic, artificial neural network, MCE, AHP, decision tree, and multivariate regression lines. In this regard, many studies can be found, such as studies (Mansour et al., Citation2022; Pakawan & Saowanee, Citation2019; Solomon et al., Citation2019; Wang et al., Citation2021, Citation2022).
Through reviewing previous studies, it is clear that no independent and in-depth study was concentrated on detecting and predicting land uses in Al-Hassa Oasis, which clearly lacks such studies. All that was found about it is nothing more than references within a number of geographical studies that dealt with the Kingdom in general or some studies of small parts of Al-Hassa Oasis, such as the study of Chouari (Chouari, Citation2021) about the detection of land cover change using multi-spectral Landsat data: A case study of the wetlands in Al-Asfar Lake east of Al-Hassa city. The study focused on a very small part located east of Al-Hassa Oasis known as Al-Asfar Lake. The other study is Guma and Aljughaiman (Biro Turk & Aljughaiman, Citation2020) about the LULC assessment as associated with soil salinity and irrigation water above an oasis in an arid environment. The study focused on the agricultural eastern part of Al-Hassa Oasis and not the entire Oasis. In addition to producing a map of the land cover for a specific year only as in the study of Salih (Abdelatti et al., Citation2017; Almadini et al., Citation2019; Alqarni et al., Citation2018; Salih, Citation2018). It is about producing a map of the land cover in Al-Hassa Oasis according to the classification of a satellite visual of the type landsat-7 ETM for the year 2017 AD. The researcher applied the supervised classification method using the maximum likelihood classifier (MLC). Despite the increasing importance of urbanization in Al-Hassa Oasis due to oil revenues in the region, the increasing migration from rural to urban areas, recruitment, undertaking works in the oasis at the expense of the countryside, the high environmental sensitivity of the Oasis, which overcomes the sandy deserts from all sides, and the increasing pressures on the map of land uses in the large Al-Hassa Oasis during the past years, there is now a comprehensive study to detect the changes associated with the map of land uses during a clear time series to reveal the features of the effects accompanying this imposed urbanization.
The researcher has benefited greatly from previous studies in terms of enriching the scientific background, and shaping the approach followed in studies of detecting change and prediction of land uses through many available scientific references. The current study of the researcher is in line with the previous studies in terms of theoretical, scientific, methodological, and methods used in the studies of detection and prediction of changes. The most important thing that distinguishes this study from previous studies is its integration, comprehensiveness, and concentration on the land use map of a dry desert oasis that has undergone great environmental and urban changes during the past 40 years. This is important in terms of planning for political and planning decision-makers in the Kingdom of Saudi Arabia in light of the vision of the Kingdom 2030 AD in general and the increasing economic importance of the first palm oasis in the Kingdom. In addition to the future prediction of the map of land uses until the year 2050 AD through its integration of remote sensing techniques and GIS.
The problem of the study lies in the following: (1) This study area has high environmental sensitivity as a result of the characteristics of the fragile dry desert environment, and its susceptibility to rapid successive changes, as the Al-Hassa Oasis is one of the areas threatened by desertification due to the encroachment of sand, drought, soil erosion by wind, the deterioration of vegetation cover, urban growth, and shrinking agricultural area. Moreover, ignoring the environmental sensitivity of the oasis, like the removal of vegetation cover, palm trees, and change of land uses may lead to the deterioration of the natural environment of the oasis. Therefore, ecological and environmental balance considerations of the natural and biological systems represent a fundamental factor in formulating the map of future land uses in the region. (2) The continuous change in the patterns of land use/land cover and continuous urban growth represents one of the most prominent urban challenges. Besides, dealing with the challenges of land use/land cover growth in a fast-paced, large-scale, comprehensive, dimensional, and heterogenous manner, burdens any government or local administration regardless of its nobility and longevity. This planning defect posed great challenges in the urban development and distribution of services during the current and future periods.
This study aims to: (1) Monitor and observe the most important features of land use/land cover changes in Al-Hassa Oasis during the period 1988–2020. (2) Analyze the most important areas, trends, and factors of the driving forces for land use/land cover during the period 1988–2020 and their role in guiding the map of the future land use/land cover in the years 2030 and 2050. (3) Produce future land use/land cover maps for the years 2030 and 2050 for the Al-Hassa Oasis.
2. Materials and methods
2.1. Study area
Al-Hassa Oasis is located in the eastern region, about 125 km southwest of the city of Dammam, about 75 km from the Arabian Gulf, with longitude from 25°12”18.05” to 25° 38”30.01’‘North, and latitude from 49° 42’59.96” to 49° 32’32.14” East (). Al-Hassa Oasis is bordered on the north by the city of Abqaiq and the Abu al-Hamam desert, on the west by the Al-Dahna desert and the Summan hill, on the east by the Al-Jafurah desert and Al-Asfar lake along with the Arabian Gulf, and from the south is the Al-Jafurah desert and beyond it is the Empty Quarter desert (the Rub al Khali desert).
Figure 1. The location of the study area in Saudi Arabia in 2020.
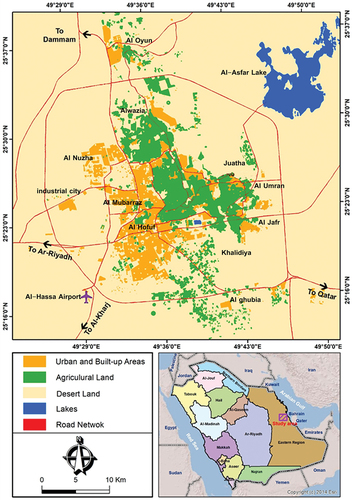
The unique geographical location of Al-Hassa, which links the Kingdom of Saudi Arabia to the countries of the Gulf Cooperation Council, on the one hand, and is between the cities of Riyadh and Dammam, on the other hand, led to the ease of commercial, industrial, cultural, and civilizational exchange, which paved the way for the emergence of ancient civilizations in the region. According to the satellite visual classification for the year 2020, Landsat 8/OLI, and its source is the United States Geological Survey (USGS), the area of Al-Hassa Oasis reached about 2729.3 km2 divided as follows: The urban areas of Al-Hassa Oasis constitute about 166.62 km2 with a rate of 6.1%. The agricultural lands are about 162.31 km long2, with a percentage of 6%. The water areas are about 20.77 km2 with a percentage of 0.8%. And the vast majority are desert lands, which are about 2379.6 km2 with a percentage of 87.1%.
The population of Al-Hassa Oasis is about 1,272,633 people, representing about 95.6% of the total population of Al-Hassa Governorate, which is about 1,331,009 people. Most of the population is concentrated in the municipalities of Al Hofuf and Al Mubarraz with a percentage of 63.8%. Additionally, two of the Al-Hassa governorate’s cities, Al Hofuf and Al Mubarraz, which are among the 10 largest cities in the whole Kingdom, are located in the Al-Hassa Oasis. Al-Hassa Oasis consists of six municipalities: Al Hofuf, Al Mubarraz, Al Jafr, Al Umran, Al Uyun, and Jawatha. The largest population is in the municipality of Al Hofuf with 438,563 people, and these municipalities include about 291 neighborhoods and the population density is concentrated in the center and north of the oasis. The Oasis’s terrain is flatter and less rugged than the rest of the surrounding areas, except for some scattered hills that protrude above the general level of the oasis surface. These hills in the Al-Hassa Oasis are usually called Qarat, as is the case with Jabal Qarah in the middle of agricultural lands, and Jabal Abu Hasis. There, the levels of the land’s surface range from 152 to 156 m, while the western parts rise to reach 268 m. The slope of the surface of the Al-Hassa Oasis, in general, is directed towards the east and north-east and indicates the direction of the slope in the oasis and the adjacent areas towards the valleys in the drainage basins.
2.2. Study procedures and data processing
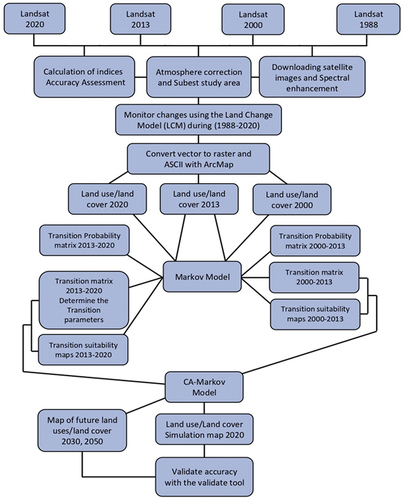
The study procedures and data processing, which are illustrated in , included the main first, monitoring land use/land cover changes in Al-Hassa Oasis during the period 1988–2020, second, using the cellular automata-Markov model (CA-Markov) for predicting land use/land cover in the years 2030 and 2050.
Figure 2. Study procedures and data processing.
2.2.1. Monitoring land use/land cover changes
Planning and monitoring changes in land use/land cover (LULC) are vital for sustainable development, planning, and management (Saadat et al., Citation2011). The process of monitoring changes in land use/land cover for the Al-Hassa Oasis during the period 1988–2020 has gone through a set of basic stages that can be reviewed in detail as follows:
2.2.1.1. Characteristics of satellite images
Remote sensing data, such as Landsat images, is freely available on the internet and covers almost the entire Earth, which has allowed for continuous monitoring of land use/land cover change since 1988 (USGS, 2013). The first stage is to download four satellite images from the United States Geological Survey (USGS) to monitor the changes in land use/land cover that had occurred in the Al-Hassa Oasis during the period 1988–2020. The satellite images for the years 1988 and 2000 from the Thematic Mapper (TM) sensor carried on the American satellite Landsat 4–5, while the satellite images for the years 2013 and 2020 were obtained from the Operational Land Imager (OLI) sensor on the Landsat 8 satellite. The Enhanced Thematic Mapper (ETM) sensor on the Landsat 7 satellite was not used due to technical problems with the sensor, which was evident in its output images. and show the characteristics of satellite images during the period 1988–2020.
Figure 3. False colour composite (FCC) of Land sat 4–5 (TM)+ bands 7(red), 4(green), 2(blue) for the years 1988, and 2000.
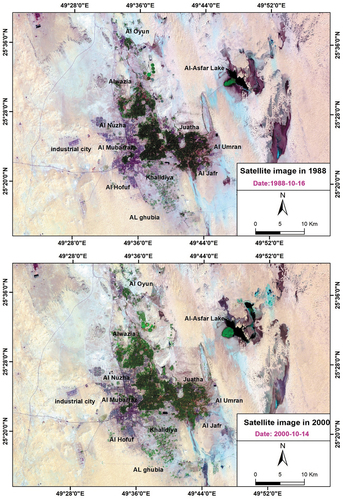
Figure 4. False colour composite (FCC) of Land sat 4–5 (TM)+ bands 7(red), 5(green), 3(blue) for the years 2013 and 2020.
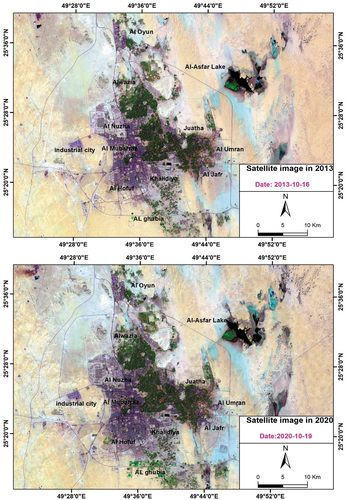
Table 1. Characteristics of satellite images of Al-Hassa Oasis during the period 1988–2020.
2.2.1.2. Image processing
Spectral enhancement is performed to increase spectral accuracy and ease of processing. This is done to avoid aliasing in the spectrum “spectral overlapping” in Landsat images, which might result in interference in the spectral fingerprints, so spectral enhancement of the visual is performed to increase the spectral accuracy and reduce spectral overlap through the Principal Component.
The preprocessing of the present research was divided into three main stages. (1) Radiometric correction was performed to reduce, eliminate, and correct errors in the digital numbers of the image. The radiometric correction (also known as) was performed by calculating the top-of-atmosphere (TOA) reflectance using Equations (1) and (2) (Pinto et al., Citation2020):
where is the TOA reflectance, Up is the band multiplicative value, Ap is the band additive value,
cal is the digital numbers of the satellite bands,
is the TOA reflectance, and
is the sun elevation angle. (2) The spectral bands of each Landsat datasets were combined through layer stacking to get a full color composite image comprising the spectral bands from band 1 to band 7. (3) The subsequent step was clipping the four images independently to match the boundary of the study area.
2.2.1.3. LULC classification and accuracy
In this study, it was relied upon the supervised classification method using the maximum likelihood classifier method (MLC) in the classification of Landsat satellite images for years in 1988, 2000, 2013, and 2020. Although several methods have been devised to implement supervised classification, the maximum likelihood classifier, also known as Bayes’ decision rule (Weng, Citation2002), is one of the most widely used supervised classification algorithms due to its availability and simple training process (Jensen & Cowen, Citation1999). In this method, satellite image pixels are classified based on their probability of belonging to a particular LULC category. The concept of the method assumes equal probabilities for all classes and a normal distribution for all input bands, and the input bands used in the study to produce composite maps with false colors consist of bands 7 ، 4 ، 2 ، for Land sat 4–5 (TM) and 7 ، 5 ، 3 ، for Landsat 8 (OLI), the spectral signature of each image pixel was matched to the training samples of the study area and satellite images classified into 4 broad land use/land cover types (LULC). They are as follows (water, agriculture, desert land, and desert) ().
Table 2. LULC classes in the study area and the corresponding description.
Table 3. Description of digitized reference pixels.
The analysis of the Landsat images showed that each class has a distinctive spectral signature. However, the Landsat medium-resolution images have lots of mixed pixels. Consequently, the differentiation between them, especially in urban areas, was sometimes not accurate and induced confusion. Two critical processing techniques were performed on the pre-processed images, the Natural Vegetation Index (NDVI), which is an indicator that measures the difference between cultivated and uncultivated land and provides a measure of plant density and condition. Land cover is affected by vegetation, vegetation density, and vegetation greening. This indicates that the photosynthetic power of the Earth’s surface cover, and Normalized Difference Water Index (NDWI) was used to extract the vegetated areas and waterbodies, respectively, from the successive Landsat images. The NDVI and NDWI were extracted and analyzed individually for all Landsat data (using thresholds specific to each image) As the Landsat-8 data have narrower spectral bands. () (Taufik et al., Citation2016), according to the following EquationEquations (3)(3)
(3) and (Equation4
(4)
(4) ) (Holtgrave et al., Citation2020).
Figure 5. NDVI of Landsat imagery from 1988 to 2020.
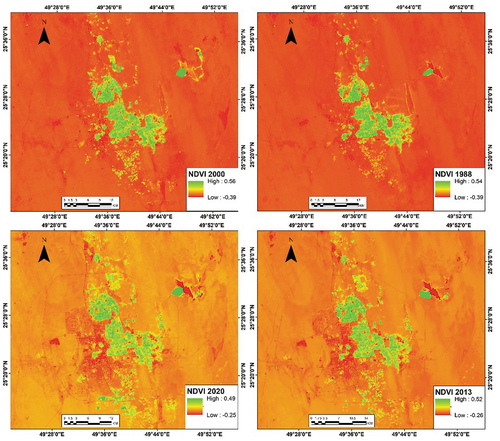
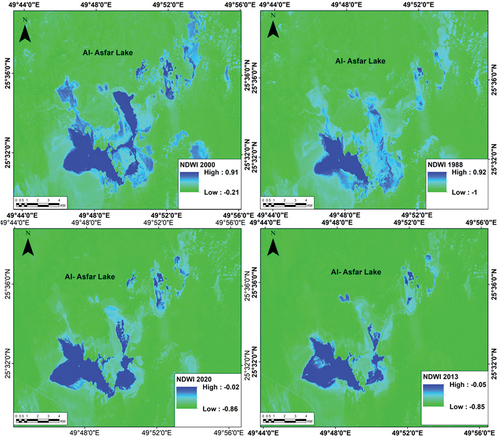
Figure 6. NDWI of Landsat imagery from 1989 to 2020.
where NIR is the near-infrared band (band 4 in Landsat-5, Landsat-7 and band 5 in Landsat-8), Red is the red band (band 3 in Landsat-5, Landsat-7 and band 4 in Landsat-8), and SWIR (band 5 in Landsat-5, Landsat-7, and band 6 in Landsat-8) is the short-wave infrared band.
The last step in the classification process was to verify the accuracy of the image classification by comparing the results of the supervised classification with the basic fact information from producers and users, and overall accuracy, as well as the Kappa accuracy statistic. The accuracy of the classification was estimated using the stratified random sampling method via the accuracy assessment tool in ERDAS Imagine software, through stratified randomly sampled GTD (Wang et al., Citation2021). Stratified random sampling method is a common method of assessing accuracy. This sampling method allows for the possibility of equivalent sampling for all LULC categories in the entire study area without bias (Dey et al., Citation2021; Kafy et al., Citation2021; Wang et al., Citation2021). The accuracy of the product and user was calculated as suggested by (Fung & Ledrew, Citation1988) to obtain the average accuracy of the visualizations used in the study from 1988 to 2020, the classified image was compared with the ground fact data to verify and calculate the accuracy of the classification. The accuracy confusion matrices showed that the overall accuracy was 91.23%, 93.65%, 95.32%, and 98.66% and the Kappa coefficients were 89.64, 92.41, 93.66, and 96.98 for the four Landsat images in 1988, 2000, 2013, and 2020, respectively (). The kappa coefficient was calculated as follows: EquationEquations (5(5)
(5) ,Equation6
(6)
(6) ,Equation7
(7)
(7) and Equation8
(8)
(8) ) (Faichia et al., Citation2020; Khawaldah, Citation2016).
Table 4. Overall classification accuracy and Kappa statistics.
where N is the number of all pixels used for observation, is the number of rows in the error matrix (number of classes),
is the diagonal value of the contingency matrix of row
and column
,
is column pixel number
, and
+ row pixel number
.
2.2.2. Monitor changes using the Land Change Model (LCM)
Geographical information systems and satellite-based image analysis can be used as effective tools for urban planning. The satellite visuals provide updated information on the land cover (Piekarczyk, Citation2014). At this stage, the results of classifying the visuals in 1988, 2000, 2013, and 2020, which had been processed and produced in the previous stages, were adopted and entered directly into the Land Change Model (LCM). Land Change Modeler (LCM) built in TerrSet software version 18.31 was used to simulate future LULC changes. It is an empirically driven stepwise process performing change analysis, transition potential modeling, and change prediction (Eastman, Citation2015) based on the historical.
The land change model (LCM) is an innovative land planning and decision support system integrated into the IDRISI Selva v. 17.0 program, which was developed by Clark Labs to analyze land cover change, and experimentally model the relationship between land change and explanatory variables. The LCM tool was applied to analyze land use/land cover change for the Al-Hassa Oasis during the period 1988–2020. The “Validate” tool was used in the IDRISI program to verify the accuracy of the model, which eventually showed very high accuracy for different Kappa coefficients.
2.2.3. Markov Model Cellular Automata (CA)
The Markov form is used Cellular Automata (CA) to create a Transition Probability Matrix (TPM), Transition Area Matrix (TAM), and Transition Suitability Maps (TSM) (Ozturk, Citation2015) Which is the main factor and is the key to obtaining simulation of the land use in Cellular Automata-Markov Model (CA-Markov) (Eastman, Citation2015; Mishra et al., Citation2014), and the TPM is obtained by scheduling two multi-time images, each category has the potential to change ground cover to another within a predetermined period of time, and the TAM. On the estimated number of pixels that may change during a specific number of time units from one specific ground cover category to another, while reflecting the map of the convenience of the transition (TSM) about the possibility of each land cover class pixel in a place with the designated category after a specified time (Nadoushan et al., Citation2015). In this study, land use data for the four time periods used in the study were entered in ASCII format within the environment of the IDRISI selva v.17.0 program. In addition, the Cellular Automata (CA) model was used to obtain (TSM), (TPM), and (TAM) for the time period 2000–2010 for the purpose of obtaining a simulation of the spatial distribution of land uses in 2020. It was also used to obtain (TSM), (TPM), and (TAM) for the time period 2010–2019 for the purpose of obtaining a simulation of the spatial distribution of land uses in the year 2030, 2050. The Cellular Automata (CA) Model can be explained as follows in the EquationEquation (9)(9)
(9) (Sang et al., Citation2011).
Where S is the set of limited and discrete cellular states, N is the Cellular field, t and t + 1 indicate the different times, and f is the transformation rule of cellular states in local space.
2.2.4. Markov Cellular Automation Model
Accurate simulations and land use/land cover predictions are necessary to manage urbanization and explicitly address trends and spatiotemporal distributions, and the CA-Markov model is one of the most widely used models for this purpose (Tingting et al., Citation2019). The process of future prediction of land use/land cover in Al-Hassa Oasis was carried out using the IDRISI selva v. 17.0 program by applying the famous CA-Markov prediction model, which was developed at Clark University laboratories to predict a certain phenomenon during a particular period. Because the prediction process requires certain information in different periods for the same area under study, multi-temporal data are very effective and successful in achieving the prediction process by tracking the stages of development of phenomena at different times. The result of the Markov model depends on the transition probability (Coppedge et al., Citation2007). And the transition probability (Pij) between state (j) and (i) is the probability that the land cover (i in pixels) in time (x) changes to the land cover class (j) in time (x + 1), the change dynamics for any study area depends on the past or present land cover state (Coppedge et al., Citation2007) and is mathematically calculated as approved by (Subedi et al., Citation2013) using the two EquationEquations (10)(10)
(10) and (Equation11
(11)
(11) ).
Transition probabilities are obtained from the transition samples that occur during a specified period ((Adhikari & Southworth, Citation2012)) and are presented in the transition matrix (P).
Where:
L (x) and L(x+1) are the land use/land cover conditions at (x + 1) and (x), respectively. is the transition probability matrix.
The kappa values of the CA – Markov model for LUCC simulation ranged from −1 to 1, where positive values are a sign of agreement, and negative values illustrate a lack of agreement Kappa _ 0.5 shows high agreement, 0.5 _ Kappa _ 0.75 marks a moderate level of agreement, and 0.75 _ Kappa <1 (Faichia et al., Citation2020; Omar et al., Citation2013; Ruben et al., Citation2020) indicates a high level of agreement. EquationEquations (12(12)
(12) ,Equation13
(13)
(13) and Equation14
(14)
(14) ) for the summary statistics are:
where no information is N(n), medium grid cell-level information is M(m), and perfect grid cell-level information across the landscape is P(p).
2.2.4.1. Through the following steps, it is possible to predict the future land use employing the CA-Markov model
Entering the land use/land cover data in the six time periods shown in ASCII format within the environment of IDRISI selva v.17.0 software and using the CA-Markov model to obtain maps of appropriate transition, transition probability matrix, and transition area matrix for the period 2000–2013 to obtain a simulation spatial distribution of the land use map in 2020.
Predicting the map of land use/land cover for the year 2020 using the cellular automata model – Markov (CA-Markov) on the map of land use/land cover for the year 2013 and the matrix of transition areas resulting from the analysis of the maps of the years 2000 and 2013 in the previous step. The number of cycles was determined by 7 according to the number of years to be predicted from 2013 to 2020. The default filter 5 × 5 was used and a default error rate of 0.15 was determined.
Comparing the map of land use/land cover for the year 2020 resulting from the prediction with the existing map, which was obtained by the oriented classification of the satellite visual for the year 2020, using the “Validate” simulation accuracy tool in IDRISI program, and this step was to verify the accuracy of the simulation so that we can be assured of the results that will be obtained for the simulations in 2030 and 2050.
Using CA-Markov within the environment of the IDRISI selva v.17.0 program to obtain appropriate transition maps, the transition probability matrix, and the transition area matrix for the period 2013–2020 to obtain a simulation of the spatial distribution of land uses in the years 2030 and 2050.
Predicting of land use/land cover maps for the years 2030 and 2050 using the cellular automata model – Markov (CA-Markov). The number of cycles was determined by 10 and 30 cycles according to the number of years to be predicted, starting from 2020 until 2030 and 2050. The default filter 5 × 5 was used, and a default error rate of zero was determined.
3. Results
3.1. Monitoring land use/land cover changes
3.1.1. Monitoring the total changes of the land use/land cover map
The map of Transition of land use/land cover changes in Al-Hassa Oasis during the period 1988–2020 shown in revealed that the lands that were transformed into urban areas reached an area of 105.7 km2, and the largest percentage of these changes included the desert areas with a percentage of 93.33% of its area, which included the desert lands adjacent to the center of the oasis with a north–south extension with the presence of urban scattered to the west such as the National Guard and the industrial zone, in addition to the expansions at the expense of raising agricultural lands in the four main oases around the oasis, and the lands that became agricultural reached an area of 10.7 km2.
Figure 7. Total losses and gains in land use/land cover from 1988 to 2020.
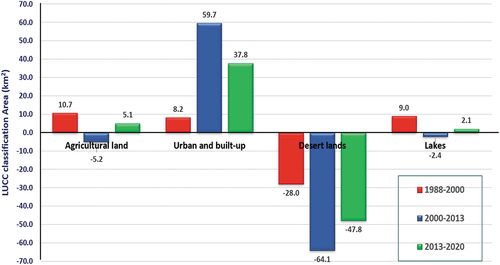
The largest percentage of these changes was at the expense of the desert areas around the four oases by 98.62%, in addition to the agricultural expansion towards the south of the oasis, and the lands that turned into salt lakes reached an area of 8.7 km2, and the largest percentage of these changes led to increasing the Al-Asfar salt lake, northeast of the oasis, by almost 100%, and the area of lands that turned into roads reached 15.8 km2, which included the largest percentage of these changes at the expense of desert areas by 89.36%. shows the changes in land use/land cover during the period 1988–2020, and shows Statistics of LUCC classification for 1988, 2000, 2013, and 2020, and shows Gains and losses in each type of land-use in 1988–2000, 2000–2013, 2013–2020, and 1988–2020, shows Spatial trend surface (fourth-order trend) of LULC dynamics in 2020.
Figure 8. Gains and losses in each type of land-use in 1988–2000, 2000–2013, 2013–2020, and 1988–2020.
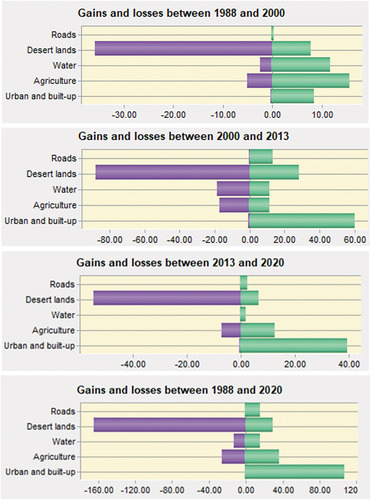
Figure 9. Spatial trend surface (4th-order trend) of LULC dynamics in 2020: (a) Urban and built-up to Agriculture, (b) Desert lands to Urban and built-up, (c) Agriculture to Urban and built-up, (d) All to Urban and built-up.
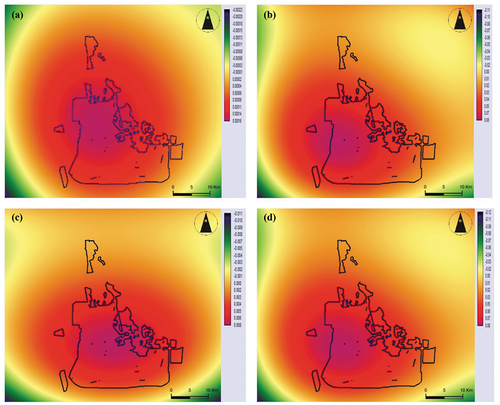
Table 5. Changes in land use/land cover during the period 1988–2020.
Table 6. Statistics of LUCC classification for 1988, 2000, 2013, and 2020.
3.1.2. Monitoring changes in urban areas during the period 1988–2020
Al-Hassa Oasis witnessed a great boom and an unprecedented development of the urban space, as urban construction increased during that period approximately 2.7 times its area, from 60.89 km2 in 1988 to about 166.6 km2 in 2020, and the urban increase amounted to about 105.71 km2, and the area of increase was distributed over 32 years, with a growth rate of 3.2%, and an average annual increase of 3.3 km2 over that period. The urban area in 1988 represented about 60.89 km2, due to the urban expansions and extensions of Al Hofuf, especially to the south and west, such as Khalidiya in the south, the Industrial City, and National Guard in the west at the expense of desert areas. This increase continued during the period between 1988 and 2000, until it reached 69.1 km2 in 2000, with an increase of 13.5% compared to what it was in 1988, due to the continued increase in urban growth to the south and east at the expense of desert areas and the noticeable increase in rural urbanization villages, especially Al-Muazil to the south and At Taraf to the east at the expense of agricultural lands ()
Figure 10. Change in land use/land cover for Al-Hassa Oasis between 1988 and 2000.
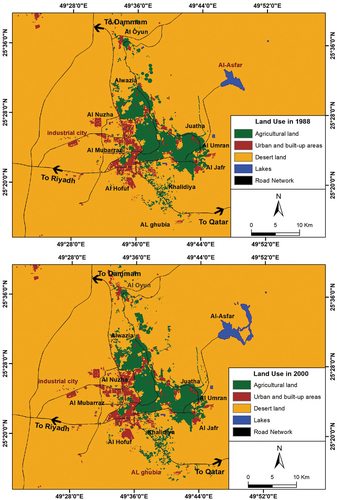
Figure 11. Change in land use/land cover for Al-Hassa Oasis between 2013 and 2020.
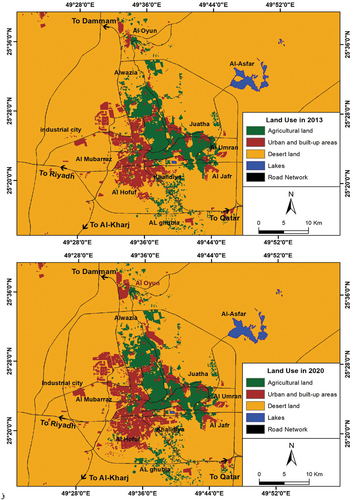
Figure 12. A comparison of urban growth and Agricultural land between 1988 and 2000.
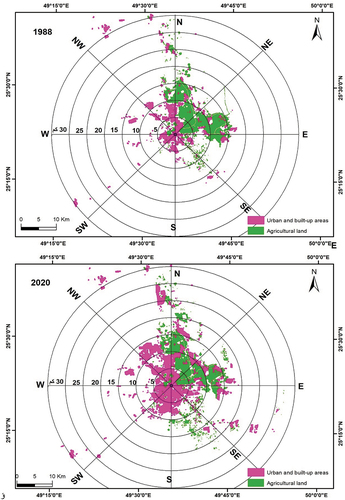
This increase also continued during the period 2000–2013 until it reached 128.79 km2 in 2013, with an increase of 86.4% compared to 2000, due to the steady urban growth that occurred during this period and the connection of some new urban communities to Al Hofuf, such as Khalidiya in the south and Mubarraz in the west at the expense of desert areas and the significant increase in the area of rural-urban villages such as At-Taraf and Al Umran at the expense of agricultural lands. Likewise, the increase continued during the period between 2013 and 2020, until it reached 166.62 km2 in 2020, with an increase of 29.4% compared to what it was in 2013, because of urban growth and extensions, especially in the southern extension and in the area between Al Hofuf and the National Guard in the west and Al-Muaizil in the north. clarifies the relationship between urban growth and population growth at the level of the municipalities of Al-Hassa Oasis in 2020, whereas the municipality of Al Hofuf ranked first in terms of urban growth by 32.9%, and the population thereof reached 438,563 people, and the municipality of Al Mubarraz ranked second in terms of urban growth, which reached 30.9% with population reached 411,220 people, whereas the municipality of Juatha ranked last with 4.9% of urban growth and its population reached 65,318 people.
Figure 13. Relationship between urban growth and population growth in 2020.
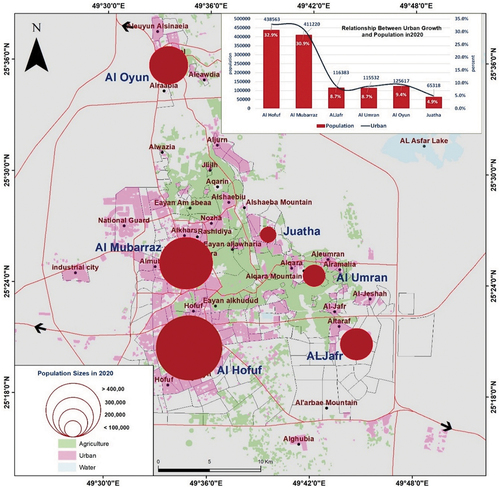
3.1.3. Monitoring changes in agricultural lands during the period 1988–2020
Al-Hassa Oasis witnessed many changes in the area of agricultural lands, as agricultural land was added during the period 1988–2020, approximately 1.07 times its area, from 151.63 km2 in 1988 to about 162.31 km2 in 2020, and the increase in agricultural lands amounted to about 10.67 km2. The area of increase was distributed over 32 years, with a growth rate of 0.2%, and an average annual increase of 0.33 km2 over that period.
The area of agricultural lands in 1988 was about 151.63 km2, the increase continued during the period between 1988 and 2000 until it reached 162.36 km2 in 2000, with an increase of 7.1% compared to what it was in 1988, to increase the agricultural area, especially in the northern parts at the expense of the desert areas. However, this area declined during the period between 2000 and 2013, reaching 157.19 km2 in 2013, with a decrease of 3.2% compared to what it was in 2000. The reasons for this are due to the lack of rain and high salinity, especially in the eastern oasis in the area east of Jabal Qarah, Al Umran, and Al-Asfar regions. And in some places of the northern oasis that surround the villages of Al Shuqaiq and Al Jalila, and also because those agricultural lands were affected by the phenomenon of sand encroachment, as well as the urban encroachment on agricultural lands. The area of agricultural lands increased again during the period between 2013 and 2020, until it reached 162.31 km2 in 2020, with an increase of 3.3% compared to what it was in 2013, due to the increase in the agricultural scattered spread in the northern and southern parts at the expense of the desert areas ().
3.1.4. Monitoring changes in water (marshes)
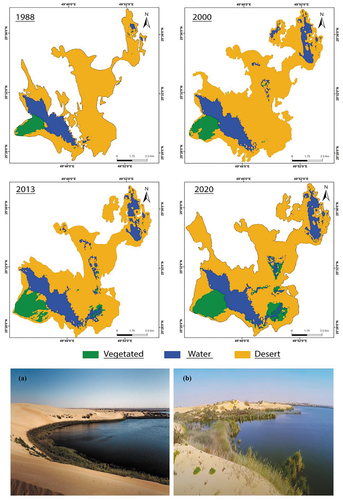
Marshes surround the Al-Hassa Oasis from all sides and spread across various parts of the Oasis land. The reason for the formation of marshes is the flat surface of the oasis and the surrounding areas from the north, east, and south, and the slight slope to the east and northeast. The existence of depressions inside the Oasis or the adjacent areas in which rainwater is collected led to the formation of some marshes. The area of water in 1972 represents about 4.11 square kilometers (topographic maps scale 5000:1) concentrated in marshes Al-Asfar northeast of Al-Hassa, which is a drainage area for adjacent agricultural lands. The area of water began to increase between 1988 and 2000, reaching 21.14 square kilometers in 2000, an increase of 57.3% over 1988, owing to an increase in the expansion of water in marsh. The area of water again decreased between 2000 and 2013, reaching 18.72 km2 in 2013, a decrease of 11.4% from 2000, owing to the decline in water again in marsh. Furthermore, the water area increased again during the period (2013–2020) to reach 20.77 square kilometers in 2020, with an increase of 11% from what it was in 2013, due to the increase in the water area in the marsh (). The reasons for water decline and expansion in marsh during time are attributed to the amount of rainfall and water discharge, as they generally expand in the winter and recede in the summer. It also expands in rainy years and recedes in dry years. Yellow Lake or Yellow marsh is exposed to a range of geomorphological hazards, the most important of which is the change of the lake’s shore line from year to year, the creep of sand from year to year, the increase in salinity, the change of chemical properties, and the exposure of the lake to salt weathering, which exposes the beer to significant environmental changes.
Figure 14. Detection of changes in land use/land cover for Al-Hassa Oasis between 1988 and 2000.
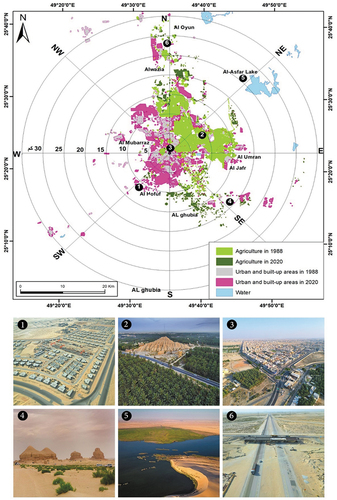
Figure 15. Change in land use/land cover for Al Asfar lake between 2013 and 2020.
3.2. Predicting the future of land use/land cover for Al-Hassa Oasis until the year 2050
3.2.1. The actual and predicted land use/land cover map for the year 2020
Land use modeling and simulation are among the main methods of land use/land cover study, and they are important tools for exploring the drivers of land use, supporting urban planning, policy formulation, and evaluating land use impacts on the ecological environment (He et al., Citation2017; Kuang, Citation2011). The cellular automata model – Markov (CA-Markov) was used on the layers of land use/land cover in the years 2000 and 2013, which are agricultural lands, urban areas, desert areas, water, and roads. And the two layers of land use/land cover in the years 2000 and 2013 were entered and the value of the interval between the two images was set to 13 indicating the difference of years between the land use/land cover in both images, and the number of years was set to 7, referring to the difference of years between 2013 and 2020, so that we can predict the map of land uses for the year 2020 and then compare it with the map of the actual land use/land cover for the year 2020, which was obtained from the oriented classification of the satellite visual of the captured area in 2020, to verify the accuracy of the model so that we can be assured of the prediction results for the year 2030 and 2050, in this context the transition probability matrix was obtained () and the matrix of transition areas, of land use for the years 2000 and 2013.
Table 7. Matrix of the transition probability between different land uses/land cover during the period 2000–2013.
Table 8. Matrix of transition values (number of Pixels) for different land use/land cover during the period 2000–2013.
and show the accuracy of the prediction model, which ranged between 77.05% and 100%, with an average accuracy of about 91.96% for different land use/land cover, as the area of agricultural lands resulting from the forecast for 2020 was about 151.77 km2, while the actual area resulting from the classification was 162.31 km2 with an accuracy of 93.51%, as for the urban mass, the area resulting from the prediction was 128.38 km2, while the actual area was 166.62 km2 with an accuracy of 77.05%, and the desert areas reached an area resulting from the prediction of 2425.98 km2, while the actual area was 2379.6 km2 with an accuracy of 98.09%, and the area of the water resulting from the prediction was 23.17 km2, while the actual area was 20.77 km2 with an accuracy of 89.64%, and finally, the area of the road network in the prediction map was 38.36 km2, and the actual area was 38.36 km2 with an accuracy of 100%.
Figure 16. The comparison land use/land cover between real map 2020 and simulated map 2020.
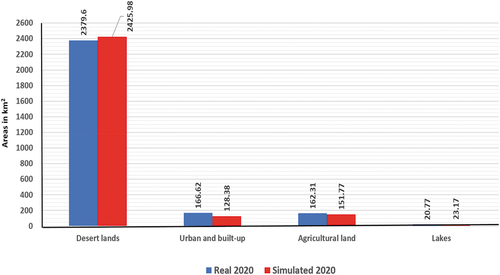
Figure 17. (a) the actual map of the land use/land cover in 2020. (b) the map of the land use/land cover in 2020 resulted from the prediction.
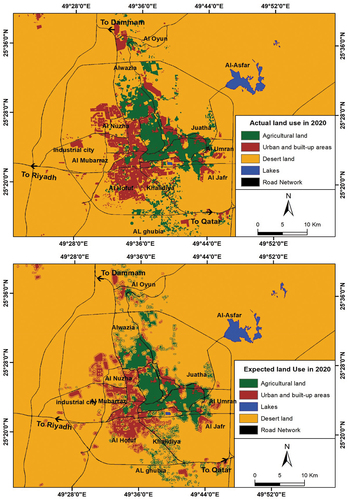
Table 9. A comparison between the statistics of the prediction map and the actual map for the year 2020 to evaluate the accuracy of the model.
3.3. Model validation
We did not just verify the accuracy of the model by comparing the areas of the different types of land uses in the prediction map for the year 2020 and their analogies to the actual land use map for the same year as shown. The Kappa value shows the agreement between the actual and reference map (equal to an agreement of chance), and the upper and lower bounds for kappa are 1.00 (occurs when there is total agreement) and −1.00 (represents agreement less than chance) (Congalton, Citation1991).
The “Validate” tool was used in the IDRISI program to verify the accuracy of the model, which showed very high accuracy for the various Kappa coefficients () and () where the value of the coefficient Kno equals (0.9421), the Klocation coefficient equals (0.8734), the KlocationStrata coefficient equals (0.8734), and the coefficient of Kstandard equals (0.8091), after checking the accuracy of the model and using kappa coefficients, we were confident to use the model to predict land uses for the years 2030 and 2050.
Figure 18. Kappa parameters from the comparison of the simulated LULC map and the reference map.
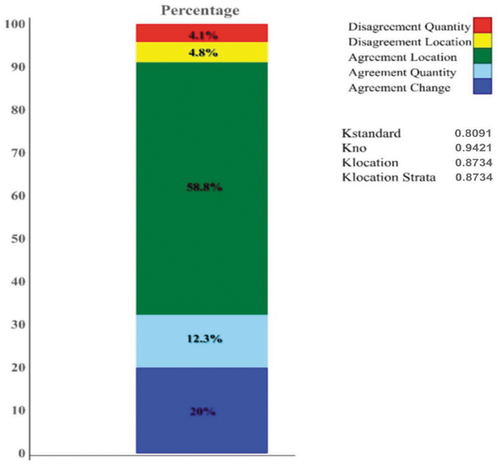
Table 10. Kappa indicators for evaluating the accuracy of a prediction model.
According to (Zadbagher et al., Citation2018) a model is valid if the overall Kappa score (Kstandard) exceeds 70% or (0.7), a Kstandard score near 90% is a very strong indicator of overall accuracy and model performance, and the remaining K scores, which all exceed 85%, that there are almost no errors or quantification and a very small location between the predicted and actual land cover map for the year 2020, and therefore the simulation has a strong ability to predict both the amount and locations of change.
3.4. Predicting the future of land uses/land cover for the years 2030 and 2050
Creating an accurate simulation of future land use/land cover prediction is one of the most important challenges in urban studies involving spatial modeling (Aburas et al., Citation2017), and future land use/land cover prediction is simulated using the Markov model (Balzter, Citation2000). The CA-Markov model has been used on the layers of land use/land cover for the years 2013 and 2020, represented by agricultural lands, urban mass, desert areas, water, and roads. The value of the time interval between the two images was adjusted to 7 years, indicating the difference of years between the land cover in both images, and the number of years after the second image was set to 10, indicating the difference of years between 2020 and 2030. This is to be able to predict the land use/cover map for the years 2030 and 2050, and in this context, the transition probability matrix, () and the transition areas matrix, () and appropriate maps for the transition from land use/land cover for the years 2013–2020 were obtained. The cellular automata model – Markov (CA-Markov) was implemented and the number of cycles was set to be 10, 30 equals to the number of years to be predicted, and a simulation map was obtained for the years 2030 and 2050, assuming that the rates of development of all different types of land use/land cover are maintained.
Table 11. Matrix of the transition probability between different land use/land cover during the period 2020–2030.
Table 12. Matrix of transition values (number of Pixels) for different land use/land cover during the period 2020–2030.
3.4.1. Predicting the future of land uses/land cover in 2030
The CA-Markov model has been widely used in predicting land-use/land cover changes, the CA-Markov model chain generates a transition probability matrix, while cellular automation controls the evolution and changes in cells (Chang & Chang, Citation2006; Kamusoko et al., Citation2009), and it is clear from the and that the land uses/land cover of the Al-Hassa Oasis in the year 2030 vary among themselves in terms of the amount of change expected for each type of different land uses/land cover, either increasing or decreasing it in the year 2020.
Figure 19. Map of future land uses/land cover of Al-Hassa Oasis: (a) in 2030, (b) in 2050 using CA-Markov within IDRISI selva v.17.0 program.
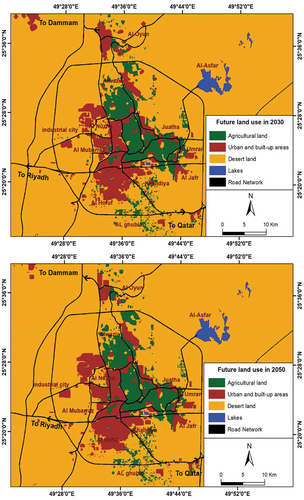
Figure 20. Losses and gains between land use/land cover from 2020 to 2030.
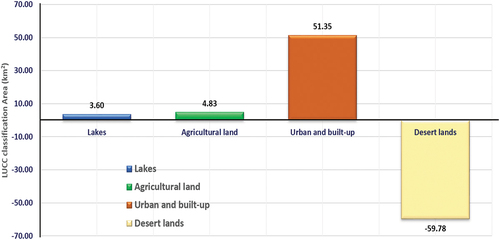
Table 13. The expected areas for each type of land use/land cover in 2030 for Al-Hassa Oasis compared to 2020.
Where we find that the urban mass is the most likely type in terms of area increase, as the expected increase in the urban mass area in 2030 compared to what it was in 2020 is 51.35 km2, to record a total area of 217.97 km2 instead of 166.62 km2 in 2020.
3.4.2. Predicting the future of land uses/land cover for the year 2050
The future land uses/land cover prediction model contributes to understanding future changes in land use and developing the right policies to support the growth of a sustainable city (Yu & Du, Citation2011). It is clear from and that the land uses/land cover of the Al-Hassa Oasis in 2050 compared to 2020 vary with each other in terms of the amount of change expected for each type of land uses/land cover, either by increasing or decreasing.
Figure 21. Losses and gains between land use/land cover from 2020 to 2050.
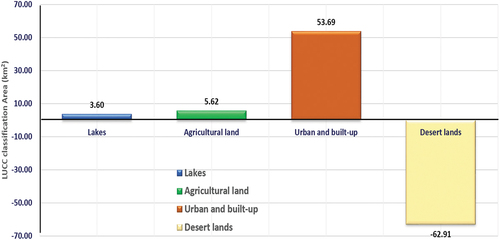
Table 14. The expected areas for each type of land use/land cover in 2050 for Al-Hassa Oasis compared to 2020.
4. Discussion
According to the authors’ knowledge and the reference inventory, this is the first study that aims to analyze the spatiotemporal dynamics of land use and urban growth and predict them in the future in the Al-Hassa Oasis in the Kingdom of Saudi Arabia. The results of this study can be the basis for several applications (Alqurashi & Kumar, Citation2014; Alsharif et al., Citation2022; Rahman, Citation2016) that have not been followed up so far due to the lack of spatiotemporal data over long historical periods (Abdelkarim et al., Citation2022). The study monitored and predicted spatial and temporal land use changes in Al-Hassa Oasis, Saudi Arabia, using land cover maps for the years 1988, 2000, 2013, 2020. LULC maps were classified into four main categories: (Water, Agriculture, Desert lands, and Desert) through the supervised classification method using the maximum likelihood classifier (MLC) method, Maximum likelihood classifier (MLC), it is a robust and popular supervised classification algorithm, to derive mapping rules for all other pixels into the class values (Dey et al., Citation2021; Kafy et al., Citation2021; Wang et al., Citation2021).
The maximum likelihood classifier (MLC) method was used as a supervised classification algorithm to super control classification coefficients. Training areas were extracted to classify green and water from Landsat images using NDVI and NDWI indicators, respectively. The classified image was compared with ground fact data to verify and calculate the accuracy of the classification. The accuracy confusion matrices showed that the overall accuracy was 91.23%, 93.65%, 95.32%, and 98.66% and the Kappa coefficients were 89.64, 92.41, 93.66, and 96.98 for the four Landsat images in 1989, 2002, 2013, and 2021, respectively. These statistics reflect that the different ranked maps meet the minimum recommended overall accuracy of 85%. They also show that there is a remarkable symmetry between the reference data and the land use/land cover classification according to the selected indices (Foody, Citation2002). These results are consistent with the results obtained by (Abdallah et al., Citation2019; Rahman et al., Citation2017; Salih, Citation2018).
The LCM tool was applied to analyze the LULC change of Al-Hassa Oasis during the period 1988–2020. The “Validate” tool was used in the Idrissi software to check the accuracy of the model, which ultimately showed very high accuracy for different Kappa coefficients. The results revealed significant changes in the map of land use for the Oasis – where the urban areas increased by 63.5%, equivalent to about 105.7 km2 during that period, which is about 2.7 times its area in 1988 AD, from 60.89 km2 in 1988 to about 166.6 km2 in 2020. The urban increase was about 105.71 km2, and the area of the increase was distributed over 32 years, with a growth rate of 3.2%. The largest percentage of these changes was at the expense of desert areas with 93.33% of their area. This significant increase can be explained by the fact that there is a positive relationship between urban growth and oil discovery in the Kingdom of Saudi Arabia between 1974 and 2019, especially in the eastern region, which includes the study area. This has been accompanied by major shifts in infrastructure and urbanization. Al-Hassa Oasis has gotten the largest share of laborers due to its proximity to the oil areas. This was confirmed by the population growth data in Al-Hassa Oasis, which increased to 61.9% in the official census of the General Authority for Statistics during the period between 1974 and 2020 (Saudi General Authority for Statistics [SGS], Citation2020), as the total population of the Kingdom of Saudi Arabia witnessed a huge increase by 500% between 1974 and 2019 (Saudi General Authority for Statistics, Citation2020). These families who came to Al-Hassa for work began to pump new population, and this population growth witnessed by Al-Hassa Oasis played a major role in the desert urbanization. There is no doubt that population growth plays an important role in expanding the urban area (Singh et al., Citation2015; Ye & Bai, Citation2008). It is expected that this urban transformation will continue in the composite land use map during the coming decades, and it is expected that the city’s population will reach 1,563,541 people by 2050 (SGS, Citation2020). This urban transformation in the land use map will not only lead to an increase in energy consumption for the population and an increase in burdens the new infrastructure and utilities, but it will also create more environmental challenges and problems, especially air, soil, and water pollution, constricting the agricultural lands in the east of the Oasis, lack of groundwater, well water depletion, rising wastewater, and soil salinity. Accordingly, sustainable desert urban life has been affected, and thus nature and resource flows are diminished. In similar studies conducted elsewhere, the change in land patterns and urban growth across desert areas led to many environmental challenges, such as water scarcity along with environmental degradation and groundwater shortage. Studies (Mansour et al., Citation2022). The agricultural land increased during the study period by 6.6%, equivalent to about 10.7 km2. The largest percentage of these changes was at the expense of the desert areas around the four oases by 98.62%, in addition to the agricultural expansion towards the south of the Oasis. However, this increase is considered a deceptive and unreal increase in its entirety, as it is an increase in new places away from the old oasis, which has already lost about 3.3% of the agricultural land during the study period, specifically during the period 1988–2000. These results are consistent with the results obtained by (Abdelatti et al., Citation2017; Almadini et al., Citation2019; Alqarni et al., Citation2018). The land that turned into water marshes reached an area of 8.7 km2, with an increase of about 41.7%. The largest percentage of these changes was at the expense of desert areas, with an increase in the Sabkhat Al-Asfar area by almost 100% northeast of the Oasis.
To predict the dynamics of LULC change for Al-Hassa Oasis for the years 2030 and 2050, we used the Cellular Automata-Markov Model (CA-Markov) and the Cellular Automata (CA). The model has been used efficiently in recent studies to simulate spatial and temporal changes in land uses due to its combination of dynamic spatial projections and probabilistic theories (Aneesha Satya et al., Citation2020; Huang et al., Citation2020; Wang & Zhang, Citation2001; Zheng et al., Citation2015); The projected LULC maps for 2030 and 2050 indicate that these patterns of arid lands that change into built-up areas and agricultural lands will continue over the next 30 years due to urban growth and the development of agricultural activities. We find that the urban mass is the most likely type in terms of the area increase, as the expected increase in the urban area reached 51.35 km2 and 53.69 km2, respectively, for 2030 & 2050 AD. This is in line with the expected population growth scenarios of the General Authority for Statistics during 2030–2050, while the expected increase in agricultural lands for the years 2030–2050 AD was 4.83 km2 and 5.62 km2.
The stage of classifying the satellite images of the Al-Hassa region faced major spectral problems related to: First, the overlap of the spectral range between the phenomena of different land uses, such as the overlap of the spectral range between agricultural lands and water, and the overlap of the spectral range between urban areas and some parts of the desert regions dispersing the spectral range. Second, the dispersion of the spectral range of one of the land use phenomena, such as desert lands, in which the spectral range is dispersed in a large extent due to the different geomorphological forms and surface geological compositions. These reasons made it difficult to derive the phenomena of land uses in separate categories.
Therefore, various indicators such as the NDVI and NDWI were used and multiple treatments were performed to separate the anomalous spectral fingerprints from the different categories and further improve the classification categories, which increases their accuracy and reliability. Many studies have encountered complexity in the process of classification and mapping in arid and semi-arid environments and have overcome these challenges by using various specified image approaches. These methods have mitigated errors that are wrongly classified and better distinguished between urban and arid areas as in the studies of (Abdallah et al., Citation2019; Alsharif et al., Citation2022). Another common problem found when mapping land cover for dry and semi-arid areas is the mixed pixel and spectral confusion between impervious surfaces and bare soil. This study also faced another challenge, as the study of the change detection in the phenomena of land use relies on a specific time period and a number of satellite visualizations suitable and selected for the study area during this time range in a way that achieves the best possible results. The longer the time span of the study and the greater the number of studied satellite visualizations, the more accurate the final results of the study will be. Satellite visuals of the study area were chosen with semi-rigid intervals starting from the available satellite visuals suitable for the study area in 1988 until the satellite visualization of the study year in 2020, with the exclusion of distorted or inappropriate ones, whether due to problems in the sensor itself, as in the ETM sensor, or problems related to weather conditions, as in 1990 and 2010, so they were excluded.
Even though the Cellular Automata-Markov Model (CA-Markov) and the Cellular Automata (CA) Model can be used as an effective tool for mapping and monitoring spatial and temporal changes and predicting LULC. Generally, the weaknesses inherent in these methods are that they do not take into account the environmental, social, or demographic conditions (Yang et al., Citation2022), for example, combining (CA-Markov), (MCE), and (AHP), which would improve the display of dynamic growth in urban areas and land use changes (Wang et al., Citation2022). An investigation into urban growth and land use change will be conducted later, focusing on combining the CA-Markov, Multi-Criteria Evaluation (MCE), and Analytical Hierarchy Process (AHP). Placing transition rules in the form of suitable maps based on the MCE allows us to consider different components commonly used in land use planning and decision-making such as changes in population density, terrain (slope), proximity to network routes, proximity to central business area water resources, restricted military zones, and oil. The Analytical Hierarchy Process (AHP) is an easy-to-use, powerful, and useful decision-making tool that allows collective decision makers to compare and select options as part of collective decision-making.
5. Conclusions
The study monitored and predicted spatial and temporal land use changes in Al-Hassa Oasis, Saudi Arabia using land cover maps for the years 1988, 2000, 2013, and 2020 by integrating the Cellular Automata-Markov Model (CA-Markov) and the Cellular Automata (CA). LULC maps were classified into four main categories (Water, Agriculture, Desert lands, and Desert). Through the supervised classification method using the Maximum Likelihood Classifier (MLC) method, the training areas were extracted to classify the green and water from Landsat images using NDVI and NDWI indices, respectively. A high classification accuracy result was achieved to ensure more reliability in the results. This was to understand the LULC changes in Al-Hassa Oasis comprehensively. The LCM tool was applied to analyze the LULC change of the Al-Hassa Oasis during the period 1988–2020. The “Validate” tool was used in the Idrissi software to check the accuracy of the model, which ultimately showed very high accuracy for different Kappa coefficients. The results revealed significant changes in the map of land uses for the Oasis – where the urban areas increased by 63.5%, equivalent to about 105.7 km2 during that period, which is about 2.7 times its area in 1988 AD, from 60.89 km2 in 1988 to about 166.6 km2 in 2020. The urban increase was about 105.71 km2, and the area of the increase was distributed over 32 years, with a growth rate of 3.2%. The largest percentage of these changes was at the expense of desert areas with 93.33% of their area. The agricultural lands increased during the study period by about 6.6%, equivalent to about 10.7 km2. The largest percentage of these changes included the desert areas around the four oases by 98.62%, in addition to the agricultural expansion towards the south of the oasis. However, this increase is considered a deceptive and unreal increase in its entirety, as it is an increase in new places away from the old oasis, which already lost about 3.3% of agricultural land during the study period. The land that turned into water marshes reached an area of 8.7 km2, with an increase of about 41.7%. The largest percentage of these changes was at the expense of desert areas, with an increase in the Sabkhat Al-Asfar area by almost 100% northeast of the Oasis. To predict the dynamics of LULC change for Al-Hassa Oasis for the years 2030 and 2050, we used the Cellular Automata-Markov Model (CA-Markov) and the Cellular Automata (CA). The model has been used efficiently in recent studies to simulate spatial and temporal changes in land uses due to its combination of dynamic spatial projections and probabilistic theories. The projected LULC maps for 2030 and 2050 indicate that these patterns of arid lands that change into built-up areas and agricultural lands will continue over the next 30 years due to urban growth and the development of agricultural activities. We find that the urban mass is the most likely type in terms of the area increase, as the expected increase in the urban area reached in 2030 & 2050 AD51.35 km2 and 53.69 km2, respectively. This is in line with the expected population growth scenarios of the General Authority for Statistics during 2030–2050, while the expected increase in agricultural lands for the years 2030–2050 AD was 4.83 km2 and 5.62 km2. Environmental sustainability is one of the necessary requirements in the map of future urban land uses in 2030 AD and 2050 AD in Al-Hassa Oasis. This will only be achieved through preserving agricultural lands east of the Oasis, controlling urban expansions, preserving valleys and environmental rehabilitation for them, benefiting from their water and resources, and stopping the drilling of wells randomly in a way that contributes to the preservation of water, food, and housing security in order to establish the rules for sustainable urban development and reduce the negative environmental impacts. The results obtained from this study provide information to assist decision makers to undertake effective practices for future planning and management of urban land growth, especially in the vision of the Kingdom of Saudi Arabia 2030 for various sectors.
Disclosure statement
No potential conflict of interest was reported by the author.
References
- Abdallah, S., Elmohemen, M. A., Hemdan, S., & Ibrahem, K. (2019). Assessment of land use/land cover changes induced by Jizan Dam, Saudi Arabia, and their effect on soil organic carbon. Arabian Journal of Geosciences, 12(11), 350. https://doi.org/10.1007/s12517-019-4474-1
- Abdelatti, H., Elhadary, Y., & Babiker, A. A. (2017). Nature and trend of urban growth in Saudi Arabia: The case of Al-Ahsa Province – Eastern Region. Resources and Environment, 7(3), 69–80. https://doi.org/10.5923/j.re.20170703.02
- Abd El Karim, A., Alogayell, H. M., Alkadi, I. I., & Youssef, I. (2020). Mapping of GIS-Land use suitability in the rural–urban continuum between Ar Riyadh and Al Kharj Cities, KSA based on the integrating GIS multi criteria decision analysis and analytic hierarchy process. Environments, 7(10), 1–29. MDPI. https://doi.org/10.3390/environments7100075
- Abdelkarim, A., Alogayell, H. M., Alkadi, I. I., & Youssef, I. (2022). Spatial–temporal prediction model for land cover of the rural–urban continuum axis between Ar-Riyadh and Al-Kharj cities in KSA in the year of 2030 using the integration of CA–Markov model, GIS-MCA, and AHP. Applied Geomatics, 14(3), 501–525. https://doi.org/10.1007/s12518-022-00448-w
- Aburas, M. M., Ho, Y. M., Ramli, M. F., & Ash’aari, Z. H. (2016). The simulation and prediction of spatio-temporal urban growth trends using cellular automata models: A review. International Journal of Applied Earth Observation and Geoinformation, 52, 380–389. https://doi.org/10.1016/j.jag.2016.07.007
- Aburas, M. M., Ho, Y. M., Ramli, M. F., & Ash’aari, Z. H. (2017). Improving the capability of an integrated CA-Markov model to simulate spatio-temporal urban growth trends using an analytical hierarchy process and frequency ratio. International Journal of Applied Earth Observation and Geoinformation, 59, 65–78. https://doi.org/10.1016/j.jag.2017.03.006
- Adhikari, S., & Southworth, J. (2012). Simulating forest cover changes of Bannerghatta National Park on a CA-Markov model. Remote Sens, 4(10), 3215–3243. https://doi.org/10.3390/rs4103215
- Al-Alola, S. S., Alogayell, H. M., Alkadi, M., II, Mohamed, S. A., & Ismail, I. Y. (2021). Recognition and prediction of land dynamics and its associated impacts in Al-Qurayyat City and along Al-Shamal train pathway in Saudi Arabia. Sustainability, 13(17), 9913. https://doi.org/10.3390/su13179913
- Alharthi, A., El-Sheikh, M. A., Elhag, M., Alatar, A. A., Abbadi, G. A., Abdel-Salam, E. M., Arif, I. A., Baeshen, A. A., & Eid, E. M. (2020). Remote sensing of 10 years changes in the vegetation cover of the northwestern coastal land of Red Sea, Saudi Arabia. Saudi Journal of Biological Sciences, 27(11), 3169–3179. https://doi.org/10.1016/j.sjbs.2020.07.021
- Almadini, A. M., Hassaballa, A. A., & Dewan, A. (2019). Depicting changes in land surface cover at Al-Hassa oasis of Saudi Arabia using remote sensing and GIS techniques. PLoS One, 14(11), e0221115. https://doi.org/10.1371/journal.pone.0221115
- Alqarni, S., Babiker, A., & Salih, A. (2018). Detection, mapping and assessment change in urban and croplands area in Al-Hassa Oasis, eastern region in Saudi Arabia using remote sensing and geographic information system. Journal of Geographic Information System, 10(6), 659–685. https://doi.org/10.4236/jgis.2018.106034
- Alqurashi, A. F., & Kumar, L. (2014). Land use and land cover change detection in the Saudi Arabian Desert cities of Makkah and Al-Taif using satellite data. Advances in Remote Sensing, 3(3), 106–119. https://doi.org/10.4236/ars.2014.33009
- Alqurashi, A. F., & Kumar, L. (2016). Spatiotemporal patterns of urban change and associated environmental impacts in five Saudi Arabian cities: A case study using remote sensing data. Habitat International, 58, 75–88. https://doi.org/10.1016/j.habitatint.2016.10.001
- Alsharif, M., Alzandi, A. A., Shrahily, R., & Mobarak, B. (2022). Land use land cover change analysis for urban growth prediction using Landsat satellite data and Markov Chain Model for Al Baha Region Saudi Arabia. Forests, 13(10), 1530. https://doi.org/10.3390/f13101530
- Aneesha Satya, B., Shashi, M., & Deva, P. (2020). Future land use land cover scenario simulation using open source GIS for the city of Warangal, Telangana, India. Applied Geomatics, 12(3), 281–290. https://doi.org/10.1007/s12518-020-00298-4
- Appiah, D. O., Forkuo, E. K., Bugri, J. T., & Apreku, T. O. (2017). Geospatial analysis of land use and land cover transitions from 1986–2014 in a Peri-Urban Ghana. Geosciences, 7(4), 1–23. MPDI. https://doi.org/10.3390/geosciences7040125
- Balzter, H. (2000). Markov chain models for vegetation dynamics. Ecological Modelling, 126(2–3), 139–154. https://doi.org/10.1016/S0304-3800(00)00262-3
- Batty, M., & Xie, Y. (1994). From cells to cities. Environment and Planning B: Planning & Design, 21(7), 31–48. https://doi.org/10.1068/b21S031
- Biro Turk, K. G., & Aljughaiman, A. S. (2020). Land use/land cover assessment as related to soil and irrigation water salinity over an oasis in arid environment. Open Geosciences, 12(1), 220–231. https://doi.org/10.1515/geo-2020-0103
- Chang, C. L., & Chang, J. C. (2006). Markov model and cellular automata for vegetation. Journal of Geographical Research, 45, 45–57.
- Chaplot, V., Ie Brozec, E. C., Silvera, N., & Valentin, C. (2005). Spatial and temporal assessment of linear erosion in catchments under sloping lands of northern Laos. Catena, 63(2–3), 167–184. https://doi.org/10.1016/j.catena.2005.06.003
- Chen, Y., Li, X., Liu, X., Ai, B., & Li, S. (2016). Capturing the varying effects of driving forces over time for the simulation of urban growth by using survival analysis and cellular automata. Landscape and Urban Planning, 152, 59–71. https://doi.org/10.1016/j.landurbplan.2016.03.011
- Chim, K., Tunnicliffe, J., Shamseldin, A., & Ota, T. (2019). Land use change detection and prediction in upper Siem Reap River, Cambodia. Hydrology, 6(3), 1–23. MPDI. https://doi.org/10.3390/hydrology6030064
- Chouari, W. (2021). Wetland land cover change detection using multitemporal Landsat data: A case study of the Al-Asfar wetland, Kingdom of Saudi Arabia. Arabian Journal of Geosciences, 14(6), 523. https://doi.org/10.1007/s12517-021-06815-y
- Clarke, K. C., & Gaydos, L. J. (1988). Loose-coupling a cellular automaton model and GIS: Long-term urban growth prediction for San Francisco and Washington/Baltimore. International Journal of Geographical Information Science, 12(7), 699–714. https://doi.org/10.1080/136588198241617
- Clarke, K. C., Hoppen, S., & Gaydos, L. (1997). A self-modifying cellular automaton model of historical urbanization in the San Francisco Bay Area. Environment and Planning B: Planning & Design, 24(2), 247–261. https://doi.org/10.1068/b240247
- Congalton, R. G. (1991). A review of assessing the accuracy of classifications of remotely sensed data. Remote Sensing of Environment, 37(1), 35–46. https://doi.org/10.1016/0034-4257(91)90048-B
- Conoscenti, C., Angileri, S., Cappadonia, C., Rotigliano, E., Agnesi, V., & Märker, M. (2014). Gully erosion susceptibility assessment by means of GIS-based logistic regression: A case of Sicily (Italy). Geomorphology, 204, 399–411. https://doi.org/10.1016/j.geomorph.2013.08.021
- Coppedge, B. R., Engle, D. M., & Fuhlendorf, S. D. (2007). Markov models of land cover dynamics in a southern Great Plains grassland region. Landscape Ecology, 22(9), 1383–1393. https://doi.org/10.1007/s10980-007-9116-4
- Dey, N. N., Al Rakib, A., Al Kafy, A. A., & Raikwar, V. (2021). Geospatial modelling of changes in land use/land cover dynamics using multi-layer perception Markov chain model in Rajshahi City, Bangladesh. Environmental Challenges, 4, 100148. https://doi.org/10.1016/j.envc.2021.100148
- Dimitrios, G., Elias, S., Ioannis, C., & Sotirios, K. (2019). Incorporating density in spatiotemporal land use/cover change patterns: The case of Attica, Greece. Remote Sensing, 10(7), 1–18. MPDI. https://doi.org/10.3390/rs10071034
- Eastman, J. R. (2015). TerrSet manual. TerrSet Vers, 18, 1–390.
- Faichia, C., Tong, Z., Zhang, J., Liu, X., Kazuva, E., Ullah, K., & Al-Shaibah, B. (2020). Using RS data-based CA–Markov Model for dynamic simulation of historical and future LUCC in Vientiane, Laos. Sustainability, 12(20), 1–20. MDPI. https://doi.org/10.3390/su12208410
- Foody, G. M. (2002). Status of land cover classification accuracy assessment. Remote Sensing of Environment, 80(1), 185–201. https://doi.org/10.1016/S0034-4257(01)00295-4
- Fung, T., & Ledrew, E. (1988). The determination of optimal threshold levels for change detection using various accuracy indices. Photogrammetric Engineering and Remote Sensing, 54, 1449–1454.
- Guan, D., Zhao, Z., & Tan, J. (2019). Dynamic simulation of land use change based on logistic-CA-Markov and WLC-CA-Markov models: A case study in three Gorges reservoir area of Chongqing, China. Environmental Science and Pollution Research, 26(20), 20669–20688. https://doi.org/10.1007/s11356-019-05127-9
- He, J., Huang, J., & Li, C. (2017). The evaluation for the impact of land use change on habitat quality: A joint contribution of cellular automata scenario simulation and habitat quality assessment model. Ecological Modelling, 366, 58–67. https://doi.org/10.1016/j.ecolmodel.2017.10.001
- Holtgrave, A. K., Röder, N., Ackermann, A., Erasmi, S., & Kleinschmit, B. (2020). Comparing Sentinel-1 and -2 data and indices for agricultural land use monitoring. Remote Sensing, 12(18), 2919. https://doi.org/10.3390/rs12182919
- Huang, Y., Yang, B., Wang, M., Liu, B., & Yang, X. (2020). Analysis of the future land cover change in Beijing using CA–Markov chain model. Environmental Earth Sciences, 79(2), 60. https://doi.org/10.1007/s12665-019-8785-z
- Islam, K., Jashimuddin, M., Nath, B., & Nath, T. K. (2018). Land use classification and change detection by using multi-temporal remotely sensed imagery: The case of Chunati Wildlife Sanctuary, Bangladesh. The Egyptian Journal of Remote Sensing and Space Sciences, 21(1), 37–47. https://doi.org/10.1016/j.ejrs.2016.12.005
- Jensen, J. R., & Cowen, D. C. (1999). Remote sensing of urban/suburban infrastructure and socio-economic attributes. Photogrammetric Engineering and Remote Sensing, 65, 611–622. https://doi.org/10.1002/9780470979587.ch22
- Kafy, A. A., Naim, M. D. N. H., Subramanyam, G., Faisal, A. A., Ahmed, N. U., Al Rakib, A., Kona, M. A., & Sattar, G. S. (2021). Cellular Automata approach in dynamic modelling of land cover changes using RapidEye images in Dhaka, Bangladesh. Environmental Challenges, 4, 100084. https://doi.org/10.1016/J.ENVC.2021.100084
- Kamusoko, C., Aniya, M., Adi, B., & Manjoro, M. (2009). Rural sustainability under threat in Zimbabwe – simulation of future land use/cover changes in the Bindura district based on the Markov-cellular automata model. Applied Geography, 29(3), 435–447. https://doi.org/10.1016/j.apgeog.2008.10.002
- Khawaldah, H. (2016). A prediction of future land use/land cover in Amman area using GIS-Based Markov Model and remote sensing. Journal of Geographic Information System, 8(3), 412–427. https://doi.org/10.4236/jgis.2016.83035
- Kheir, R. B., Wilson, J., & Deng, Y. (2007). Use of terrain variables for mapping gully erosion susceptibility in Lebanon. Earth Surface Processes and Landforms, 32(12), 1770–1782. https://doi.org/10.1002/esp.1501
- Kuang, W. H. (2011). Simulating dynamic urban expansion at regional scale in Beijing-Tianjin-Tangshan metropolitan area. Journal of Geographical Sciences, 21(2), 317–330. https://doi.org/10.1007/s11442-011-0847-4
- Li, X., Chen, Y., Liu, X., Xu, X., & Chen, G. (2017). Experiences and issues of using cellular automata for assisting urban and regional planning in China. International Journal of Geographical Information Science, 31(8), 1606–1629. https://doi.org/10.1080/13658816.2017.1301457
- Mansour, S., Alahmadi, M., Atkinson, P. M., & Dewan, A. (2022). Forecasting of built-up land expansion in a desert urban environment. Remote Sensing, 14(9), 2037. https://doi.org/10.3390/rs14092037
- Märker, M., Pelacani, S., & Schröder, B. (2011). A functional entity approach to predict soil erosion processes in a small plio-pleistocene Mediterranean catchment in northern Chianti, Italy. Geomorphology, 125(4), 530–540. https://doi.org/10.1016/j.geomorph.2010.10.022
- Megahed, Y., Cabral, P., Silva, J., & Caetano, M. (2015). Land cover mapping analysis and urban growth modelling using remote sensing techniques in Greater Cairo region—Egypt. ISPRS International Journal of Geo-Information, 4(3), 1750–1769. https://doi.org/10.3390/ijgi4031750
- Mishra, V. N., Rai, P. K., & Mohan, K. (2014). Prediction of land use changes based on land change modeler (LCM) using remote sensing: A case study of Muzaffarpur (Bihar), India. Journal of the Geographical Institute: Jovan Cvijic SASA, 64(1), 111–127. https://doi.org/10.2298/IJGI1401111M
- Mishra, P. K., Rai, A., & Rai, S. C. (2020). Land use and land cover change detection using geospatial techniques in the Sikkim Himalaya, India. The Egyptian Journal of Remote Sensing and Space Sciences, 23(2), 133–143. https://doi.org/10.1016/j.ejrs.2019.02.001
- Moghadam, H. S., & Helbich, M. (2013). Spatiotemporal urbanization processes in the megacity of Mumbai, India: A Markov chains-cellular automata urban growth model. Applied Geography, 40, 140–149. https://doi.org/10.1016/j.apgeog.2013.01.009
- Mohamed, S., & El-Reay, M. E. (2018). Assessment, prediction and future simulation of land cover dynamics using remote sensing and GIS techniques. Assiut University Bulletin for Environmental Researches, 21(2), 1–13.
- Mondal, M. S., Sharma, N., Kappas, M., & Garg, P. K. (2019). CA-Markov modeling of land use land cover dynamics and sensitivity analysis to identify sensitive parameter(s). International Archives of the Photogrammetry Remote Sensing and Spatial Information Sciences, 13, 723–729. https://doi.org/10.5194/isprs-archives-XLII-2-W13-723-2019
- Nadoushan, M. A., Soffianian, A., & Alebrahim, A. (2015). Modeling land use/cover changes by the combination of Markov chain and cellular automata Markov (CA-Markov) models. Journal of Earth, Environment and Health Sciences, 1(1), 16–21. https://www.ijeehs.org/text.asp?2015/1/1/16/159922
- Omar, Q., Ahamad, M., Hussin, W., Samat, N., & Ahmad, Z., & Markov, CA. (2013). Multi regression, and multiple decision making for modeling historical changes in Kirkuk City. Journal of the Indian Society of Remote Sensing, 42(1), 165–178. https://doi.org/10.1007/s12524-013-0311-2
- Ozturk, D. (2015). Urban growth simulation of Atakum (Samsun, Turkey) using cellular automata-Markov chain and multi-layer perceptron-Markov Chain Models. Remote Sensing, 7(5), 5918–5950. https://doi.org/10.3390/rs70505918
- Pakawan, C., & Saowanee, W. (2019). Predicting urban expansion and urban land use changes in Nakhon Ratchasima City using a CA-Markov Model under two different scenarios. Land, 8(9), 1–16. MPDI. https://doi.org/10.3390/land8090140
- Patino, J. E., & Duque, J. C. (2013). A review of regional science applications of satellite remote sensing in urban settings, computers. Environment and Urban Systems, 37, 1–17. https://doi.org/10.1016/j.compenvurbsys.2012.06.003
- Piekarczyk, J. (2014). Application of remote sensing in agriculture. Geoinformatica Polonica, 13(1), 1. https://doi.org/10.2478/gein-2014-0007
- Pinto, C., Jing, X., & Leigh, L. (2020). Evaluation analysis of Landsat Level-1 and Level-2 data products using in situ measurements. Remote Sensing, 12(6), 1–27. MDPI. https://doi.org/10.3390/rs12162597
- Pourghasemi, H. R., Yousefi, S., Kornejady, A., & Cerdà, A. (2017). Performance assessment of individual and ensemble data-mining techniques for gully erosion modeling. The Science of the Total Environment, 31(609), 764–775. https://doi.org/10.1016/j.scitotenv.2017.07.198
- Rahman, M. T. (2016). Detection of land use/land cover changes and urban sprawl in Al-Khobar, Saudi Arabia: An analysis of multi-temporal remote sensing data. ISPRS International Journal of Geo-Information, 5(2), 15. https://doi.org/10.3390/ijgi5020015
- Rahman, M. T., Aldosary, A. S., & Mortoja, M. G. (2017). Modeling future land cover changes and their effects on the land surface temperatures in the Saudi Arabian eastern coastal city of Dammam. Land, 6(2), 36. https://doi.org/10.3390/land6020036
- Rezazadeh, R., & Mirahmadi, M. (2009). A cellular automata is a new method to simulate urban growth. Journal of Educational Technology, 3(4), 9. https://doi.org/10.22061/tej.2009.1335
- Roy, H. G., Dennis, M. F., & Emsellem, K. (2014). Predicting land cover change in a Mediterranean catchment at different time scales. In Computational Science and Its Applications—ICCSA (Vol. 8582, pp. 315–330). Springer International Publishing. https://doi.org/10.1007/978-3-319-09147-1_23
- Ruben, B., Zhang, K., Dong, Z., & Jun, X. (2020). Analysis and projection of land-use/land-cover dynamics through scenario-based simulations using the CA-Markov Model: A case study in Guanting Reservoir Basin, China. Sustainability, 12(9), 1–20. MDPI. https://doi.org/10.3390/su12093747
- Saadat, H., Adamowski, J., Bonnell, R., Sharifi, F., Namdar, M., & Ale-Ebrahim, S. (2011). Land use and land cover classification over a large area in Iran based on single date analysis of satellite imagery. ISPRS Journal of Photogrammetry and Remote Sensing, 66(5), 608–616. https://doi.org/10.1016/j.isprsjprs.2011.04.001
- Salih, A. (2018). Classification and mapping of land cover types and attributes in Al-Ahsaa Oasis, eastern region, Saudi Arabia using Landsat-7 data. Journal of Remote Sensing & GIS, 7(01), 228. https://doi.org/10.4172/2469-4134.1000228
- Sang, L., Zhang, C., Yang, J., Zhu, D., & Yun, W. (2011). Simulation of land use spatial pattern of towns and villages based on CA–Markov model. Mathematical and Computer Modelling, 54(3–4), 938–943. https://doi.org/10.1016/j.mcm.2010.11.019
- Santé, I., García, A. M., Miranda, D., & Crecente, R. (2010). Cellular automata models for the simulation of real-world urban processes: A review and analysis. Landscape and Urban Planning, 96(2), 108–220. https://doi.org/10.1016/j.landurbplan.2010.03.001
- Saudi General Authority for Statistics. (2020). Atlas of population and housing: Maps distributions of preliminary results 2010. https://www.stats.gov.sa/sites/default/files/en-dmaps2010_0_0.pdf
- Shooshtari, S. J., & Gholamalifard, M. (2015). Scenario-based land cover change modeling and its implications for landscape pattern analysis in the Neka Watershed, Iran. RemoteSensing Applications Society and Environment, 1, 1–19. https://doi.org/10.1016/j.rsase.2015.05.001
- Shrahily, R. Y., Alsharif, M. A., Mobarak, B. A., & Alzandi, A. A. (2022). Land cover mapping using GIS and remote sensing databases for Al Baha Region Saudi Arabia. Applied Science, 12(16), 8115. https://doi.org/10.3390/app12168115
- Singh, S. K., Mustak, S., Srivastava, P. K., Szabó, S., & Islam, T. (2015). Predicting spatial and decadal LULC changes through Cellular Automata Markov Chain Models using earth observation datasets and geo-information. Environmental Processes, 2(1), 61–78. https://doi.org/10.1007/s40710-015-0062-x
- Sohl, T. L., Wimberly, M. C., Radeloff, V. C., Theobald, D. M., & Sleeter, B. M. (2016). Divergent projections of future land use in the United States arising from different models and scenarios. Ecological Modelling, 337, 281–297. https://doi.org/10.1016/j.ecolmodel.2016.07.016
- Solomon, H., Woldeamlak, B., Jan, N., & James, L. (2019). Analysing past land use land cover change and CA-Markov-based future modelling in the Middle Suluh Valley, Northern Ethiopia. Geocarto International, 35, 1–32. https://doi.org/10.1080/10106049.2018.1516241
- Subedi, P., Subedi, K., & Thapa, B. (2013). Application of a hybrid cellular automaton – Markov (CA-Markov) Model in land-use change prediction: A case study of Saddle Creek Drainage Basin, Florida. Applied Ecology and Environmental Sciences, 1(6), 126–132. https://doi.org/10.12691/aees-1-6-5
- Svoray, T., Michailov, E., Cohen, A., Rokah, L., & Sturm, A. (2012). Predicting gully initiation: Comparing data mining techniques, analytical hierarchy processes and the topographic threshold. Earth Surface Processes and Landforms, 37(6), 607–619. https://doi.org/10.1002/esp.2273
- Taubenböck, H., Wegmann, M., Roth, A., Mehl, H., & Dech, S. (2009). Urbanization in India - Spatiotemporal analysis using remote sensing data. Computers, Environment and Urban Systems, 33(3), 179–188. https://doi.org/10.1016/j.compenvurbsys.2008.09.003
- Taufik, A., Ahmad, S. S. S., & Ahmad, A. (2016). Classification of Landsat 8 Satellite data using NDVI thresholds. Journal of Telecommunication, Electronic and Computer Engineering (JTEC), 8, 4. http://journal.utem.edu.my/index.php/jtec/article/download/1168/671
- Tewolde, M. G., & Cabral, P. (2011). Urban sprawl analysis and modelling in Asmara, Eritrea. Remote Sensing, 3(10), 2148–2165. MDPI. https://doi.org/10.3390/rs3102148
- Tingting, X., Jay, G., & Giovanni, C. (2019). Simulation of urban expansion via integrating artificial neural network with Markov chain – cellular automata. International Journal of Geographical Information Science, 33(10), 1960–1983. https://doi.org/10.1080/13658816.2019.1600701
- Vanwalleghem, T., Van Den Eeckhaut, M., Poesen, J., Govers, G., & Deckers, J. (2008). Spatial analysis of factors controlling the presence of closed depressions and gullies under forest: Application of rare event logistic regression. Geomorphology, 95(3–4), 504–517. https://doi.org/10.1016/j.geomorph.2007.07.003
- Verburg, P. H., Schot, P. P., Dijst, M. J., & Veldkamp, A. (2004). Land use change modelling: Current practice and research priorities. GeoJournal, 61(4), 309–324. https://doi.org/10.1007/s10708-004-4946-y
- Wang, C., Huang, S., & Wang, J. (2022). Spatio-Temporal dynamic evolution and simulation of Dike-Pond landscape and ecosystem service value based on MCE-CA-Markov: A case study of Shunde, Foshan. Forests, 13(8), 1241. https://doi.org/10.3390/f13081241
- Wang, S. W., Munkhnasan, L., & Lee, W. K. (2021). Land use and land cover change detection and prediction in Bhutan’s high altitude city of Thimphu, using cellular automata and Markov chain. Environmental Challenges, 2, 100017. https://doi.org/10.1016/j.envc.2020.100017
- Wang, Y., & Zhang, X. (2001). A dynamic modeling approach to simulating socioeconomic effects on landscape changes. Ecological Modelling, 140(1–2), 141–162. https://doi.org/10.1016/S0304-3800(01)00262-9
- Ward, D. P., Murray, A. T., & Phinn, S. R. (2000). A stochastically constrained cellular model of urban growth. Computers, Environment and Urban Systems, 24(6), 539–558. https://doi.org/10.1016/S0198-9715(00)00008-9
- Weng, Q. (2002). Land use change analysis in the Zhujiang Delta of China using satellite remote sensing, GIS and stochastic modelling. Journal of Environmental Management, 64(3), 273–284. https://doi.org/10.1006/jema.2001.0509
- White, R., & Engelen, G. (2000). High-Resolution integrated modelling of the spatial dynamics of urban and regional systems. Computers, Environment and Urban Systems, 24(5), 383–400. https://doi.org/10.1016/S0198-9715(00)00012-0
- Wu, F. (1998). SimLand: A prototype to simulate land conversion through the integrated GIS and CA with AHP-Derived transition rules. International Journal of Geographical Information Science, 12(1), 63–82. https://doi.org/10.1080/136588198242012
- Wu, F. (2002). Calibration of stochastic cellular automata: The application to rural-urban land conversions. International Journal of Geographical Information Science, 16(8), 795–818. https://doi.org/10.1080/13658810210157769
- Yang, H. F., Zhong, X. N., Deng, S. Q., Nie, S. N., & Godron, M. (2022). Impact of LUCC on landscape pattern in the Yangtze River Basin during 2001–2019. Ecological Information, 69, 101631. https://doi.org/10.1016/j.ecoinf.2022.101631
- Ye, B., & Bai, Z. (2008). Simulating land use/cover changes of Nenjiang County based on CA-Markov model. Computer and Computing Technologies in Agriculture, 1, 321–329. https://doi.org/10.1007/978-0-387-77251-6_35
- Yu, N., Du, Q., Qingyun, D. (2011). Urban growth pattern modelling using logistic regression. Geospatial Information Science, 14(1), 62–67. https://doi.org/10.1007/s11806-011-0427-x
- Zadbagher, E., Becek, K., & Berberoglu, S. (2018). Modeling land use/land cover change using remote sensing and geographic information systems: Case study of the Seyhan. Environmental Monitoring and Assessment, 190(8), 494. https://doi.org/10.1007/s10661-018-6877-y
- Zakerinejad, R., & Marker, M. (2014). Prediction of gully erosion susceptibilities using detailed terrain analysis and maximum entropy modeling: A case study in the mazayejan plain, southwest Iran. GeografiaFisica e Dinamica Quaternaria, 37, 67–76.
- Zheng, H. W., Shen, G. Q., Wang, H., & Hong, J. (2015). Simulating land-use change in urban renewal areas: A case study in Hong Kong. Habitat International, 46, 23–34. https://doi.org/10.1016/j.habitatint.2014.10.008