
ABSTRACT
A good understanding of the dynamics of soil organic matter and electrical conductivity, in space and time dimension, is crucial for better agricultural and environmental management. This understanding is more required especially in an irrigated semi-arid region such as Doukkala plain in western of Morocco. To assess the status and dynamics of these two soils parameters in such area, in this study, we collected 100 soil samples at two depths (0–20 and 20–40) and over two successive years (2017 and 2018) using a GPS. Then we developed eight ordinary kriging models to produce digital soil maps. The findings indicate that the low content of organic matter in the soils investigated may have a negative impact on soil quality and productivity. Nonetheless, its increasing in the second year could be a sign of future improvement. Salinization of soils, on the other hand, is a continual process that occurs from year to year, whether in the superficial layer or the layer below. This alarming situation must be seriously taken into account in the plans and strategies of decision makers involved in agricultural and environmental policy in order to reduce soil degradation and preserve its quality and productive potential for sustainable food security.
1 Introduction
Soil deterioration has increased globally in the previous sixty years, both in the northern and southern hemispheres, due to population development and industrial expansion (Feng & Fu, Citation2013; Huang et al., Citation2017). The global assessment of land degradation indicated that 3.5 billion hectares (23% of the Earth’s land area) have been affected by some form and severity of degradation, with an annual rate of 5 to 10 million ha (Stavi & Lal, Citation2015). Severe land degradation already exists in 10 to 30% of drylands (Reynolds et al., Citation2007), and the world’s drylands are expected to be 10% larger by the end of this century than they were in 1961–1990 (Feng & Fu, Citation2013).
A healthy soil stores more carbon than the atmosphere and vegetation as part of the natural activities and ecosystem services offered by soils (Lorenz & Lal, Citation2018a). Soil carbon can be sequestered in the soil for thousands of years due to the stability mechanisms of soil organic matter (physical, chemical, biochemical, microbial, and ecological) (Stockmann et al., Citation2015). However, the world’s cultivated soils have lost 25–75% of their original carbon pool (Lal, Citation2018; Lorenz & Lal, Citation2018b), owing primarily to unsustainable management practices that have resulted in soil degradation and exacerbated the effects of climate change through CO2 emissions into the atmosphere. A significant amount of CO2 released to the atmosphere due to land-use change and unsustainable agricultural practices is estimated to have resulted in a historical soil organic carbon depletion (Lal, Citation2018; Lorenz et al., Citation2019), while much of the global soil organic carbon stock is concentrated in the 0–30 cm (Xu et al., Citation2019).
The presence of soluble salts in the root zone is referred to as soil salinity. Osmotic and/or ionic processes can have an impact on crop development and production, as well as fruit quality. Crops’ ability to absorb water and nutrients may be impaired if the soluble salt level is high enough. Over than 1 billion hectares of soils are affected by salt (FAO, Citation2021b), of which about 60% are saline covering 3.1% (397 million hectares) of the total land area of the world (Setia et al., Citation2013). According to the GSASmap, more than 424 million hectares of topsoil (0–30 cm) are salt-affected, accounting for 4.4% of the land area (FAO, Citation2021a). Salt-affected soils are most common in semi-arid areas where rainfall is insufficient to remove salts from the root zone. Irrigated agriculture is critical for food production in these regions. However, without effective management, irrigation-induced soil salinization will cause soil degradation.
The study of spatial variability of soil properties is critical for improving soil mapping accuracy and providing relevant information for fertilization and soil quality evaluation and management, as well as other agronomic, pedological, and environmental applications (Brevik et al., Citation2016; Oumenskou et al., Citation2019; Zhu et al., Citation2012). However, soil properties vary throughout time and space (Gasch et al., Citation2015). These spatiotemporal variations are caused by a complex interaction of various intrinsic and extrinsic soil factors (physical, chemical, biological, climatic, topographical and anthropogenic) (Gasch et al., Citation2015; Hengl & Macmillan, Citation2019; Hulshof et al., Citation2020; Lin, Citation2011). Extrinsic factors are mostly associated with soil management activities like chemical application, tillage, and irrigation (Oumenskou et al., Citation2019).
For the reasons stated above, accurate information on spatiotemporal variability in soil OM and EC is critical. However, precise spatial measurements of soil parameters, on the other hand, can be costly, time-consuming, and labor-intensive (Bouasria et al., Citation2021; John et al., Citation2022). As a result, there are frequently, in a given region, only a few soil samples points available that do not accurately represent the full range of variation. Consequently, accurate interpolation of soil attributes at unsampled sites is required for soil quality assessment. Hence, current soil mapping techniques enable the monitoring of changes in practically almost soil properties at multiple levels (space, time, and scale) (Bouasria et al., Citation2022; Bouslihim et al., Citation2021; Hengl & Macmillan, Citation2019). Kriging, for instance, is a geostatistical technique for spatial interpolation that has been shown to be sufficiently robust for predicting values at unmeasured locations using observed data. It delivers the best linear unbiased estimates and additional useful informations on the estimation error distribution and it has significant statistical advantages (Hengl, Citation2009; Minasny & McBratney, Citation2007). In Morocco, there has not yet been enough investigation of spatio-temporal analysis using geostatistical methods with precise prediction of soil attributes.
Given the significance of determining soil OM content and electrical conductivity, this study investigated the use of geostatistical spatial interpolation methods to (1) create digital maps of two soil parameters (OM and EC) for two depths and two consecutive years (2017 and 2018), and (2) assess determine the spatiotemporal variability of soil quality and identify areas impacted by SOM degradation and salinization.
2 Methods and materials
2.1 Study area
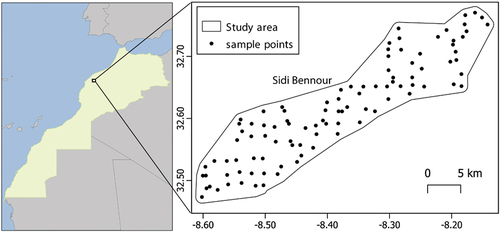
Doukkala irrigation scheme’s High Section () which is located in the western part of Morocco. It is about 120–130 meters above sea level (Ferre & Ruhard, Citation1975). The climate and soil conditions are favorable for agricultural development. However, micro-properties with small farm sizes predominate in the study area (Bouasria et al., Citation2021). In the late 1990s and early 2000s, irrigation is installed. The “Oum Er Bia” River is the primary source of irrigation water. Due to the scarcity of water in recent years, the amount of water allocated to irrigation is constantly decreasing from year to year. This has had a significant impact on crop rotation and crop diversification.
Figure 1. Study area geographical location and the distribution of sampling locations in the study area, sample points are in black dots.
2.2 Soil dataset collection and analysis
We used a conditioned random sampling system to collect 100 soil points for this study. The only restriction on the sampling design is that the point be chosen in an unvegetated plot (bare soil). The samples were collected at two depths of 0–20 cm and 20–40 cm in 2017 and 2018 successively. The data were collected in both years in August, more than a month after crop harvesting, where the soil was not disturbed by agricultural practices (i.e., plow or irrigation) and climatic conditions (i.e., rainfall). To collect accurate geographical coordinates of sample points, we used a handy GPS device (GARMIN eTrex 30). The preparation processing steps were performed on the samples including drying, crushing, and sieving. Then we used Walkey and Black method for OM content characterization. The electrical conductivity is measured from a 1/5 soil/water solution, and the conductivity on the liquid portion is measured with a conductivity meter. The results are given in dS/m.
2.3 Statistical data analysis
The most common descriptive statistics of soil characteristics were calculated for the measured soil properties (OM and EC) assuming that the data were independent in space. They include mean, standard deviation (SD), coefficient of variation (CV), minimum (Min), maximum (Max), skewness (skew), and kurtosis (kurt). contains rating charts for soil parameters based on Moroccan recommendations (DIAEA/DRHA/SEEN 2008). The visual method based on producing graphics (boxplot, histogram, and normal plot), besides the skew and kurtosis values were used for the univariate test of normality in the R package software (R Core Team, Citation2021). Prior to ordinary kriging, the normality test is required to draw the correct interpretation and then better understand the results of the spatial interpolation (Kerry & Oliver, Citation2007). The logarithmic transformation of EC data did not reach normality, and the normalized skewness values are still outside the range [−0.5 to 0.5] (Bogunovic et al., Citation2017). In this regard, we selected another method, the Box-Cox transformation. The OM data, on the other hand, did not require any transformation.
Table 1. Range for different soil OM and EC parameters given by DIAEA/DRHA/SEEN (2008).
2.4 Spatial data analysis
In this study, we used a geostatistical method to generate soil OM and EC spatial patterns at two depths (0–20 and 20–40 cm) in the studied region during two years (2017 and 2018). Ordinary kriging (OK) estimates the non-sampled position by taking a weighted average of the estimated neighboring data values, which are dependent on the distance between these points as well as their groups and values (Oliver & Webster, Citation2015). To express the spatial continuity of soil properties, the kriging approach uses semivariogram parameters that are adapted to a specific region. The semivariogram takes distance into account to determine the strength of the statistical association (Webster & Oliver, Citation2008). Fitting empirical semivariograms to theoretical semivariogram models yielded the geostatistical parameters which are the nugget, partial sill, sill (nugget + partial sill), and range. This later represents the distance at which the spatial association disappears, while the sill represnts the largest variability at which the spatial dependency disappears (Goovaerts, Citation1999). These metrics were utilized to assess the spatial dependence of soil OM content and EC. The ratio of nugget to sill variances, expressed as a percentage, is used to assess spatial dependence. In general, the spatial dependence is strong if the ratio is less than 25%; moderate if the ratio is between 25% and 75%. Otherwise, there is little spatial dependence (Cambardella et al., Citation1994).
A geodatabase file was created with data for the coordinates (X and Y) relative to the sampling site location, which were transformed in the projection of Lambert Conformal Conic, North of Morocco. Using kriging, several digital maps were created depending on each soil chemical property for each depth and year. contains soil parameter rating charts based on Moroccan recommendations (DIAEA/DRHA/SEEN 2008).
To evaluate the performance of the spatial interpolation methods, we used the leave-one-out cross-validation (LOOCV) technique. This method is widely used in kriging techniques to validate model accuracy (Martin & Simpson, Citation2005; Le Gratiet & Cannamela, Citation2015; Lajaunie et al., Citation2020). Similarly, it is a common method for validating kriging-based soil mapping (Angelini et al., Citation2017; Bouasria et al., Citation2021; Piikki et al., Citation2021; Tziachris et al., Citation2017). Furthermore, if the sample dataset is obtained through simple random sampling, this method of cross-validation is known to be nearly unbiased (de Bruin et al., Citation2022).
Therefore, for a cross-validation method of the fitted semivariogram models, the mean error (ME) and root mean square error (RMSE) were used to evaluate the accuracy or best fit of the kriging model. If the ME value is near to zero, the interpolation approach is unbiased. The best fit to the data is indicated by the lowest RMSE value.
3 Results and discussion
3.1 Descriptive statistics
The commonly used descriptive statistical summary of the OM and EC is shown in . We used the coefficient of variation (CV) to interpret the variability of soil properties. In this regards, the CV was classified as follows: most variable (CV > 35%), moderate variable (15 < CV < 35%), and least variable (CV < 15%) (Wilding, Citation1985). The CV ranged from 39.02% (in OM at 0–20 cm of depth) to 58.38% (in EC at the same depth). In most cases, the soil properties variability in low depth is higher than in the upper depth. The CV range for the observed soil data revealed varying degrees of heterogeneity among the OM and EC soil studied properties. The high CV values for soil OM content, ranging from 39.02 to 46.51%, demonstrated a variability ranging from moderate to high (Mulla & McBratney, Citation2001). The pedoclimatic factors and land use all influence moderate soil OM variability. The soil pedological classes in the research area determine its variety, whereas intensive farming practices increased the spatial heterogeneity of soil OM (Bouasria et al., Citation2021).
Table 2. Summary statistics of soil OM content and EC for 2017 and 2018 in the study area.
The summary statistics of the data reveal that the soil OM content in 2017 in the study area varied between 0.15% and 2.16% and between 0.15% and 1.86% for the depths of 0–20 cm and 20–40 cm, respectively. While in 2018, it revealed that OM showed a relative improvement with values ranging from 0.31% to 2.50% and from 0.08% to 2.16% for the same depths, respectively. The average OM improvement between 2017 and 2018 is in the order of 0.12% and 0.13% at depths 0–20 cm and 20–40 cm, respectively. The EC values in 2017 ranged from 27.82 to 520.60 (µS/cm) and from 30.48 to 667.80 (µS/cm) for the depths of 0–20 cm and 20–40 cm, respectively. Whereas in 2018, EC values range from 46.03 to 867.80 (S/cm) for the same depths and from 30.51 to 838.10 (S/cm) for the same depths. The increase in average EC between 2017 and 2018 is more significant in the upper depth (52.09 S/cm) than in the lower depth (17.06 S/cm).
The soil dataset revealed low skewness for OM content, indicating that it had a normal distribution. While EC dataset showed high skewness that needed a transformation to shape it for normal distribution. The Box-Cox transformation method is used in our case and it fitted the EC dataset to lower skewness values (Bogunovic et al., Citation2017).
3.2 Soil OM status and dynamics
The study area is very poor in organic matter. According to the findings, the average of OM content in the study area varied between 0.86% and 1.23%, with a standard deviation between 0.40% and 0.48%. Hence, the entire samples of the region do not exceed 3% of OM concentration for both depths and for the consequent two years. This is consistent with prior studies conducted in the Doukkala plain (Bouasria et al., Citation2021; Bouasria et al., Citation2022; El Bourhrami et al., Citation2022). Therefore, a large proportion of the studied soil samples (between 71% and 96%) were low in soil OM, with a concentration below 1.5% ( , ), suggesting agricultural land deterioration and contributing to a concerning decline in soil quality (Bouasria et al., Citation2021; Naman et al., Citation2015). However, the results show that the medium-class soil improved by+0.10% on the top depth and+0.15% on the bottom. We think that the sugar beet residues incorporation in soil via mechanical harvesting would be the primary driver influencing SOM increase in a short period. A recent study on the Doukkala irrigated scheme, which includes our study area, was conducted to assess the effects of sugar beet residues returning on soil fertility between 2012 and 2019 (Rerhou et al., Citation2022). The results show a significant improvement in soil fertility, which includes, in addition to SOM, several soil properties such as Phosphorus, Potassium, Magnesium, Zinc, and Boron. The same study (Rerhou et al., Citation2022) reveals that SOM increased by an average of+28.8% over eight growing seasons with a maximum of+194% where sugar beet residues were incorporated six times. Similarly, a single incorporation of sugar beet residues increased SOM by 29%, or from 1.38% to 1.65% with an improvement of+0.27, which is higher than our findings. However, according to the same study (Rerhou et al., Citation2022), the SOM has experienced a −19% decrease in plots where crop residues were never returned to the soil.
Figure 2. Changes in soil OM in the study area between 2017 and 2018 for both depths (0–20 and 20–40 cm).
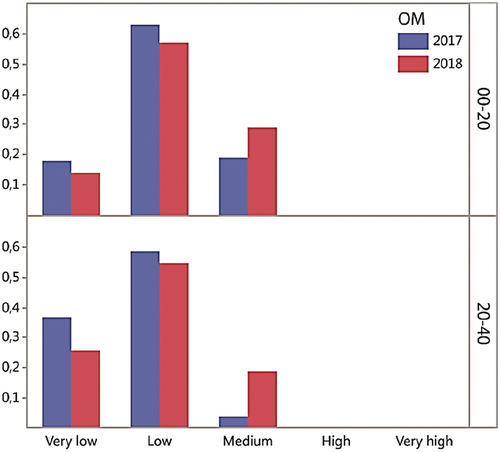
Table 3. Evolution of soil organic matter under different soil categories based on SEEN classification.
3.3 Soil EC status and dynamics
The region suffers from the growing problem of salinity. The average of EC of the studied samples ranged from 196.88 (µS/cm) to 252.74 (µS/cm), with a standard deviation of 90.00 (µS/cm) to 147.56 (µS/cm). Hence, and demonstrate that between 2017 and 2018, the proportion of soil classes with medium to very high salinity increased from 11% to 31% at the upper depth and from 12% to 13% at the lower depth. This is a highly concerning scenario that can potentially worsen in the future and harm the quality of the soils and their productive and economic values.
Figure 3. Changes in soil EC in the study area between 2017 and 2018 for both depths (0–20 and 20–40 cm).
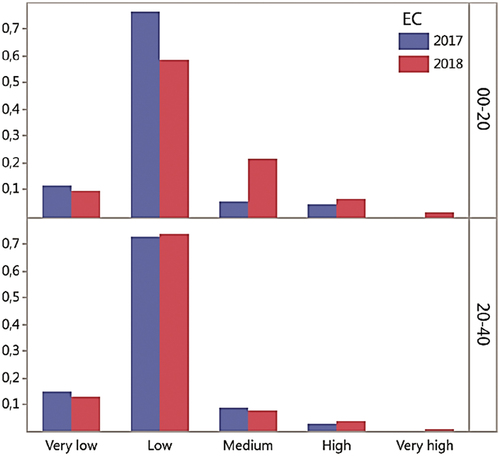
Table 4. Evolution of soil EC under different soil categories based on SEEN classification.
The water from the Oum-Er-Rbia River, which is used for irrigation in the Doukkala region, causes salinization of the soil. However, there are no sodicity issues with this water. Previous studies reported that the water’s salinity is high, with an average EC of 1.42 dS/m (Gana, Citation2002; Rahoui et al.,). It brings a substantial amount of salts, estimated at 4.3 tons per hectare per year. The authors underlined, however, that with a Sodium Adsorption Ratio (SAR) value of 3.79 (meq/l), this water poses no sodicity hazards, and that this value implies that irrigation with this water should not result in a decrease in the rate of water infiltration into the soil. The soil salinity and alkalinity regimes vary depending on the season (Badraoui et al., Citation2000; Gana, Citation2002; Rahoui et al.,). Indeed, they are affected by the amount of leaching precipitation in the winter and spring, as well as the dryness at the end of the crop-growing season, when irrigation is required. Soils that are not salty in the winter become quite salty in the summer due to temporary salt accumulation after irrigation and evapotranspiration. Although the Doukkala soils present only secondary salinization problems (Badraoui et al., Citation2000; Rahoui et al.,), irrigation practices must be rationally controlled, especially in soils with limited drainage, to prevent the dangers of severe salinization (Gana, Citation2002).
3.4 Spatial distributions of soils properties
depicts the semivariogram model and its parameters of soil properties. Different theoretical semivariogram models for significant fit of soil chemical properties were chosen based on the lowest root mean square error (RMSE). The spherical semivariogram model was employed to map soil OM and EC characteristics. We created eight models in all (2 years × 2 depths × 2 attributes). This result is consistent with previous research, which shows that the spherical model is best suited for measuring spatial variability in soil chemical properties (De Benedetto et al., Citation2022; Rahmani et al., Citation2022) since it explains the most variability in the spatial dataset (Behera & Shukla, Citation2015; Officer et al., Citation2004; Wang et al., Citation2015). The spatial correlation range for both soil OM and EC was high (). The spatial dependence ranges were considerable, ranging from 5,489.06 to 24,321.57 m for OM and from 3,878.37 to 20,828.05 m for EC, demonstrating that the optimum sample interval varied substantially amongst soil properties (Kerry & Oliver, Citation2007). The finding demonstrated that the method of sampling was well-suited to quantifying the spatial variable distribution of soil characteristics. The range values provide a notion of the correlation between distinct sampling places, as well as the greatest spatial dependency distance between them (Hengl, Citation2009). The fact that the range fluctuates with different lag sizes suggests that spatial structure can be viewed using a single semivariogram model (Hengl et al., Citation2007; Heuvelink & Webster, Citation2001). This distinction may not be significant for semivariance computation, but it may be significant for understanding the underlying spatial structure of the data (Brus & Heuvelink, Citation2007). However, the spatial dependence was very low for all developed semivariogram models according to the nugget/sill ratios. Both inherent and external factors influence soil spatial dependency (Cambardella et al., Citation1994). Human activities, particularly agricultural practices, had the greatest influence on soil parameters in the study area (Ibno Namr & Mrabet, Citation2004; Mrabet et al., Citation2004).
Table 5. Statistics of cross-validation for the best-fit theoretical semivariogram for predicting soil properties.
The spatial distribution on produced maps show an increase in surface from the soil OM class “very low” to “low” and “medium” classes in the upper depth (0–20 cm), with 12,968 hectares (23.39%) and 283 hectares (0.51%), respectively. While the lower depth (20–40 cm), the maps reveal an increase from the “very low” class to the “low” class with a surface value of 26,483 hectares (47.75%) (, ). The increase in surface area in terms of soil OM is shown in the southwestern of the study area where the vertisols are predominant. Similarly, for soil EC, we see a rise in surface from the soil EC class “very low” to “low” and “medium” classes in the upper depth, with 17,918 hectares (32.3%) and 7,885 hectares (14.22%), respectively. While the lower depth (20–40 cm), the maps show an increase from the “very low” class to the “low” class with a surface of 14,033 hectares (25.31%) (, ). In contrast to soil OM, the increase in surface area related to soil EC is shown in the middle and north of the study area, where coarse-textured soils prevail.
Figure 4. Spatial distribution of soil OM using OK.
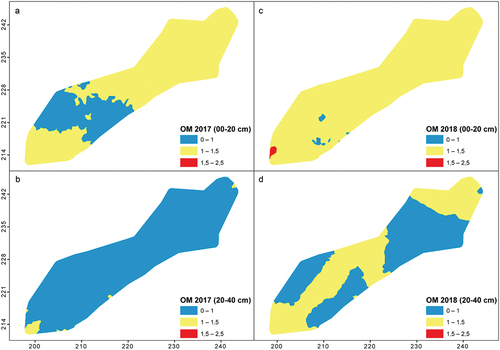
Figure 5. Spatial distribution of soil EC using OK.
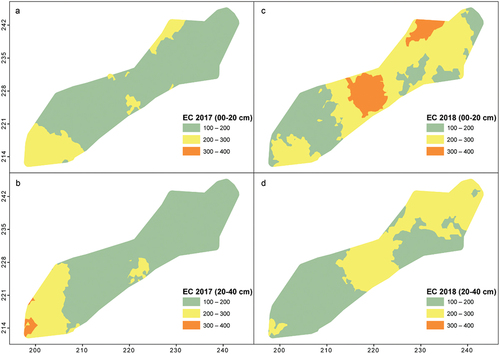
Table 6. Areas classified as different soil types based on soil organic matter and EC.
3.5 Soil degradation status by intrinsic and extrinsic factors analysis
The current state of water and soil degradation as a result of increased salinization and organic matter loss is caused by both inherent and external forces. For the case of salinity, the intrinsic factors of the soil reside on the one hand in the reduction of the efficiency of its drainage system, which is presented by punctual zones at the regional level, and on the other hand in the nature of the texture of the soils, the less rich in clays are the poor in organic matter (Badraoui et al., Citation2000; Bouasria et al., Citation2021; Soudi et al., Citation2000).
Irrigation water and climatic conditions are extrinsic soil salinization sources, but crop intensification practices and climatic conditions are linked to organic matter loss. The estimated quantities of salts carried by irrigation water are critical. They are around 130 kg/ha for sodium, 271 kg/ha for chlorides, and 107 kg/ha for sulfates (Gana, Citation2002). As a result, with these irrigation water would cause salt deposition in the soil, posing long-term concerns of soil salinization, plant toxicity, and negative crop yield effects (Mohanavelu et al., Citation2021). Indeed, the toxicity risks are higher with spray irrigation than with gravity irrigation, where foliar uptake of harmful sodium and chloride ions is fairly significant (Hopmans et al., Citation2021). Furthermore, considerable leaching of salts into groundwater degrades its quality (EL Achheb et al., Citation2003; Jamaa et al., Citation2020). Furthermore, the vast majority of soil OM levels in the study area are low (Bouasria et al., Citation2021; Soudi et al., Citation2000).
As a result, it is easy to conclude that the situation is extremely concerning, and it is also easy to predict that if appropriate decisions are not made, the problem will worsen in the future. Hence, the possible scenarios for reasonable management of agricultural soils not yet affected by salinization, remediation of those already affected and recovery of soil OM levels could focus on: crop rotation (El Hamdi et al., Citation2022; Naman et al., Citation2015), the introduction of novel drought and salinity resistant varieties (Hirich, Rafik, et al., Citation2021; a; Abidi et al., Citation2022), the use of organic amendments (El Hasini et al., Citation2019; El Hasini et al., Citation2020), and effective irrigation management and soil conservation methods (Aboutayeb et al., Citation2020; Mrabet et al., Citation2012).
4 Conclusion
A good understanding of the spatiotemporal dynamics of soil organic matter and electrical conductivity is critical for the most effective agricultural and environmental management. Eight models have been developed to produce maps for these both soil parameters on two depths (0–20 and 20–40) in two years (2017 and 2018). The resulting maps were rated based Moroccan recommendations to evaluate the status and dynamics of studied soil attributes.
From this study, we could conclude that the low concentration of organic matter in the studied soils could have negative repercussions on soil quality and productivity. Nevertheless, there was an increase in its content in the second year, which, although not significant, could be an indication of improvement in the future. On the other hand, the salinization of the soils is continuous progression from one year to the other whether it is in the superficial layer or the layer below.
Policy makers involved in agricultural policy should seriously consider, in future plans and strategies, this alarming situation in terms of soil degradation through loss of organic matter and salinization. Without any real intervention that could safeguard the quality of soils and their productive potential, food security could be jeopardized.
Disclosure statement
No potential conflict of interest was reported by the author(s).
References
- Abidi, I., Hirich, A., Bazile, D., Mahyou, H., Gaboun, F., & Sb, A. (2022). Using Agronomic Parameters to Rate Quinoa (Chenopodium quinoa Willd .) Cultivars Response to Saline Irrigation under Field Conditions in Eastern Morocco. Environ. Sci. Proc. 1–5.
- Aboutayeb, R., El Yousfi, B., & El Gharras, O. (2020). Impact of no-till on physicochemical properties of vertisols in chaouia region of Morocco. Eurasian Journal of Soil Science (Ejss), 9(2), 119–125. https://doi.org/10.18393/ejss.663502
- Angelini, M. E., Heuvelink, G. B. M., & Kempen, B. (2017). Multivariate mapping of soil with structural equation modelling. European Journal of Soil Science, 68(5), 575–591. https://doi.org/10.1111/ejss.12446
- Badraoui, M., Agbani, M., & Soudi, B. (2000). Evolution de la qualité des sols sous mise en valeur intensive au Maroc. Séminaire ‘Intensification Agric Qual des sols des eaux’Rabat, Maroc, 2–3.
- Behera, S. K., & Shukla, A. K. (2015). Spatial Distribution of Surface Soil Acidity, Electrical Conductivity, Soil Organic Carbon Content and Exchangeable Potassium, Calcium and Magnesium in Some Cropped Acid Soils of India. Land Degradation & Development, 26(1), 71–79. https://doi.org/10.1002/ldr.2306
- Bogunovic, I., Kisic, I., Mesic, M., Percin, A., Zgorelec, Z., Bilandžija, D., Jonjic, A., & Pereira, P. (2017). Reducing sampling intensity in order to investigate spatial variability of soil pH, organic matter and available phosphorus using co-kriging techniques. A case study of acid soils in Eastern Croatia. Archives of Agronomy and Soil Science, 63(13), 1852–1863. https://doi.org/10.1080/03650340.2017.1311013
- Bouasria, A., Ibno Namr, K., Rahimi, A., Ettachfini, E. M., & Rerhou, B. (2022). Evaluation of Landsat 8 image pansharpening in estimating soil organic matter using multiple linear regression and artificial neural networks. Geo-Spatial Information Science, 25(3), 353–364. https://doi.org/10.1080/10095020.2022.2026743
- Bouasria, A., Namr, K. I., Rahimi, A., & Ettachfini, E. M. (2021). Geospatial Assessment of Soil Organic Matter Variability at Sidi Bennour District in Doukkala Plain in Morocco. Journal of Ecological Engineering, 22(11), 120–130. https://doi.org/10.12911/22998993/142935
- Bouslihim, Y., Rochdi, A., Aboutayeb, R., El Amrani-Paaza, N., Miftah, A., & Hssaini, L. (2021). Soil Aggregate Stability Mapping Using Remote Sensing and GIS-Based Machine Learning Technique. Frontiers in Earth Science, 9, 1–13. https://doi.org/10.3389/feart.2021.748859
- Brevik, E. C., Calzolari, C., Miller, B. A., Pereira, P., Kabala, C., Baumgarten, A., & Jordán, A. (2016). Soil mapping, classification, and pedologic modeling: History and future directions. Geoderma, 264, 256–274. https://doi.org/10.1016/j.geoderma.2015.05.017
- Brus, D. J., & Heuvelink, G. B. M. (2007). Optimization of sample patterns for universal kriging of environmental variables. Geoderma, 138(1–2), 86–95. https://doi.org/10.1016/j.geoderma.2006.10.016
- Cambardella, C. A., Moorman, T. B., & Novak, J. M., et al. (1994). Field-Scale Variability of Soil Properties in Central Iowa Soils. Soil Science Society of America Journal, 58, 1501–1511. https://doi.org/10.2136/sssaj1994.03615995005800050033x
- De Benedetto, D., Barca, E., Castellini, M., Popolizio, S., Lacolla, G., & Stellacci, A. M. (2022). Prediction of Soil Organic Carbon at Field Scale by Regression Kriging and Multivariate Adaptive Regression Splines Using Geophysical Covariates. Land, 11(3), 381. https://doi.org/10.3390/land11030381
- de Bruin, S., Brus, D. J., Heuvelink, G. B. M., van Ebbenhorst Tengbergen, T., & Wadoux, A. M. J. C. (2022). Dealing with clustered samples for assessing map accuracy by cross-validation. Ecological Informatics, 69, 101665. https://doi.org/10.1016/j.ecoinf.2022.101665
- El Achheb, A. E., Mania, J., & Mudry, J. (2003). Mécanismes d’aquisitions de la minéralisation des eaux souterraines dans le bassin Sahel-Doukkala (Maroc Occidental). Approche par des tarceurs hydro-géochimiques.
- El Bourhrami, B., Namr, K. I., Et-Tayeb, H., & Duraisamy, V. (2022). Application of Soil Quality Index to Assess the Status of Soils Submitted to Intensive Agriculture in the Irrigated Plain of Doukkala, Moroccan Semiarid Region. Ecological Engineering & Environmental Technology, 23(2), 129–143. https://doi.org/10.12912/27197050/145754
- El Hamdi, A., Morarech, M., El Mouine, Y., Rachid, A., El Ghmari, A., Yameogo, S., Chalikakis, K., Yachou, H., Kacimi, I., Zouahri, A., Dakak, H., Bouramtane, T., Valles, V., & Barbiero, L. (2022). Sources of spatial variability of soil salinity: The case of Beni Amir irrigated command areas in the Tadla Plain, Morocco. Arid Land Research and Management, 36(3), 245–264. https://doi.org/10.1080/15324982.2022.2026531
- El Hasini, S., De Nobili, M., El Azzouzi, M., Azim, K., Douaik, A., Laghrour, M., El Idrissi, Y., El Alaoui El Belghiti, M., & Zouahri, A. (2020). The influence of compost humic acid quality and its ability to alleviate soil salinity stress. Int J Recycl Org Waste Agric, 9, 21–31. https://doi.org/10.30486/IJROWA.2020.671213
- El Hasini, S., Iben Halima, O., El Azzouzi, M., Douaik, A., Azim, K., & Zouahri, A. (2019). Organic and inorganic remediation of soils affected by salinity in the Sebkha of Sed El Mesjoune – Marrakech (Morocco). Soil and Tillage Research, 193, 153–160. https://doi.org/10.1016/j.still.2019.06.003
- FAO. (2021a). Global map of salt-affected soils. FAO.
- FAO. (2021b) . Salt-affected Soils are a Global Issue. Intergov Tech Panel Soils.
- Feng, S., & Fu, Q. (2013). Expansion of global drylands under a warming climate. Atmospheric Chemistry and Physics, 13(19), 10081–10094. https://doi.org/10.5194/acp-13-10081-2013
- Ferre, M., & Ruhard, J. P. P. (1975). Ressources en eau (plaines et bassins du Maroc atlantique) ; les bassins des Abda-Doukkala et du Sahel d’Azemmour à Safi. Not Mém Sérv Géol Maroc N, 231(2), 261–297.
- Gana, L. (2002). Qualité des eaux et des sols dans les périmètres des doukkala. Review HTE.
- Gasch, C. K., Hengl, T., Gräler, B., Meyer, H., Magney, T. S., & Brown, D. J. (2015). Spatio-temporal interpolation of soil water, temperature, and electrical conductivity in 3D + T: The Cook Agronomy Farm data set. Spatial Statistics, 14, 70–90. https://doi.org/10.1016/j.spasta.2015.04.001
- Goovaerts, P. (1999). Geostatistics in soil science: State-of-the-art and perspectives. Geoderma, 89(1–2), 1–45. https://doi.org/10.1016/S0016-7061(98)00078-0
- Hengl, T. (2009). A practical guide to Geostatistical Interpolation. 293.
- Hengl, T., Heuvelink, G. B. M., & Rossiter, D. G. (2007). About regression-kriging: From equations to case studies. Computers & Geosciences, 33(10), 1301–1315. https://doi.org/10.1016/j.cageo.2007.05.001
- Hengl, T., & Macmillan, R. A. (2019). Predictive Soil Mapping with R. OpenGeoHub Found Wageningen, Netherlands 227–273.
- Heuvelink, G. B. M., & Webster, R. (2001). Modelling soil variation: Past, present, and future. Geoderma, 100(3–4), 269–301. https://doi.org/10.1016/S0016-7061(01)00025-8
- Hirich, A., Rafik, S., Rahmani, M., Fetouab, A., Azaykou, F., Filali, K., Ahmadzai, H., Jnaoui, Y., Soulaimani, A., Moussafir, M., El Gharous, M., Karboune, S., Sbai, A., & Choukr-Allah, R. (2021). Development of quinoa value chain to improve food and nutritional security in rural communities in rehamna, morocco: Lessons learned and perspectives. Plants, 10(2), 1–27. https://doi.org/10.3390/plants10020301
- Hopmans, J. W., Qureshi, A. S., Kisekka, I., Munns, R., Sr, G., Rengasamy, P., Ben-Gal, A., Assouline, S., Javaux, M., Ps, M., & Pa, R. (2021). Chapter One - Critical knowledge gaps and research priorities in global soil salinity. In Donald L. Sparks, (Ed.), Sparks DLBT-A in A (pp. 1–191). Academic Press.
- Huang, J., Li, Y., Fu, C., Chen, F., Fu, Q., Dai, A., Shinoda, M., Ma, Z., Guo, W., Li, Z., Zhang, L., Liu, Y., Yu, H., He, Y., Xie, Y., Guan, X., Ji, M., Lin, L., Wang, S. … Wang, G. (2017). Dryland climate change: Recent progress and challenges. Reviews of Geophysics, 55(3), 719–778. https://doi.org/10.1002/2016RG000550
- Hulshof, C. M., Spasojevic, M. J., & Schrodt, F. (2020). The edaphic control of plant diversity. Global Ecology and Biogeography, 29(10), 1634–1650. https://doi.org/10.1111/geb.13151
- Ibno Namr, K., & Mrabet, R. (2004). Influence of agricultural management on chemical quality of a clay soil of semi-arid Morocco. Journal of African Earth Sciences, 39(3–5), 485–489. https://doi.org/10.1016/j.jafrearsci.2004.07.016
- Jamaa, H., El Achheb, A., & Ibno Namr, K. (2020). Spatial variation of groundwater quality and assessment of water table fluctuations in Plio-Quaternary aquifer formations in Doukkala Plain, Morocco. Groundwater for Sustainable Development, 11, 100398. https://doi.org/10.1016/j.gsd.2020.100398
- John, K., Bouslihim, Y., Bouasria, A., Razouk, R., Hssaini, L., Isong, I. A., Ait M’barek, S., Ayito, E. O., & Ambrose-Igho, G. (2022). Assessing the impact of sampling strategy in random forest-based predicting of soil nutrients: A study case from northern Morocco. Geocarto International, 0, 1–14. https://doi.org/10.1080/10106049.2022.2048091
- Kerry, R., & Oliver, M. A. (2007). Comparing sampling needs for variograms of soil properties computed by the method of moments and residual maximum likelihood. Geoderma, 140(4), 383–396. https://doi.org/10.1016/j.geoderma.2007.04.019
- Lajaunie, C., Renard, D., Quentin, A., Le Guen, V., & Caffari, Y. (2020). A Non-Homogeneous Model for Kriging Dosimetric Data. Mathematical Geosciences, 52(7), 847–863. https://doi.org/10.1007/s11004-019-09823-7
- Lal, R. (2018). Digging deeper: A holistic perspective of factors affecting soil organic carbon sequestration in agroecosystems. Global Change Biology, 24(8), 3285–3301. https://doi.org/10.1111/gcb.14054
- Lin, H. (2011). Three Principles of Soil Change and Pedogenesis in Time and Space. Soil Science Society of America Journal, 75(6), 2049–2070. https://doi.org/10.2136/sssaj2011.0130
- Loic Le Gratiet & Claire Cannamela. (2015). Cokriging-Based Sequential Design Strategies Using Fast Cross-Validation Techniques for Multi-Fidelity Computer Codes. Technometrics, 57(3), 418–427. https://doi.org/10.1080/00401706.2014.928233
- Lorenz, K., & Lal, R. (2018a). Agricultural Land Use and the Global Carbon Cycle BT - Carbon Sequestration in Agricultural Ecosystems (K. Lorenz & R. Lal, Eds). Springer International Publishing, Cham.
- Lorenz, K., & Lal, R. (2018b). Soil Carbon Stock BT - Carbon Sequestration in Agricultural Ecosystems (K. Lorenz & R. Lal, Eds). Springer International Publishing, Cham.
- Lorenz, K., Lal, R., & Ehlers, K. (2019). Soil organic carbon stock as an indicator for monitoring land and soil degradation in relation to United Nations’ Sustainable Development Goals. Land Degradation & Development, 30(7), 824–838. https://doi.org/10.1002/ldr.3270
- Martin, J. D., & Simpson, T. W. (2005). Use of kriging models to approximate deterministic computer models. AIAA Journal, 43(4), 853–863. https://doi.org/10.2514/1.8650
- Minasny, B., & McBratney, A. B. (2007). Spatial prediction of soil properties using EBLUP with the Matérn covariance function. Geoderma, 140(4), 324–336. https://doi.org/10.1016/j.geoderma.2007.04.028
- Mohanavelu, A., Naganna, S. R., & Al-Ansari, N. (2021). Irrigation induced salinity and sodicity hazards on soil and groundwater: An overview of its causes, impacts and mitigation strategies. Agriculture, 11(10), 983. https://doi.org/10.3390/agriculture11100983
- Mrabet, R., El-Brahli, A., Anibat, I., & Bessam, F. (2004). No-tillage technology: Research review of impacts on soil quality and wheat production in semiarid Morocco. In C. C-M & D. G (Eds.), Options Mediterraneennes. Serie A, Seminaires Mediterraneens (pp. 133–138). CIHEAM.
- Mrabet, R., Moussadek, R., Fadlaoui, A., & van Ranst, E. (2012). Conservation agriculture in dry areas of Morocco. Field Crops Research, 132, 84–94. https://doi.org/10.1016/j.fcr.2011.11.017
- Mulla, D. J., & McBratney, A. B. (2001). Soil spatial variability. Soil Phys Companion, 343–373. https://doi.org/10.1016/0167-1987(87)90053-5
- Naman, F., Brahim Soudi, B., & El Herradi, E. (2015). Extraction and characterization of humic substances in soils of the irrigated perimeter of Doukkala in Morocco. J Mater Environ Sci, 6(9), 2647–2654.
- Officer, S. J., Kravchenko, A., Bollero, G. A., Sudduth, K. A., Kitchen, N. R., Wiebold, W. J., Palm, H. L., & Bullock, D. G. (2004). Relationships between soil bulk electrical conductivity and the principal component analysis of topography and soil fertility values. Plant and Soil, 258(1), 269–280. https://doi.org/10.1023/B:PLSO.0000016557.94937.ed
- Oliver, M. A., & Webster, R. (2015). The Variogram and Modelling BT - Basic Steps in Geostatistics: The Variogram and Kriging (M. Oliver & R. Webster, Eds). Springer International Publishing, Cham.
- Oumenskou, H., El Baghdadi, M., Barakat, A., Aquit, M., Ennaji, W., Karroum, L. A., & Aadraoui, M. (2019). Multivariate statistical analysis for spatial evaluation of physicochemical properties of agricultural soils from Beni-Amir irrigated perimeter, Tadla plain, Morocco. Geology, Ecology, and Landscapes, 3(2), 83–94. https://doi.org/10.1080/24749508.2018.1504272
- Piikki, K., Wetterlind, J., Söderström, M., & Stenberg, B. (2021). Perspectives on validation in digital soil mapping of continuous attributes—a review. Soil Use and Management, 37(1), 7–21. https://doi.org/10.1111/sum.12694
- Rahmani, S. R., Ackerson, J. P., Schulze, D., Adhikari, K., & Libohova, Z. (2022). Digital Mapping of Soil Organic Matter and Cation Exchange Capacity in a Low Relief Landscape Using LiDAR Data. Agronomy, 12(6), 1338. https://doi.org/10.3390/agronomy12061338
- R Core Team. (2021). R: A Language and Environment for Statistical Computing. R Core Team.
- Rerhou, B., Mosseddaq, F., Moughli, L., Ezzahiri, B., Mokrini, F., Bel Lahbib, S., & Ibno Namr, K. (2022). Effect of Crop Residues Management on Soil Fertility and Sugar Beet Productivity in Western Morocco. Ecological Engineering & Environmental Technology, 23(5), 256–271. https://doi.org/10.12912/27197050/152182
- Reynolds, J. F., Stafford Smith, D. M., Lambin, E. F., Turner, B. L., Mortimore, M., Batterbury, S. P. J., Downing, T. E., Dowlatabadi, H., Fernández, R. J., Herrick, J. E., Huber-Sannwald, E., Jiang, H., Leemans, R., Lynam, T., Maestre, F. T., Ayarza, M., & Walker, B. (2007). Ecology: Global desertification: Building a science for dryland development. Science, 80-) 316(5826), 847–851. https://doi.org/10.1126/science.1131634
- Setia, R., Gottschalk, P., Smith, P., Marschner, P., Baldock, J., Setia, D., & Smith, J. (2013). Soil salinity decreases global soil organic carbon stocks. The Science of the Total Environment, 465, 267–272. https://doi.org/10.1016/j.scitotenv.2012.08.028
- Soudi, B, Naman, F, & Chiang, CN.(2000). Problématique de gestion de la matière organique des sols : cas des périmètres irrigués du Tadla et des Doukkala. Séminaire. Intensification Agric Qual des sols des eaux”, Rabat, 2–3
- Stavi, I., & Lal, R. (2015). Achieving Zero Net Land Degradation: Challenges and opportunities. Journal of Arid Environments, 112, 44–51. https://doi.org/10.1016/j.jaridenv.2014.01.016
- Stockmann, U., Padarian, J., McBratney, A., Minasny, B., de Brogniez, D., Montanarella, L., Hong, S. Y., Rawlins, B. G., & Field, D. J. (2015). Global soil organic carbon assessment. Global Food Security, 6, 9–16. https://doi.org/10.1016/j.gfs.2015.07.001
- Tziachris, P., Metaxa, E., Papadopoulos, F., & Papadopoulou, M. (2017). Spatial modelling and prediction assessment of soil iron using Kriging interpolation with pH as auxiliary information. ISPRS International Journal of Geo-Information, 6(9), 283. https://doi.org/10.3390/ijgi6090283
- Wang, J., Yang, R., & Bai, Z. (2015). Spatial variability and sampling optimization of soil organic carbon and total nitrogen for Minesoils of the Loess Plateau using geostatistics. Ecological Engineering, 82, 159–164. https://doi.org/10.1016/j.ecoleng.2015.04.103
- Webster, R., & Oliver, M. A. (2008). Geostatistics for Environmental Scientists (Second ed.). John Wiley and Sons, Rothamsted Research.
- Wilding, L. P. (1985) Spatial variability: Its documentation, accommodation and implication to soil surveys
- Xu, H., Sieverding, H., Kwon, H., Clay, D., Stewart, C., Johnson, J. M. F., Qin, Z., Karlen, D. L., & Wang, M. (2019). A global meta-analysis of soil organic carbon response to corn stover removal. GCB Bioenergy, 11(10), 1215–1233. https://doi.org/10.1111/gcbb.12631
- Zhu, Q., Liao, K., Xu, Y., Yang, G., Wu, S., & Zhou, S. (2012). Monitoring and prediction of soil moisture spatial–temporal variations from a hydropedological perspective: A review. Soil Research, 50(8), 625–637. https://doi.org/10.1071/SR12228