
ABSTRACT
Protected areas (PA) have been considered as biodiversity conservation hub across the globe. The conventional “top-down” management approach has been failed to ensure resource sustainability in many PA. Therefore, co-management was introduced to secure the PA of Bangladesh and started with legal framework in 2008 (IPAC Project) until 2018 (CREL Project). Thus, land-use and biodiversity change analysis from a decade before and after 2008 has generated comparison of previous and after scenario of co-management. Hence for evaluating effects of co-management on temporal biodiversity and land-use change in Bangladesh, two PA, Chunati Wildlife Sanctuary (CWS) under IUCN Protected Area Category IV and Lawachara National Park (LNP) under IUCN Protected Area Category II, were selected. Community structure of both vascular plants and avifauna species was used to determine current biodiversity variations with habitat influence. Land-use change analysis revealed deforestation and settlements expansion in CWS but decrease in LNP. Trend analysis forecasted good future of LNP in terms of forest cover till 2038. Biodiversity analysis revealed that CWS is slightly more diverse and even than LNP. Comparative analysis recognized prominent loss of biodiversity before co-management period. Therefore, co-management system can be employed in the rest of reserve-forest areas of Bangladesh for conservation betterment.
1. Introduction
Protected Areas (PAs) are very important indicators for meeting global biodiversity targets which are threatened by unsustainable resources used by humans all over the world (Visconti et al., Citation2019). Conservation strategies must be followed by certain regulations for effective management (Rashid et al., Citation2017). The global biodiversity is being threatened by several factors including land-use changes; conversion of forest land to human-intended land uses resulted in deforestation, overexploitation of natural resources, pollution and spread of invasive alien species (Akber & Shrestha, Citation2015; K. M. Masum, A. Mansor, S. A. M. Sah, S. H. Lim, et al., Citation2017; Martinez et al., Citation2009). The interactions between different ecological and societal factors and mechanisms have always been a great challenge in order to understand the biodiversity and land-use change structure (Masum et al., Citation2008, Citation2016; Schneider & Pontius, Citation2001; Veldkamp & Lambin, Citation2001). Land-use change is a major driver for irreversible biodiversity loss globally which is influenced by climate, technology, and economic factors playing dominant role at different temporal and spatial scales (Areendran et al., Citation2013; K. M. Masum, A. Mansor, S. A. M. Sah, & H. S. Lim, Citation2017; Rozali et al., Citation2021; Sala et al., Citation2000; Samad et al., Citation2022).
The transition of land use from primary forest to plantation forest and ending with agriculture and settlements threatening the biodiversity and it has been enhanced through technical and chemical intensity in response to social and economic pressures (Khera et al., Citation2001; Masum et al., Citation2016; Rozali et al., Citation2017; Samad et al., Citation2022). Any major land-use change will change the entire dynamics of natural habitats for many species especially in the tropical forest region (K. M. Masum, A. Mansor, S. A. M. Sah, & H. S. Lim, Citation2017; Rozali et al., Citation2021). The current rate of tropical deforestation is 10 million hectares per year and it is leading 2,000 species to extinctions every year (Pimm et al., Citation2014).
Moreover, forest management approaches impact on biodiversity and land-use change, which are intrinsically connected (FAO, Citation2015; Hockings, Citation2006). As the top-down approaches failed to address the need of the dependent stakeholders that was found ineffective and negative for conserving biodiversity, where community-based forest resource management (co-management) got global acceptance based on management performance (Masum et al., Citation2020; Jashimuddin et al., Citation2021; Islam et al., Citation2021; Masum et al., 2021). It was found better to achieve the SDGs specifically related to poverty alleviation, environmental sustainability, water and food security intimidated by climate change and biodiversity loss.
Human settlements around these PA affecting negatively through land encroachment, pure ecological focus, and poor understanding of local and indigenous people’s traditional forest rights and practices in forest PA (FPA) in Bangladesh (Mukul et al., Citation2018). Conventional approaches to manage the natural ecosystem have not been effective in the tropical region, hence resulted in largest forest area being converted into other land uses in the last two decades (Humayun-Bin-Akram & Masum, Citation2021). Hill forests of Bangladesh have been subjected to both deforestation and degradation, and are probably the most anthropogenically disturbed forest in the South Asia (Humayun-Bin-Akram & Masum, Citation2021; Mukul, Citation2014). To have a better understanding of the consequences of deforestation scenario before and after co-management in the hill FPAs of Bangladesh, Chunati Wildlife Sanctuary (CWS) under IUCN Protected Area Category IV and Lawachara National Park (LNP) under IUCN Protected Area Category II has been selected. They were selected purposively for studying the impact of new strategies (co-management) to protect the biodiversity as they have seen rapid and severe changes in settlement expansion over the last few decades.
Land-use changes, when incorporated into large and connected conservation networks especially for PA, provide practical and tangible solutions for species loss and adaptation with changing climate (Lopoukhine et al., Citation2012). The community participation to protect these areas has been changed over time. At present, there is a trend toward decentralization of management rights to communities and the public. As a part of this global change in management system, co-management was tried to adopt in the PA of Bangladesh in 2003 by NSP project, starting with five PA including Chunati Wildlife Sanctuary (CWS) and Lawachara National Park (LNP). Finally, practical and effective co-management approaches along institutional capacity development started through IPAC (2008–2013) project and end with CREL (2013–2018) project funded by USAID. These projects provide alternative opportunities for local communities to reduce the pressure on FPAs. This study is designed to assess the effect of co-management on biodiversity and land-use change between CWS and LNP from 1998–2008 and 2008–2018 and also to predict future trends in land-use change in these PA. Moreover, biodiversity comparison between CWS and LNP along micro-environmental gradient on temporal scale with vascular plants and birds has been performed on temporal scale as they are globally chooses indicator taxa for examining biodiversity status (Pereira & Cooper, Citation2006). The findings of this research provide policymakers a baseline for developing sustainable management plan for IUCN PA category-wise protection of biodiversity. Response of Wildlife Sanctuary and National Park will also contribute in forest department’s capacity in both categories to understand category-wise management deficiency for preventing further degradation of forest PAs.
2. Methods
2.1. Study area
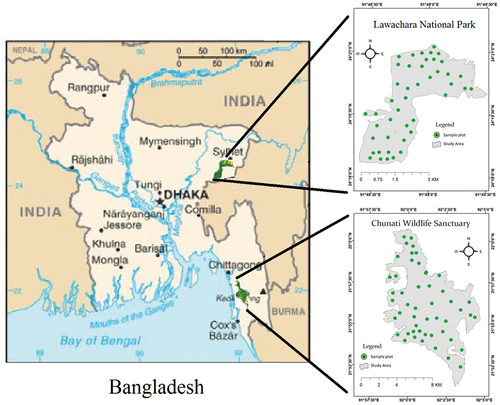
Chunati Wildlife Sanctuary (CWS) lies in the South-eastern part of Bangladesh. It is dissected by the Chittagong-Cox’s Bazar highway. CWS has an area of 77.64 km2 and is included in the IUCN Category IV PA. Its coordinates are 21°51′0″N to 22°01′11″N and 91°58′0″E to 92°04′57″E. On the other hand, Lawachara National Park (LNP) is situated at the North-eastern part of Bangladesh specifically, in Moulovi Bazar, Sylhet. LNP has an area of 12.5 km2 and is included in the IUCN Category II PA. Its coordinates are 24°19′11″N to 24°32′13″N and 91°47′1″E to 91°55′37″E ().
Figure 1. Location of the study area and sample plots inside.
2.2. Methodology for land-use change analysis
We have collected three set satellite images of 1998, 2008, and 2018 for both CWS and LNP (six imageries in total) from Landsat archive in the EarthExplorer services of the United States Geological Survey (USGS) website (http://earthexplorer.usgs.gov/). Bangladesh being a monsoon country remains cloudy for a fair part of the year. Thus, imageries from winter season were chosen to acquire cloud-free images for further analysis. The acquisition period of imageries is assumed to have minimal seasonal variation (Islam, Jashimuddin, et al., Citation2018). To execute supervised classification of satellite images, we used ArcMap 10.5 software. This software’s layer stacking feature was used to combine bands into a single composite layer. Using the sub-set tool, the CWS and LNP research areas were masked from the layer file. For better identification of the classification categories, all seven bands were merged together as the composite produce better quality false color images (Alemayehu, Citation2016). These signature files were used to do an automatic supervised classification of land use in 2009. For this, a statistically based maximum likelihood classification was applied. Based on the statistical parameters of the specified classes from the training data, this method calculates the likelihood. Every pixel is then allocated into the class depending on highest likelihood (Richards, Citation2013; Tillmann et al., Citation2012). A confusion matrix (also known as error matrix) was used to quantify image classification accuracy. To generate the confusion matrix, we applied ground truth data such cartographic data, the outcomes of manually digitizing image, and field work/ground survey findings collected with a GPS receiver.
Moreover, a trend analysis was performed by forecasting for next two decades (2028 and 2038) for each cover type. The job was made using forecasting function of Microsoft excel with the assumption that changes in future will continue as the change happened between 1998 and 2018.
2.3. Methodology for biodiversity change analysis
As biodiversity indicator, vascular plants and avifauna species were surveyed for comparison. To assess current tree species (>5 cm DBH) diversity 100 systematic sampling plots of (20 m × 20 m) 400 sq. m were set in both area (50 plots per study site) comprising 4 ha area in total. The plots were spaced minimum 200 m apart in a scientific design. Elevation at every plot’s center was recorded using GPS (Garmin).For saplings (<5 cm DBH and>1 cm DBH) diversity assessment 10 m × 10 m plots were established inside every tree plot. And within every sapling plot, two 2 m × 2 m plots were placed at random for seedling survey. So, for both site, 50 plots of 10 m × 10 m (a total of 5000 m2 per site) for sapling and 100 plots of 2 m × 2 m (a total of 400 sq. m per site) for seedling were sampled. In case of unidentified plants, help was taken from local guide and plant taxonomist of Bangladesh Forest Research Institute.
Bird communities were surveyed using point count technique (Bibby et al., Citation1992) at each vegetation plot. It was carried out with the hypothesis that each bird counted point will represent the floral structure of the related plot. Each study area was sampled for three consecutive days in order to complete 50-point counts. To eliminate observer bias, same observer (M.S.I.) conducted all bird survey job. All birds were documented that have been found within a 25-meter radius of every sampling point for a 10-minute period and duration of survey continues from 6:00 a.m. to 9:00 a.m. Survey was avoided in the days with precipitation or severe wind. Unidentified bird’s voice was recorded for recognition either by local guides or tropical bird sound card (Scharringa, Citation2005). Double counting of the same individual was avoided by keeping in mind the position of bird. Except for birds belonging to the Accipitridae family, flying birds were excluded from counting as they were seldom found perching in tree (K. M. Masum, A. Mansor, S. A. M. Sah, S. H. Lim, et al., Citation2017).
The current comparisons of species richness between FPAs were created by diversity indices, rank abundance curve, and rare fraction curve utilizing Microsoft Excel, Paleontological Statistics (PAST) Version 3.0. Importance value index (IVI) for all species of vascular plants and avifauna was produced. Current vegetation and avifauna data were compared with previous publication’s data for temporal change analysis.
2.4. Methodologies for micro-environmental variable sampling
To assess habitat, influence on biodiversity, percentage of canopy coverage, average height of canopy, elevation, and disturbance score for the respective plots were measured. Tree canopy cover percentage of each plot was assessed by spherical crown densitometer following Lemmon (Citation1957). Then, by averaging tree heights of a plot, a canopy height was calculated. Elevations for every plot were measured at the center of the plot utilizing hand-held GPS navigator. Finally, the quantity of visible disturbances in every plot was recorded by visual judgments of the collector. For measuring disturbance, a list of parameters was developed following Uddin et al. (Citation2013) and K. M. Masum, A. Mansor, S. A. M. Sah, S. H. Lim, et al. (Citation2017). Finally, 25 disturbance parameters (felling of trees>5 cm DBH, Illness and pest attack, vine (woody) attack, cutting of tree and shrubs, extraction of deadwood and fuelwood movement, boar disturbance, illness and pest attack, excavation, forest floor disturbed for wood chipping, path improvement, weeding, water work, canal/drainage/water movement, removal of alternative forest merchandise, chemical use, storm/collapsed stand, picnic/tourism activities, compaction by vehicles, discharge of garbage, landslides, clear felling, forest fire incidence, agricultural activities) were found to be present within the study plots. These parameters were given values between 0 and 3 based on their relative influence and intensity (Biohabitats, Citation2012). Disturbance score of total disturbance was calculated multiplying frequency and intensity of each disturbance. Study area wise (0.04 ha) descriptive statistics for percentage of canopy coverage, average canopy height, elevation, and disturbance score were carried out by SPSS. Canonical correspondence analysis (CCA) (terBraak, Citation1986) was used to pair vegetational traits with a second matrix of those four environmental variables to enumerate their interaction with plant communities.
The Pearson correlation was checked for eight vegetational traits and four environmental variables (A total of 12 variables, namely, tree average height, tree average diameter, tree species richness, tree abundance, sapling average height, seedling average height, seedling species richness, seedling abundance, elevation, canopy coverage, canopy height and disturbance score) with avifauna abundance (Appendix 6). Six variables, namely, canopy coverage, disturbance score, tree average diameter, sapling average height, seedling species richness, and seedling abundance were excluded as they have no correlation with avifauna abundance. The remaining six correlate variables were used in further analysis of Canonical correspondence to pair avifauna abundance with second matrix of those 12 habitat variables to enumerate the influence of habitat with bird communities.
3. Results
3.1. Land-use change scenarios of CWS and LNP from 1998 to 2018
and revealed that vegetation cover was decreasing (at an annual rate of 1.21%) during the period with traditional management (1998–2008) in CWS. On the other hand, it was found increasing (at an annual rate of 0.55%) during the decade of co-management (2008–2018) with overall negative results (at an annual rate of 0.36%) of forest degradation (1998–2018). In contrast, overall settlements area increased at an annual rate of 25.26% (1998–2018). Before 2008, it was 24% and after 2008 it was 7.6%. The trend of changes in the previous two decades indicates that vegetation cover will decrease at an annual rate of 0.06% while settlement area will increase at an annual rate of 0.36% in the next two decades (2018–2028, 2028–2038) in CWS (). Alarming event from biodiversity conservation point of view was the continued decrease (overall annual rate of decrease was 0.96%) of waterbody, though scenario during co-management was found better that it’s previous time. There was an increasing rate (at an annual rate of 4.02%) of barren area before 2008 but it was found to decrease after 2008 (at an annual rate of 2.31%) though overall there was an increased scenario (at an annual rate of 0.39%) during 1998–2018.
Figure 2. Land-use scenario of CWS and LNP in 1998, 2008 and 2018.
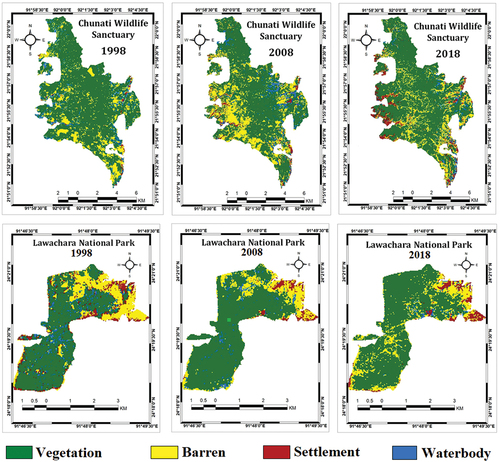
Figure 3. LUC scenario of CWS and LNP including the forecast for next two decades.
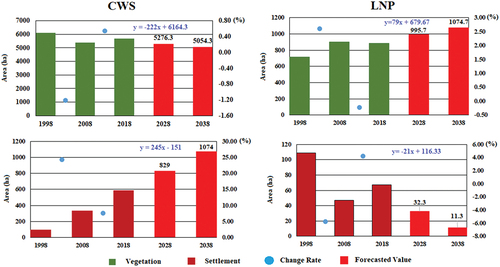
Table 1. Rate of change in land-use classes from 1998 to 2018.
Surprisingly, the status of forest cover change was worsened by deforestation (at an annual rate of 0.21%) and increase in settlement (at an annual rate of 4.26%) in LNP during the period of co-management (). But the overall changes over two decades for vegetation were found increasing (at an annual rate of 1.09%). As well as the overall changes for barren (at an annual rate of 0.62%) and settlements area (at an annual rate of 1.93%) in LNP were found decreasing. The trend of changes forecasted that vegetation cover will increase (0.1%/year) in contrast settlement area will decrease (0.58%/year) in the next two decades (2018–2028, 2028–2038) in LNP (). Another alarming matter is the overall decreasing rate (3.64% annually) of the waterbody, where both before and after of co-management showed negative scenarios.
The error matrix method has been implemented to access the accuracy of the six supervised images. Accuracy % of the LNP in 1998, 2008, and 2018 images were found 80.8%, 87.5%, and 87.2% (Appendix 1). Accuracy % of the CWS in 1998, 2008, and 2018 were found 81.8%, 88%, and 85.4% in the images, respectively.
3.2. Biodiversity status and change analysis of CWS and LNP
Species richness and abundance were found more in CWS than LNP for both plants and birds () except for sapling abundance (). Thus, the Stem/ha for sapling were more in LNP. As well the Basal Area/ha, values were found more in LNP for both trees and saplings ().
Figure 4. Rare fraction curves for biodiversity composition in CWS and LNP.
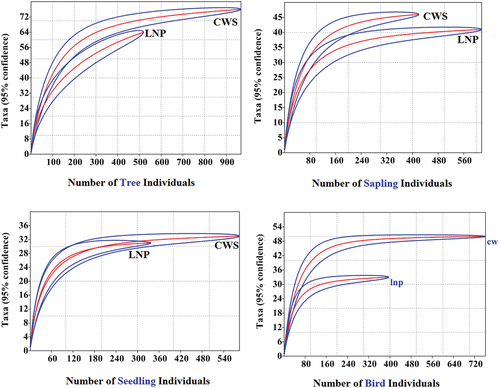
Table 2. Biodiversity composition of plant and bird species in CWS and LNP in Bangladesh.
The Simpson_1-D value for tree species for both CWS and LNP was equal (). But Dominance_D, Shannon H, Evenness_e^H/S, Equitability_J, and Chao-1 values for CWS were found higher than those of LNP for tree species. While the Simpson_1-D, Shannon_H, Evenness_e^H/S, Equitability_J, and Chao-1 values for sapling species in CWS were found higher than those of LNP and the Simpson_1-D value for seedling species for CWS and LNP were found equal. The Shannon_H, Evenness_e^H/S, Equitability_J, and Chao-1 values for LNP were found higher than CWS for seedling species. On the other hand, Simpson_1-D,Shannon_H, Evenness_e^H/S, Equitability_J, and Chao-1 values for bird species were all found higher for CWS. It indicates more diverse community and healthier ecosystem for bird species in CWS.
Table 3. Biodiversity indices of plants and birds in CWS and LNP in Bangladesh.
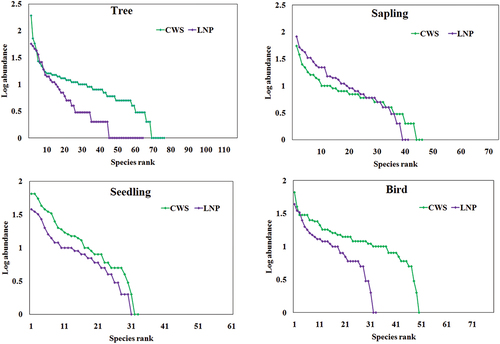
The rank abundance curves for tree species in CWS indicate high evenness and steep gradient of LNP indicates low evenness of their respective rank abundance curves (). Acacia auriculiformis (192) was ranked 1st for CWS and Artocarpus chaplasha (57) was ranked 1st for LNP. The curve for LNP sapling species showed steeper gradient than CWS which exhibit some species are found way too much than other species. Acacia auriculiformis (55) is ranked 1st in CWS and Tectona grandis (82) was ranked 1st for LNP as sapling species. The curve for seedling species in LNP showed shallow steep than the CWS which indicates that LNP has higher evenness. Alstonia scholaris (65) was ranked 1st for CWS and Xylia xylocarpa (38) was ranked first for LNP as seedling species. The rank abundance curve for bird species structure in LNP showed steeper gradient than that of CWS that represents LNP curve has lower evenness than the CWS curve. Gallus gallus (66) was ranked 1st for CWS and Megalaima asiatica (44) was ranked 1st in LNP as bird species.
Figure 5. Rank abundance curves for plant and bird community in CWS and LNP.
The important value index for tree species Acacia auriculiformis (20.87) has the highest IVI value for CWS and Paraserianthes falcataria (8.06) has the highest IVI value for LNP (Appendix 2). Acacia auriculiformis (13.66) has the highest IVI value for sapling species in CWS and Alstonia scholaris (8.65) has the highest IVI value in LNP (Appendix 3). For seedling species, Artocarpus lacucha (10.89) has the highest IVI value in the case of CWS. On the other hand, Xylia xylocarpa (12.50) has the highest IVI value in the case of LNP (Appendix 4).
3.3. Interaction of micro-environmental variables with plant communities
Plot-wise canopy coverage and canopy height were found to be higher in LNP (0.84 ± 0.11 and 22.95 ± 7.09, respectively). Canopy Coverage and Canopy Height were found lower in CWS (0.72 ± 0.18 and 14.07 ± 2.56, respectively). Elevation was found higher in LNP (16.14 ± 10.03) and lower in CWS (35.99 ± 12.79). However, Disturbance Score was found higher in CWS (13.38 ± 5.01) and lower in LNP (12.1 ± 6.93) (). With the exception of Disturbance Score, all the plot wise microhabitat environmental variables for LNP were greater than for CWS. Plant species traits were paired with a second matrix of four environmental variables using Canonical Correspondence Analysis. First two axes from the canonical correspondence test explained 71.99% and 26.53% of the variance in plant traits data, respectively. The tri-plot scores indicate that LNP site is influenced by canopy cover, canopy height, and elevation while CWS site shows the stronger relationship with disturbances score ().
Figure 6. Canonical correspondence analysis of a primary matrix of plant species traits with a second matrix of four environmental variables (CC- canopy coverage, CH- canopy height, EL- elevation, and DS- Disturbance score).
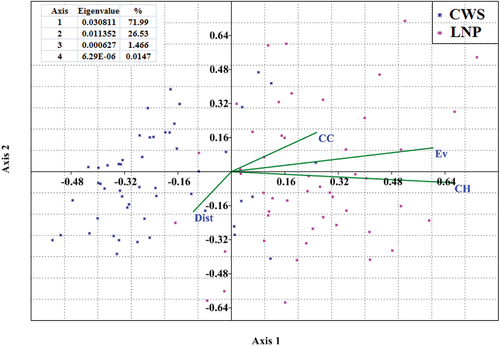
Table 4. Features of micro-habitat environmental variables in the studied areas.
3.4. Bird communities and their interaction with all habitat variables
Dicrurus aeneus has highest Frequency (3.67) and Relative Frequency (3.90) in CWS. Pycnonotus cafer has highest Frequency (3.25) and Relative Frequency (5.7) in LNP (Appendix 5). But Gallus gallus has highest number of individuals (66) in CWS and Megalaima asiatica has highest number of individuals in LNP.
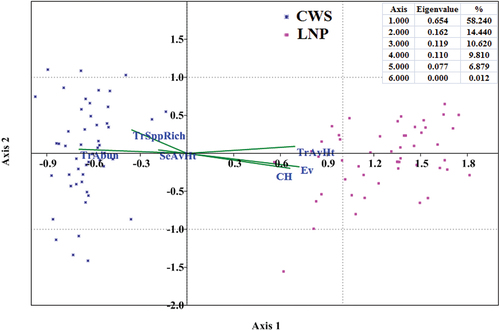
Canonical correspondence analysis was applied to pair total 79 species on both sites, bird species abundance with a second matrix of six correlated variables from plant species traits including environmental variables (). First two axes from the canonical correspondence test explained 58.24% and 14.44% of the variance in plant traits data, respectively. The tri-plot scores have shown that bird species abundance on CWS and LNP sites were intensely influenced by elevation, canopy height, tree average height, tree species richness, tree abundance, and seedling average height. Among those six variables, bird species richness is influenced by tree average height, elevation, and canopy coverage in LNP while in CWS it has showed the influence of tree species richness, tree abundance, and seedling average height. This implies that bird species abundance on both CWS and LNP sites were less affected by canopy coverage, tree average diameter, sapling average height, seedling average richness, and seedling abundance.
Figure 7. Canonical correspondence analysis of a primary matrix of bird species abundance with a second matrix of six correlated habitat variables (CH- Canopy height, SeAvHt- Seedling average height, EV- Elevation, TrSppRich-Tree species richness, TrAvHt- Tree average height, TrAbun- Tree abundance).
4. Discussion
4.1. Land-use change analysis
Land-use change analysis from supervised classification of CWS indicates that the vegetation cover area of CWS was found to be 6115 ha (72.46%) in 1998, 5375 ha (63.70%) in 2008, and 5671 ha (67.20%) in 2018 (), respectively. In Islam, Jashimuddin, et al. (Citation2018), land-use classes have been divided into 16 categories including Natural Forest, Mixed Forest and Forest Plantation categories represented vegetation cover. A comparison of three different years (2005, 2010, 2015) for these three vegetation cover categories represented 6041.07 ha in 2005, 4272.39 ha in 2010, and 7148.52 ha in 2015 (). M. Rahman et al. (Citation2016) investigated the land-use change from two broad categories – Forest and Non-Forest. Under Forest category, there were four sub-categories (Core, Edge, Patched, and Perforated). They found the Forest category to represent 5507 ha in 2005, 4051 ha in 2010, and 6438 ha in 2015 (). Similar study was found for CWS by (Islam, Rahman, et al., Citation2018) where four land-use categories (Vegetation, Agricultural land, vacant areas, and others) were used for supervised classification. They found forest category to represent 8257.77 ha in 2005, 6012.18 ha in 2010, and 6636.78 ha in 2015. The increase in forest area after the implementation of co-management might indicate its positive effect on land-use change.
Figure 8. Pattern of forest cover changes found in other studies.
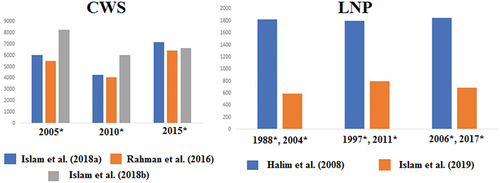
From the supervised classification results of this study, the vegetation cover area of LNP was found to be 726 ha (59.41%) in 1998, 903 ha (74.02%) in 2008, and 884 ha (72.40%) in 2018 (). Evaluation of land-use pattern change using remote sensing of West Bhanugach Reserved Forest (Lawachara, Chunati and Kalachara) was performed by (Halim et al., Citation2008). They found the vegetation cover of West Bhanugach Reserved Forest to be 1826.14 ha in 1988, 1799.37 ha in 1997, and 1847.83 ha in 2006. Hence, the results from Halim et al. study showed harmonious patterns with this study. So, the ups and downs in LNP were found regular and co-management practice failed to show any impact. Might be the betel leaf cultivation activities of indigenous community playing role in these ups and downs.
Another multi-temporal satellite imagery analysis was performed for LNP by K. Islam et al. (Citation2019). They found the forest area in their supervised classification to be 594.41 in 2004, 800.06 in 2011, and 690.08 in 2017. According to their study, forest cover in LNP rose dramatically from 2004 to 2011, but then declined sharply from 2011 to 2017. The experimental plantation inside LNP by the Bangladesh Forest Research Institute (BFRI) in 2005 could be credited with this short-term increase in forest cover. Remote-sensing technology has been used from last two decades with clear objective that it has the potential to support PA monitoring activities way better. CWS and LNP showed drastic forest cover loss during 2011–2017 and these high-tech approaches can provide valuable insights to investigate fragmentation and potential ecological network building and predict future trends for land use.
During their field visits, both BFD and BFRI personnel confirmed that some LNP damaged land was afforested, resulting in an increase in forest cover from 2004 to 2011. This increase in forest cover percentage in LNP, however, did not sustain the next few years. This study also showed increase in vegetation in 2008 (903 ha) compared to that of 1998 (726 ha), then declined in 2018 (884 ha) compared to that of 2008 (). The reason might be same as for the ups and downs of forest area.
From IPAC document, the plantation activity list was extracted which was collected from Chunati and Jaldi Range Office. The list stated that 120 ha plantation was carried out between 1993 and 1998, 75 ha during 1998–1999, 30 ha during 199–2000, 80 ha during 2001–2002, 85 ha during 2002– 2005, 50 ha during 2005–2008, and 118 during 2008–2009 in CWS. (Ahsan et al., Citation2016).
According to Islam, Jashimuddin, et al. (Citation2018), Forest plantation in CWS was 726.21 ha in 2005, 455.76 ha in 2010, and 485.30 ha in 2015. The above discussion explains the fact that despite the efforts of plantation activities, CWS faced further deforestation which has resulted in the lower portion of area occupied by forest cover. The trees planted in the plantation activities discussed above have now become low and low-to-moderate DBH-class and the domination of this class in CWS reflects that the Higher DBH class trees have been subjected to deforestation leaving CWS dominated by patches of low and medium DBH class Acacia trees.
For future prediction purposes, the supervised imagery analysis results of this study were forecasted using linear forecasting method. The vegetation cover of CWS will decrease and become 5276.3 ha in 2028. Then, it will further decrease and become 5054.3 ha in 2038. On the other hand, the vegetation cover under LNP will increase and become 995.7 ha in 2028. It will further increase and become 1074.7 ha in 2038. CWS Settlements area will increase and become 829 ha in 2028. It will continue increasing up to 2038 and become 1074 ha. LNP settlements area is expected to decrease and become 32.3 ha in 2028. It will further decrease up to 2038 and become 11.3 ha ().
The comparison of different studies showed that LNP present discontinuous pattern of land use but CWS showed continuous progress, which also have the potential to play a significant role in regional analysis to access the land-use trends for biodiversity conservation, which enables to implement better management practices. If we evaluate these management practices properly and then these practices being adopted uniformly, then it could be a useful source of information to know the effectiveness of these conservation practices and what actions need to be taken in order to improve the management structure.
4.2. Statistical analysis of plant and bird species
The rank abundance curve showed high evenness for tree, sapling, and bird community of CWS while LNP has higher evenness for seedling species (). There was no significant difference between the CWS and LNP rare fraction curves except sapling species of CWS were more diverse than LNP but lesser in number than LNP.
The rare fraction curves for bird species indicate CWS to be more diverse with higher number of individuals than LNP (). This might be because of the bigger size of CWS compared to LNP. Less disturbance in LNP compared to CWS might have contributed to the higher DBH class of LNP. This result is harmonious with (Nath et al., Citation2016), where they highlighted that CWS was understocked in terms of tree density and basal area when compared to data from other nations. The baseline scenario (planting activity in the beginning) of these PA, if handled with continuous management and monitoring, could produce better results with more plant and bird diversity.
During this study, 50 bird species were found in the fragments of CWS and 33 bird species were found in relatively less fragmented and more pristine LNP. Size of the PA category might have a role in this case. Moreover, this pattern is synergic with (Ulrich et al., Citation2016). According to their study, The Ngangao (39 species) and Chawia (38 species) forest fragments had the highest species richness, whereas the large and mostly pristine Mbololo fragment had the lowest (32 species).
4.3. Comparison between different study at temporal scale on CWS and LNP
From the observed Chao-1 values of tree and bird species of the two PAs, it is evident that the actual sampled number of species are close enough to their Chao-1 values to represent their respective areas. After analyzing Chao-1 values and species accumulation curve, it is evident that the tree and bird species richness data can be compared with other studies undertaken in different time intervals in the two PAs (). Studies were chosen based on their sampled areas close enough to the sampled area of this study.
In the case of CWS, 86 tree species were recorded by Rahman et al. (Citation2000) in 2000 while 78 tree species were recorded by S. S. Rahman and Vacik (Citation2015) in 2015. Nath et al. (Citation2016) recorded 93 tree species in 2016 and this study recorded 76 tree species in 2021 (). It is evident that the tree species richness is not declining significantly in CWS according to this secondary data analysis. This might because of sound management practice in CWS. In the case of LNP, Malaker et al. (Citation2010) recorded 78 tree species in 2010, (Mukul, Citation2014) recorded 66 tree species in 2014. Haider et al. (Citation2017) recorded 70 species in 2017 and this study recorded 64 species in 2021 (). All the number are very nearer meaning not declining significantly might be because of continuation of good management in community approach.
Figure 9. Tree and Bird species diversity changes scenario from 2000 to 2019 in the two protected areas.
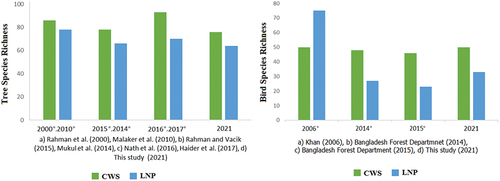
In the case of CWS, (Khan, Citation2006) recorded 50 primarily forest bird species in 2006, Bangladesh Forest Department, Bangladesh Bird Club and CREL Project in 2014 (Bangladesh Forest Department, Citation2014) and Bangladesh Forest Department, Bangladesh Bird Club and CREL Project in 2015 (Bangladesh Forest Department, Citation2015) recorded 48 and 46 bird species in 2014 and 2015 respectively. Thus, a little increase might be because of continuation of sound co-management practice. In the case of LNP, Khan (Citation2006) recorded 75 primarily forest bird species in 2006. Bangladesh Forest Department (Citation2014) and (Citation2015) recorded 27 and 23 bird species, respectively. This study recorded 33 bird species in 2021 (). A clear decrease from 2006 as well a positive change after 2014 indicates the better condition in the context of co-management.
The overall tree secondary data comparison with these study data are hence showing that the co-management approach prevalent in these two PAs has been effective in halting significant biodiversity loss. The co-management as a form of integrated management system, implemented in CWS, shows more positive impact to maintain bird biodiversity than in LNP.
The approach being used in this study provides different results depending on the region and subject to different types of limitation like economics of cost-benefit, societal needs, and demands are more dominant than biodiversity conservation especially in developing countries because they are still in the early stages of economic development (Brown growth). This phenomenon is evident because there is already a huge emphasis on socio-economic research and interventions in Bangladesh and a clear lacking in baseline data in ecological management. It will help to draw an inference about which co-management system is more useful.
5. Conclusion
PAs are crucial for preserving remaining tropical forest biodiversity, yet many of them are being deforested by people both within and outside of their administrative boundaries (Lee et al., Citation2007). Although there are enough studies on the effects of co-management on social and economic aspects of PA in developing countries like Bangladesh, there is a clear lack of baseline information on which effects of co-management on land-use and biodiversity change can be compared across PAs. Temporal land-use and biodiversity change patterns have also been recognized using other studies on these two PAs at different times. CWS co-management should be concerned with rapid settlements development and deforestation. Retaining higher DBH class trees and encouraging long rotation plantation in CWS can provide solution to this problem. Low DBH class of CWS trees also reflects the soil degradation problem in CWS due to landscape fragmentation. Hill urbanization should be banned in CWS and human activities inside the CWS should be considered as disturbances along with natural hazards, such as landslides and cyclones. Every PA provides unique ecosystem including endemic and rare species which may not be found anywhere else in the world. CWS and LNP co-management systems can learn and adapt from a stand and species (bird) structure point of view and assess how the ecological structure changed over time and exactly which aspects are needed to be addressed to ensure ecological sustainability. CWS has been identified in this study to provide suitable habitat conditions for bird species. Meanwhile, LNP lost a huge portion of its bird diversity. More studies on bird habitat shrinkage pattern under changing conditions is required to develop a better understanding on decrease in bird species richness in LNP. Strict supervision of environmental and forest laws is still imperative to ensure biodiversity conservation and sustainability in both CWS and LNP.
Acknowledgments
We are thankful to SUST Research Center, Bangladesh for funding the research (Research Grant Code - FES/2018/02/07). We express gratitude to Chief Conservator of Forest, Forest Department, Bangladesh for allowing us to make research work in the PAs. We also thank Sumit Chowdhury, Ramzan Ali for technical support during the data collection and processing.
Disclosure statement
The authors declare that they have no known competing financial interests or personal relationships that could have appeared to influence the work reported in this paper.
Additional information
Funding
References
- Ahsan, M. M., Aziz, N., & Morshed, H. M. (2016). Assessment of management effectiveness of protected areas of Bangladesh. SRCWP Project Bangladesh Forest Department.
- Akber, M. A., & Shrestha, R. P. (2015). Land use change and its effect on biodiversity in Chiang Rai province of Thailand. Journal of Land Use Science, 10(1), 1–21. https://doi.org/10.1080/1747423X.2013.807315
- Alemayehu, F. (2016). Land use and land cover change in the coastal area of WatamuMida Creek, Kenya. Open Journal of Forestry, 6(4), 230–242. https://doi.org/10.4236/ojf.2016.64019
- Areendran, G., Rao, P., Raj, K. R. I. S. H. N. A., Mazumdar, S., & Puri, K. A. N. C. H. A. N. (2013). Land use/land cover change dynamics analysis in mining areas of Singrauli district in Madhya Pradesh, India. Tropical Ecology, 54(2), 239–250.
- Bangladesh Forest Department. (2014). Resident forest bird monitoring 2014, Bangladesh bird club, Dhaka and USAID’s Climate-Resilient Ecosystems and Livelihoods (CREL) Project. October, 2014,
- Bangladesh Forest Department. (2015). Resident forest bird monitoring 2015, Bangladesh bird club, Dhaka and USAID’s Climate-Resilient Ecosystems and Livelihoods (CREL) Project. October, 2014,
- Bibby, C. J., Burgess, N. D., & Hill, D. A. (1992). Bird census techniques. Academic Press Ltd. https://doi.org/10.1016/B978-0-12-095830-6.50001-8
- Biohabitats, T. (2012). Forest ecological assessment. Virginia Tech. https://vtechworks.lib.vt.edu/handle/10919/63923
- FAO. (2015). The State of Food and Agriculture 2015 (SOFA): Social protection and agriculture: Breaking the cycle of rural poverty. Food and Agriculture of the UN.
- Haider, M. R., Bhowmick, N. G., Begum, N., Zashimuddin, M., & Hoque, M. A. (2017). Planting technique of Teli-garjan (DipterocarpusturbinatusGaertn.) and Dhaki-jam (SyzygiumfirmumThw.) in degraded hills of Chittagong, Bangladesh. Journal of Bioscience and Agriculture Research, 14(1), 1165-117. https://doi.org/10.18801/jbar.140117.143.
- Halim, M. A., Shahid, A., Chowdhury, M. S. H., Nahar, M. N., Sohel, M. S. I., Nuruddin, M. J., & Koike, M. (2008). Evaluation of land-use pattern change in West Bhanugach Reserved Forest, Bangladesh, using remote sensing and GIS techniques. Journal of Forestry Research, 19(3), 193–198. https://doi.org/10.1007/s11676-008-0044-1
- Hockings, M. (2006). Evaluating effectiveness: A framework for assessing management effectiveness of protected areas. IUCN.
- Humayun-Bin-Akram, M., & Masum, K. M. (2021). Forest degradation assessment of Ratargul special biodiversity protection area for conservation implications. Forestist, 70(2), 77–84. https://doi.org/10.5152/forestist.2020.20016
- Islam, K. N., Jashimuddin, M., Hasan, K. J., Khan, M. I., Kamruzzaman, M., & Nath, T. K. (2021). Stakeholders’ perception on conservation outcomes of forest protected area co-management in Bangladesh. Journal of Sustainable Forestry, 41(3–5), 240–256. https://doi.org/10.1080/10549811.2021.1899941
- Islam, K., Jashimuddin, M., Nath, B., & Nath, T. K. (2018). Land use classification and change detection by using multi-temporal remotely sensed imagery: The case of Chunati wildlife sanctuary, Bangladesh. The Egyptian Journal of Remote Sensing and Space Science, 21(1), 37–47. https://doi.org/10.1016/j.ejrs.2016.12.005
- Islam, K., Nath, T. K., Jashimuddin, M., & Rahman, M. F. (2019). Forest dependency, co-management and improvement of peoples’ livelihood capital: Evidence from Chunati Wildlife Sanctuary, Bangladesh. Environmental Development, 32, 100456. https://doi.org/10.1016/j.envdev.2019.100456
- Islam, K., Rahman, M. F., & Jashimuddin, M. (2018). Modeling land use change using cellular automata and artificial neural network: The case of Chunati Wildlife Sanctuary, Bangladesh. Ecological Indicators, 88, 439–453. https://doi.org/10.1016/j.ecolind.2018.01.047
- Jashimuddin, M., Islam, K. N., & Nath, T. K. (2021). Local level forest governance and conservation outcomes in a co-managed protected area of Bangladesh. Journal of Sustainable Forestry, 41(3–5), 302–318. https://doi.org/10.1080/10549811.2021.1933536
- Khan, M. M. H. (2006) Participatory bird survey to assess protected area management impacts: Second year report. August 2006. United States Agency for International Development (USAID), Bangladesh Forest Department (BFD), International Resources Group (IRG).
- Khera, N., Kumar, A., Ram, J., & Tewari, A. (2001). Plant biodiversity assessment in relation to disturbances in mid-elevational forest of Central Himalaya, India. Tropical Ecology, 42(1), 83–95.
- Lee, T. M., Sodhi, N. S., & Prawiradilaga, D. M. (2007). The importance of protected areas for the forest and endemic avifauna of Sulawesi (Indonesia). Ecological Applications, 17(6), 1727–1741. https://doi.org/10.1890/06-1256.1
- Lemmon, P. E. (1957). A new instrument for measuring forest overstory density. Journal For, 55, 667–668.
- Lopoukhine, N., Crawhall, N., Dudley, N., Figgis, P., Karibuhoye, C., Laffoley, D. Miranda Londoño, J., MacKinnon, K, and Sandwith, T. (2012). Protected areas: Providing natural solutions to 21st Century challenges. SAPI EN S Surveys and Perspectives Integrating Environment and Society, 5(2), 117–131.
- Malaker, J. C., Rahman, M. M., Azad Ud-Doula Prodhan, A. K. M., Malaker, S. K., & Khan, M. A. H. (2010). Floristic composition of Lawachara forest in Bangladesh. International Journal of Experimental Agriculture, 1(2), 1–9.
- Martinez, M. L., Perez-Maqueo, O., Vazquez, G., Castillo-Campos, G., Garcia-Franco, J., Mehltreter, K., Equihua, M., & Landgrave, R. (2009). Effects of land use change on biodiversity and ecosystem services in tropical montane cloud forests of Mexico. Forest Ecology and Management, 258(9), 1856–1863. https://doi.org/10.1016/j.foreco.2009.02.023
- Masum, K. M., Alam, M. S., & Abdullah Al-Mamun, M. M. (2008). Ecological and economical significance of homestead forest to the household of the offshore island in Bangladesh. Journal of Forestry Research, 19(4), 307–310. https://doi.org/10.1007/s11676-008-0055-y
- Masum, K. M., Islam, M. S., Parvej, M., Abdullah Al-Mamun, M. M., & Arfin-Khan, M. A. S. (2020). Biodiversity comparison between forest-protected and forest-reserved areas in Bangladesh in context of co-management for conservation. Forestist, 71(3), 134–147. https://doi.org/10.5152/forestist.2020.20023
- Masum, K. M., Islam, M. N., Saha, N., Hasan, M. Z., & Mansor, A. (2016). Assessment of land grabbing from protected forest areas of Bhawal National Park in Bangladesh. Landscape Research, 41(3), 330–343. https://doi.org/10.1080/01426397.2015.1078456
- Masum, K. M., Mansor, A., Sah, S. A. M., & Lim, H. S. (2017). Effect of differential forest management on land-use change (LUC) in a tropical hill forest of Malaysia. Journal of Environmental Management, 200, 468–474. https://doi.org/10.1016/j.jenvman.2017.06.009
- Masum, K. M., Mansor, A., Sah, S. A. M., Lim, S. H., & Hossain, M. K. (2017). Effect of differential forest management on biodiversity in a tropical hill forest of Malaysia and implications for conservation. Biodiversity and Conservation, 26(7), 1569. https://doi.org/10.1007/s10531-017-1318-8
- Mukul, S. A. (2014). Biodiversity conservation and ecosystem functions of traditional agroforestry systems: Case study from three tribal communities in and around Lawachara National Park. In Forest conservation in protected areas of Bangladesh (pp. 171–179). Springer. https://link.springer.com/chapter/10.1007/978-3-319-08147-2_8
- Mukul, S. A., Biswas, S. R., & Rashid, A. M. (2018). Biodiversity in Bangladesh. In S. A. Mukul, S. R. Biswas & A. M. Rashid (Eds.), Global biodiversity (pp. 93–103). Apple Academic Press.
- Nath, T. K., Jashimuddin, M., Kamruzzaman, M., Mazumder, V., Hasan, M. K., Das, S., & Dhali, P. K. (2016). Phytosociological characteristics and diversity of trees in a comanaged protected area of Bangladesh: Implications for conservation. Journal of Sustainable Forestry, 35(8), 562–577. https://doi.org/10.1080/10549811.2016.1231615
- Pereira, H. M., & Cooper, H. D. (2006). Towards the global monitoring of biodiversity change. Trends in Ecology & Evolution, 21(3), 123–129. https://doi.org/10.1016/j.tree.2005.10.015
- Pimm, S. L., Jenkins, C. N., Abell, R., Brooks, T. M., Gittleman, J. L., Joppa, L. N., Raven, P. H., Roberts, C. M., & Sexton, J. O. (2014). The biodiversity of species and their rates of extinction, distribution, and protection. Science, 344(6187). https://doi.org/10.1126/science.1246752
- Rahman, M. L., Hossain, M. K., & Karim, Q. M. N. (2000). Diversity and composition of tree species in Chunati wildlife sancturary of Chittagong forest division. Bangladesh Chittagong University Journal of Science, 24(1), 89–98.
- Rahman, M., Jashimuddin, M., Islam, K., & Nath, T. (2016). Land use change and forest fragmentation analysis: A geoinformatics approach on Chunati wildlife sanctuary, Bangladesh. Journal of Civil Engineering and Environmental Sciences, 2(1), 020–029. https://doi.org/10.17352/2455-488X.000010
- Rahman, S. S., & Vacik, H. (2015). Identify appropriate conservation strategies for rural people in Bangladesh. Journal Biodivers Manage Forestry, 4, 1. https://doi.org/10.4172/2327-4417.1000137
- Rashid, A. Z. M., Craig, D. G., & Mukul, S. A. (2017). Shifting paradigm of governance in the natural resources management of Bangladesh: a centralist to pluralistic approach in the forest protected areas management. In S. A. Mukul & A. Z. M. Rashid (Eds.), Protected Areas: Policies, Management and Future Directions (pp. 53–81). USA: Nova Science Publishers.
- Richards, J. A. (2013). Remote sensing digital image analysis (an introduction). Springer. https://doi.org/10.1007/978-3-642-30062-2
- Rozali, F. Z., Masum, K. M., Ahmad, A., Zakaria, R., Mansor, A., & Othman, A. S. (2017). An investigation onrattan taxonomic diversity in four selected forest reserves of northern Peninsular Malaysia. Tropical Ecology, 58(4), 731–739.
- Rozali, F. Z., Masum, K. M., Mansor, M. S., & Mansor, A. (2021). Rattan composition and diversity assessment in tropical rainforests of Peninsular Malaysia for conservation. Biodiversity and Conservation, 30(11), 2907–2928. https://doi.org/10.1007/s10531-021-02226-3
- Sala, O. E., Chapin, F. S., Armesto, J. J., Bloomfield, E., Berlow, J., Huber-Sanwald, R., Dirzo, E., Huenneke, L. F., Jackson, R. B., Leemans, A., Kinzig, R., Leemans, R., Lodge, D. M., Mooney, H. A., Oesterheld, M., Poff, N. L., Sykes, M. T., Walker, B. H., Walker, M., & Wall, D. H. (2000). Global biodiversity scenarios for the year 2100. Science, 287(5459), 1770–1774. https://doi.org/10.1126/science.287.5459.1770
- Samad, A., Raihan, F., & Masum, K. M. (2022). Urban growth assessment in the Northeastern region of Bangladesh for sustainable landscape management and conservation. Geology, Ecology, and Landscapes, 1–10. https://doi.org/10.1080/24749508.2021.2022831
- Scharringa, J. (2005). Birds of tropical Asia 3: Sounds and sights [CD-ROM]. Westernieland, Birds Songs International.
- Schneider, L. C., & Pontius, R. G., Jr. (2001). Modeling land-use change in the Ipswich watershed, Massachusetts, USA. Agriculture, Ecosystems & Environment, 85(1–3), 83–94. https://doi.org/10.1016/S0167-8809(01)00189-X
- terBraak, C. J. F. (1986). Canonical correspondence analysis: A new eigenvector technique for multivariate direct gradient analysis. Ecol, 67(5), 1167–1179. https://doi.org/10.2307/1938672
- Tillmann, C., Hölzel, N., & Völker, A. (2012). Supervised classification and change detection of agricultural land use in the forest steppe zone of West Siberia using multitemporal satellite imagery. M. Sc. thesis in the subject Landscape Ecology. University of Münster,P, 44.
- Uddin, M. B., Steinbauer, M. J., Jentsch, A., Mukul, S. A., & Beierkuhnlein, C. (2013). Do environmental attributes, disturbances and protection regimes determine the distribution of exotic plant species in Bangladesh forest ecosystem? Forest Ecology and Management, 303, 72–80. https://doi.org/10.1016/j.foreco.2013.03.052
- Ulrich, W., Lens, L., Tobias, J. A., Habel, J. C., & Umapathy, G. (2016). Contrasting patterns of species richness and functional diversity in bird communities of east African cloud forest fragments. Plos One, 11(11), e0163338. https://doi.org/10.1371/journal.pone.0163338
- Veldkamp, A., & Lambin, E. F. (2001). Predicting land-use change. Agriculture, Ecosystems & Environment, 85(1–3), 1–6. https://doi.org/10.1016/S0167-8809(01)00199-2
- Visconti, P., Butchart, S. H., Brooks, T. M., Langhammer, P. F., Marnewick, D., Vergara, S., Yanosky, A., & Watson, J. E. (2019). Protected area targets post-2020. Science, 364(6437), 239–241. https://doi.org/10.1126/science.aav6886