
 ?Mathematical formulae have been encoded as MathML and are displayed in this HTML version using MathJax in order to improve their display. Uncheck the box to turn MathJax off. This feature requires Javascript. Click on a formula to zoom.
ABSTRACT
Over the past few decades, water quality in aquatic ecosystems has been deteriorating steadily due to population growth, urbanization and industry expansion, discharge of municipal wastewater, and agricultural runoff into surface water sources. Wetlands of the Indo-Gangetic plain are disappearing continuously by several geo-genic and anthropogenic factors. The study focuses on the most important wetland ecosystems in the Malda district of the lower Gangetic plain in terms of area and socioeconomic value. The study aims to emphasize the land transformation around the selected wetlands, and to determine the current status of the water quality of the wetlands. From 2003 to 2018, the land use land cover (LULC) and land transformation of wetland areas were computed using geospatial data. The water quality of the wetlands has been measured at different sampling sites in pre- and post-monsoon seasons. The focus of the study is to identify the causal factors of the degradation and disappearance of wetlands. For the water quality index (WQI), on-site and laboratory analyses of the chosen parameters were conducted. Over the past 15 years, the built-up area increased by+98.08%, +90.32%, and +67.17%, while waterbody experienced a considerable negative change, with percentages of −21.30%, −26.83%, and −29.63% for the Chakla Beel, Chatra wetland, and Nayabandh wetland complex, respectively. The WQI revealed poor and very poor water categories at various wetland sites, under the WQI scores with 100–200 indicating “poor water” and 200–300 “very poor water.” The study analyzed the causes of the change in land use and alteration in water quality of selected wetland ecosystems.
Introduction
Wetlands are often referred to as “wealth-lands” for fulfilling various needs of a human being (Marambanyika & Beckedahl, Citation2016). They are one of the most efficient ecosystems, supporting millions of people with various goods and services. They carry out vital processes such as the decomposition of organic matter, release of nitrogen, sulphur, and oxygen movement of water in rivers and oceans and elimination of nutrients, sediments, and organic matters entering the wetlands. They hold various benefits in the form of fish, agriculture firewood, recreation, water supply; functions of an ecosystem like groundwater recharge, flood control, etc. Wetland holds a great significance to human beings as water is needed for various purposes like domestic agriculture, fishing, hydropower, industries, recreation, etc. Wetlands also have a great socio-economic value such as water supply firewood, medicinal plant, grazing, tourism, and many more. There are a number of ways in which residential wastewater poses a threat to ecological processes if it is not treated properly. Ecological impact, such as eutrophication, can occur when wastewater has a high concentration of nutrients. In addition to reducing the quantity of light that penetrates the water, it can stimulate the growth of aquatic vegetation. Population explosion, urban growth, agriculture, and industrialization have all led to more pollution from both point and non-point sources. Therefore, fresh and non-freshwater sources and soil are deteriorated by point pollution sources like combined sewer over flow, municipal, municipal separated (storm sewer system) wastewater and storm water, construction storm water, non-municipal (industrial) process/non-process wastewater and storm water, incidental vessel discharge, and constructed animal feeding operation. Hence, preserving the environment and reusing treated wastewater for irrigation, household, and industrial purposes necessitate the application of a suitable wastewater treatment system. Although modern waste treatment is an essential aspect of wastewater management, it has become less desirable in low-resource locations due to its high cost and stringent construction and operation requirements. To meet this demand, many facilities choose for natural treatment systems due to their inexpensive initial investment, low recurring costs, ease of operation, and high removal efficiency (M. E. Gabr et al., Citation2022, Citation2023; M. E. Gabr, Citation2020, Citation2022; M. E. S. Gabr, Citation2021; Salem et al., Citation2022).
Approximately 50% of all wetland was lost throughout the twentieth century (Kumari et al., Citation2019), with the greatest loss occurring in Asia. The use of chemical fertilisers and traditional aquaculture practices in the wetlands of South-east Asia are both major contributors to the deterioration of the wetland’s water quality (David et al., Citation2009; Eng et al., Citation1989; Salazar & Saldana, Citation2007; Tovar et al., Citation2000). Wastes from ongoing human activities (such as agricultural runoff, sewage dumping) are introduced into the wetlands, which may have an impact on the physico-chemical parameters from season to season (Jindal & Thakur, Citation2013; McDowell et al., Citation2004; Yadav et al., Citation2013). Therefore, the loss of wetlands had a severe adverse impact on biodiversity, ecosystem services, and social livelihoods. Due to the complexity of wetland ecosystems, when ecologically sensitive wetland areas are turned into other land uses, they cause the loss of a number of essential services that are often irreversible. Wetland degradation and conversion to other land uses are continuing (Singh et al., Citation2020), which has an adverse effect on not just biodiversity but also to the lives of people (Singha & Pal, Citation2023) who live in and around wetlands (Aung et al., Citation2021; Jamal, Ahmad, et al., Citation2022). The adverse effects on the ecological health of freshwater ecosystems are also associated with land use land cover (LULC) dynamics (Chopra et al., Citation2001; Mills et al., Citation2018; Roy et al., Citation2015), urbanization, acidification, sewage infiltration, insufficient water treatment systems, hydrological alteration (Ajmal et al., Citation2022; Ganaie et al., Citation2021; Leach et al., Citation2019; Markovic et al., Citation2017; Nissa & Bhat, Citation2016; Wang et al., Citation2019) and alien species invasion (Adebayo et al., Citation2011). Wetlands are disappearing around the world and that this could have negative environmental, socio-cultural, and economic effects, it is becoming clear that we need to take into account the different values of wetlands as soon as possible to better understand how this ecosystem works and to come up with sustainable ways to manage wetlands (Admiraal et al., Citation2013). The importance of wetlands to society may be shown by combining a better understanding of their direct socio-economic dependence with the indirect advantages that people receive from wetlands (Blackwell & Pilgrim, Citation2011), which can assist in creating community demands for their conservation, prudent use, and preservation (Merriman et al., Citation2018). Due to the expansion of agricultural land and subsequent rise in water demand, the building of dams, fast urbanisation, and the transformation of wetlands into other land uses (Jamal & Ahmad, Citation2020) wetlands are extremely susceptible in the Indian context (Pal & Talukdar, Citation2018a; Ghosh & Das, Citation2019). For instance, according to estimation, 2–3% of wetlands are lost annually (Prasher, Citation2018). The deterioration of wetlands is at higher pace in densely populated areas due to encroachments and waste disposals. Continuing with none other exceptions the decadence in Indo-Gangetic plain is extravagant particularity due to high population growth, demanding more food and infrastructure. The lower Gangetic plain is rich in wetlands, waterbodies, ox-bow lakes, channels, and streams as well as the floodplain wetlands are most threatened in the present time (Bhatt et al., Citation2007; Naskar et al., Citation2022) and depot of many floral and faunal species (Sinha et al., Citation2013). The wetlands of the floodplain region are full of resources like other wetlands of the world (Sarkar et al., Citation2020). The wetlands act as a platform for different types of macro and micro animals like birds, fishes, reptiles, amphibians, and Protozoa (Mukhopadhyay & Mazumdar, Citation2019). At the same time, the wetlands in the plain are rich in various resources which directly and indirectly support the wetland-dependent community living around the wetlands. The wetlands are home to a large range of ichthyofauna, avifauna, and hydrophyte floral diversity. The aim of this study is to provide a comprehensive assessment of wetland water quality using advanced statistical techniques to identify differences and similarities among various sampling sites under investigation, determine responsible factors for spatial variation, and analyze the effects of geogenic and anthropogenic factors on the physico-chemical parameters of the selected wetland. The analysis of wetland water quality is crucial in light of the current trend of wetland loss and the consequent decline in the resources they provide. Given the spatio-temporal changes that are likely to occur due to a variety of natural and human-induced factors, it is imperative to investigate the quality of water in these wetlands, to better understand their ecological functioning, and to design appropriate management strategies to protect and conserve these vital ecosystems. The results of this study will provide valuable insights into the current state of wetland water quality and will serve as a basis for future research in this important field.
Study area
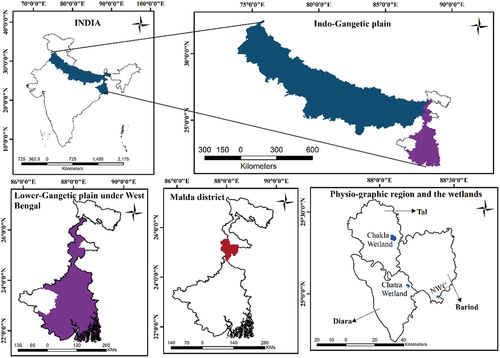
The Lower Ganga Plain consists of the Kishanganj tahsil of Purnea district (Bihar), the whole state of West Bengal (except the Purulia district and the mountainous portions of the Darjeeling district). The wetlands of lower Gangetic plains play a significant role in ensuring the health of the surrounding ecosystem (Mukherjee & Pal, Citation2018). In the Ganges–Brahmaputra flood plains of West Bengal, Assam, and Bangladesh, a wetland is a lake-like wetland with static water (as opposed to the flowing water of rivers and canals, which are termed khaals in Bengali). The Malda district of lower Gangetic floodplain in the Indian state of West Bengal has been selected as the study area . It is situated between latitudes 24°40‘20“N and 25°32’8“N and longitudes 87°45‘50“E to 88°28’10“E. The Ganga, Mahananda, Pagla, Punarbhaba, Kalindri, Tangon, and Fulahar are some of the prominent rivers in the study area. There is sufficient proof of lateral migration in the Ganga River (K. Mukherjee & Pal, Citation2018). Numerous oxbow lakes, palaeo-channels, back swamps (Bandyopadhyay et al., Citation2014), etc., are produced as a result of the river’s altered course but are no longer directly connected to the parent river (Singh et al., Citation2019). The entire district is divided into three physiographic zones, i.e.,, Tal, Diara, and Barind. Three wetlands have been considered in the present study, namely Chakla Beel from Tal region, having ample amount of water storage capacity and one of the largest wetland of this tract; Chatra wetland from Diara region, lies in the immediate vicinity of the English bazar municipality and only urban wetland which supports a large number of people of the surroundings; The Nayabandh wetland complex lies in the Barind region of the district is an important bird area (IN324-A1) and includes several seasonal wetlands, mainly Chalka, Bakla, Vikon, Morkatta, Mona, and Sirishdang, together formed this wetland. The Nayabandh wetland has socio-economic significance as it sustains the livelihood of people living around the wetland. The mapping of wetlands in the district by Space Application Centre in 2010 identified 4939 wetlands out of which 502 are more than 2.25 ha (NWIA, Citation2011). The present study deals with the assessment of land use land cover changes and water quality assessment of three major wetlands (Chakla Beel, Chatra wetland, and Nayaba wetland complex) of the district. The wetlands have been selected and mapped to examine tha spatio-temporal changes and their effect on water quality analysis of the wetlands in the study area. The wetlands were selected based on the area covered (>100 ha) and human dependency. Moreover, in the present study, a transformation map has been prepared for each wetland to get a detailed study of land transformation and find out the impact on water quality of the wetlands.
Figure 1. Layout of the study area.
Data and methodology
The present study is based on fieldwork and geospatial data. Geospatial data have been employed to assess the spatial changes in and around the wetlands of the study area, and a field survey has been carried out to analyse the water quality of the selected wetlands following a systematic lab procedure.
Geospatial data
Remote Sensing and Geographical Information System (GIS) techniques have been used for analysing the LULC and change detection of the selected wetlands that include a buffer 2 km radius. Satellite imageries Landsat 5 Thematic Mapper (TM) and Landsat 8 Operational Land Imager (OLI) have been downloaded from the United States Geological Survey (USGS) (https://glovis.usgs.gov/) for the years 2003 and 2018 (). Satellite imageries of 2003 and 2018 were downloaded for March and April, respectively. The months of March and April were suitable for obtaining the imageries because of the clear atmosphere and cloud-free sky in the concerned study area. Being already pre-processed data, no atmospheric correction or radiometric corrections were applied to the images. To remove the geometric incongruity, all the images of Landsat 5 TM and Landsat 8 OLI were co-registered to sub-pixel accuracy in ERDAS IMAGINE 14. The spatial resolution of Landsat 5 TM was 30 m, while spatial resolutions for Landsat 8 OLI were 15 m (using Pan Band). For image classification bands 2, 3, 4, 5, and 7 have been layerstacked and the panchromatic band was used to image sharpening. Image processing followed by supervised classification (with maximum likelihood classifier) was done in ArcGIS 10.5 and ERDAS IMAGINE 14. The change detection map of LULC has been prepared and the transformation matrix calculated for the period 2003 and 2018. Moreover, for gaining an intuitive knowledge of the study area, accuracy assessment, and ground truth have been done. A detailed account of the spatial dataset and classification scheme has been drawn through tabular form (). A flowchart of the study has been shown in .
Figure 2. Methodological flowchart adopted for LULC mapping.
Table 1. LULC classification scheme.
Table 2. Satellite data used in the study.
Accuracy assessment
For accuracy assessment, the common and ideal method is based on sampling theory. KAPPA coefficient (k) is a robust multivariate technique and is extensively used to assess inter-raster arrangement between categorical variables (Cohen, Citation1960), it takes into account all elements in the confusion matrix and not only the diagonal elements (Rosenfield & Fitzpatrick-Lins, Citation1986). Accuracy assessment of all LULC maps generated (2003 and 2018) was carried out through the development of an error matrix. For the accuracy measurement, a total of 200, 250, and 300 sample points were taken for each of the classified maps with four classes, five classes, and six classes respectively through stratified random sampling. For each of the wetlands, the maps were generated for the period between 2003 and 2018. Chakla Beel, Chatra wetland, and Nayabandh wetland complex depicts an overall accuracy of 89.66%, 92.04%, 90.41% for 2003 and 88.97%, 92.48%, 90.34% for 2018, kappa coefficient of the classified maps were 0.8181, 0.8986, 0.8479 for 2003 and 0.8121, 0.8944, 0.8319 for 2018, respectively (). Thus, in general, the accuracy of all the classified maps of the study area is acceptable (Anderson, Citation1976) and the results of LULC obtained can be considered reliable. The maximum accuracy among all the raster layers was shown by the Landsat 8 OLI (2018) image, which means that accuracy is dependent on the version of the dataset. Assessment of overall accuracy and Kappa coefficient of the raster dataset of the study area was computed by using the following statistical equations (Behera et al., Citation2023; Jamal et al., Citation2022; Khursheed et al., Citation2022):
Table 3. Error matrix and total accuracy (Chakla wetland).
Table 4. Error matrix and total accuracy (Chatra wetland).
Table 5. Error matrix and total accuracy (Nayabandh wetland complex).
where
r = number of rows in the error matrix
xii = the number of observations in row i and column i
xi+ = total of observations in row i
x+i= total observation in column i
Primary data for water quality
Sampling and physico-chemical parameters
To analyse the physico-chemical status of water, samples were collected from the selected wetlands for two-time seasons, i.e., pre-monsoon and post-monsoon. For pre-monsoon, the month of March and for post-monsoon the month of September has been considered. From each of the wetlands, three sites have been selected to collect the water sample based on proximity to settlement, mid of the waterbody and the edge of the waterbody. The sampling sites were marked by latitude and longitudinal extent in pre-monsoon and the same sites were identified in post-monsoon to collect the water sample (). A total of 11 physico-chemical parameters have each wetland for both seasons. These parameters are depth (m), water temperature (celsius), pH, electrical conductivity (μS/cm), TDS (mg/L), total hardness (mg/L), calcium concentration (Mg/L), magnesium concentration (Mg/L), total alkalinity (Mg/L), turbidity (NTU), and chloride (Mg/L). Reading of depth and temperature have been recorded on spot at the sites while the rest of the parameters have been tested in the laboratory. Further, interpolation map has been prepared to show the spatial variation in the wetlands by applying IDW interpolation method and the interpolation map of each parameter has been classified into seven classes under the “Natural Breaks (Jenks)” method (). The equation (EquationEq. 1(1)
(1) ) for Inverse Distance weighting (IDW) is as follows:
Figure 3. Sampling sites of the selected wetlands.
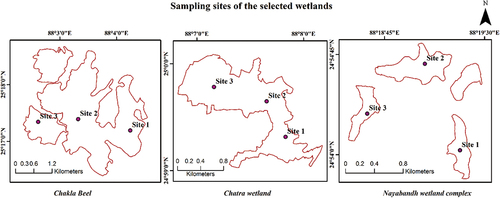
Figure 4. Methodological flowchart adopted for the water quality assessment.
where
n – Number of points used in the estimate
wi – Weight
zi – Value at point i
Water Quality Index method (WQI)
The water quality index was computed to assess the suitability of water for consumption (Ajmal & Jamal, Citation2023). The water quality index expresses the overall quality of water in a certain place and at a particular time. WQI is calculated on multiple water quality parameters and results in a single number, where it is simply determines the usable and non-usable of the water. In this study, the water quality index of each wetland has been calculated for the both seasons. To calculate the water quality index (WQI) five steps have been followed, i.e., assign weight (AWi), relative weight (RW), quality scale (Qi), sub-indices (SIi), and WQI values.
In the first step of the water quality index (WQI) was to assign the weight of each parameter. To assign a weight to each parameter a scale has been set up which ranges from 1 to 5. The relative weight of this scale increased from bottom to top, for example relative weight considered for TDS was 4 which indicate the maximum importance of WQI while 2 assigned for Alkalinity is the minimum importance of water quality assessment. Similarly, RW assigns for each of the parameters. The given weightages for each parameter was decided after understanding various past studies and the opinion of experts.
In the second step, relative weight (RW) was computed for each parameter by applying the following equation (EquationEq. 2(2)
(2) ):
where
RW = relative weight
AW = assign weight to each parameter
n = number of parameters
In the third step, a quality scale (Qi) has been assigned for physico-chemical analysis of each parameter (except pH). The limit of the scale has been set under the guideline of Bureau of Indian Standards (BIS). The equation (EquationEq. 3(3)
(3) ) for the quality scale is
Where
Qi= quality rating
Ci= concentration of each parameter (lab analysis)
To calculate the Qi of pH, following equation has been applied (EquationEq. 4(4)
(4) )
where
Qi= quality rating
Ci= concentration of each parameter (lab analysis)
Si= Standard values of parameters according to BIS and WHO
Vi= Ideal value for pH (7.0)
In the fourth step, to calculate the WQI, Si (Sub-indices) for each water quality parameter was calculated first and then was used for the calculation of WQI by using the following equation (EquationEq. 5(5)
(5) ):
Equation (EquationEq. 6(6)
(6) ) for WQI
where
SIi= Sub-indices of ith parameter
Qi=Quality rating based on ith parameter
n = number of parameters
At the fifth step the water quality index (WQI) values were classified into five categories as:
<50 = least contaminated zone
50–100 = moderately contaminated zone
100–200 = highly contaminated zone
200–300 = very high contaminated zone
>300 = Extremely contaminated zone
Results and discussion
Land use land cover dynamics and land transformation in and around the selected wetland environs of Malda district
Land use land cover of Chakla Beel
The present study includes about 4285.87 ha in and around the Chakla Beel (2 km buffer) to identify LULC change from 2003 to 2018 (, ). The analysis of the LULC dataset of 2003 reveals that about 431.54 ha area was occupied by built-up, 727.45 ha by waterbody, 2706.34 ha by agriculture and 420.54 ha by plantation. However, in year 2018, the area under built-up, waterbodies, agriculture, and plantation was 854.79 ha, 572.48 ha, 2442 ha and 416.60 ha respectively. Thus, registering an increase of 98.08% of the area in built-up and a significant decrease of −21.30%, −9.77%, and 0.94% in waterbody, agriculture, and plantation, respectively.
Figure 5. Land use land cover of Chakla Beel in 2003 and 2018.
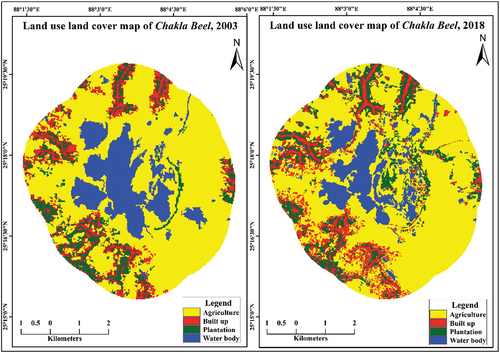
Table 6. Area under different classes in 2003 and 2018 (Chakla wetland).
Similarly, agricultural land has also decreased in 2018 with negative growth of −9.77% and occupied an area of 2442 ha. A slight change (−0.94%) in the plantation category has been found, as the area under plantation was 420.54 ha in 2003 which decreased significantly to 416.60 ha in 2018.
Land transformation in and around Chakla Beel
The analysis of shows a significant land use land cover change during the study period (2003–2018). The total area under built-up was 431.54 ha in 2003 and it increased to 854.79 ha in 2018, thus, gaining an area of 423.25 ha which revealed a tremendous rise of settlement, in the study area mainly due to the increasing population which is attracted by a vast area of agricultural land and huge waterbody. From the transformation matrix, it is clear that the built-up area gained 289.04 ha, 123.43 ha and 10.77 ha from agriculture, plantations, and waterbodies in the study period. It has been found that the agriculture, fishing, and gorgon nut cultivation are the major activities for a large number of populations to sustain their livelihood. Agriculture occupies 63.15% of the total area in the year 2003 and lost an area of 264.34 ha in the studied period and got transformed into a built-up, plantation, and waterbody of about 289.04, 209.6, and 106.41 ha, respectively. Plantation lost an area of 95.79, 123.43, and 3.91 ha to agriculture, built-up and waterbody from 2003 to 2018 (, ).
Figure 6. Change detection map of Chakla Beel (2003–2018).
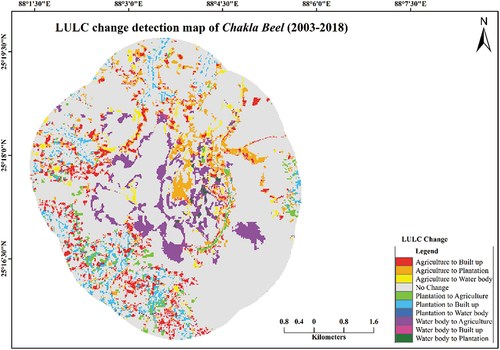
Table 7. Transformation matrix of Chakla wetland.
Although the large area of waterbodies supports most of the population who are directly or indirectly dependent on water resources for their livelihood, it lost an area of 244.95, 10.77, and 9.56 ha to agriculture, built-up and plantation respectively from 2003 to 2018 (, ).
Land use land cover of chatra wetland
The study involved mapping of about 3155.00 ha in and around the Chatra wetland of English Bazar to detect the change in different classes from 2003 to 2018 (). Study reveals that the area under LULC classes are built-up, agriculture, vegetation, waterbody, swamp, and wasteland (fallow lands, barren lands, open spaces, and land under airport authority) in the surroundings of Chatra wetland delineated as 763.00, 943.00, 943.00, 288, 197.00, and 237.00 ha in 2003. Similarly, in 2018 the area under built-up, agriculture, vegetation, waterbody, swamp, and wasteland was 1452, 886, 308, 211, 190, and 108 ha, respectively ().
Figure 7. Land use land cover of Chatra wetland in 2003 and 2018.
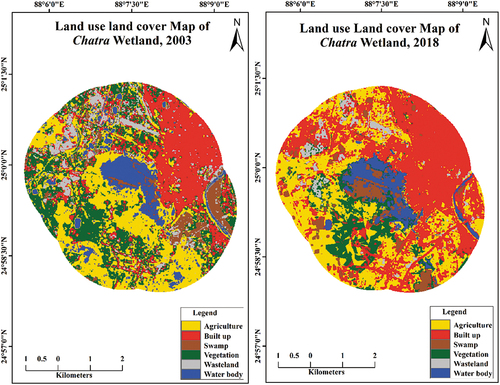
Table 8. Area under different classes in 2003 and 2018 (Chatra wetland).
Out of the six classes, built-up revealed a positive growth rate of 90.32% registering a tremendous growth rate which was significant around the wetland on its North-Eastern part owing to an increasing population with an increase in housing and infrastructure facilities in the built-up category and the remaining LULC categories, agriculture, vegetation, waterbody swamp, and wasteland depicted a negative growth rate of −6.02%, −57.64%, −26.83%, −3.52%, and −54.46.
Land transformation in and around Chatra wetland
The change analysis shows that a significant increase in the built-up class at the cost of remaining classes from 763.00 to 1452.00 ha during the studied period. In the district, although the agriculture is the main activity sharing a significant area where most of the population is dependent on agricultural activities to feed their dependent ones still agriculture lost an area from 886 ha to 943 ha in 2003 to 2018 from which 277, 171, 59, 89, and 11 ha got transformed to built-up, vegetation, waterbody, swamp, and wasteland. Vegetation lost from 727 ha in 2003 to 308 ha in 2018 to 183, 418, 4, 14, and 4 ha into built-up, agriculture, waterbody, swamp, and wasteland, respectively. A remarkable loss in the waterbody from 288 ha in 2003 to 211 ha in 2018 was observed transforming 33, 25, 20, 76 and 02 ha of the waterbody to built-up, agriculture, vegetation, swamp, and wasteland. The loss of the waterbody in the study area is directly related to human intervention and encroachment. The total area under swamp was 197 ha in 2003 and it decreased to 190 ha in 2018 and got converted into built-up, agriculture, vegetation, and waterbody. The wasteland has lost an area of 120 ha, 24 ha, 09 ha and 01 ha to built-up, agriculture, vegetation, waterbody, and swamp from 2003 to 2018 (, ).
Figure 8. Change detection map of Chatra Wetland (2003–2018).
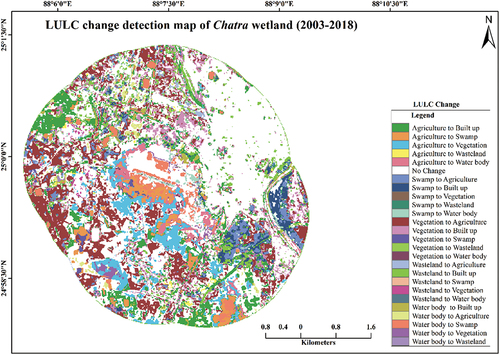
Table 9. Transformation matrix of Chatra wetland.
Land use land cover of Nayabandh wetland complex
The study involved mapping about 1625.32 ha in and around the Nayabandh wetland complex () of Habibpur block to detect the change in different LULC classes from 2003 to 2018. A total of five classes have been identified as agriculture, built-up, plantation, vegetation, and waterbody occupying 934.97, 132.00, 108.93, 172.06, and 277.37 ha in 2003. However, in the year 2018 agriculture, built-up, plantation, vegetation, and waterbody were found to 1022.21, 220.67, 70.14, 117.12, and 195.19 ha, respectively (). Here agriculture occupied more than 60% of the area. The probable cause for the maximum area under built-up in the study area can be associated with an increase in the growth rate of the population which in turn demand for housing and infrastructural facilities.
Figure 9. Land use land cover of Nayabandh wetland complex in 2003 and 2018.
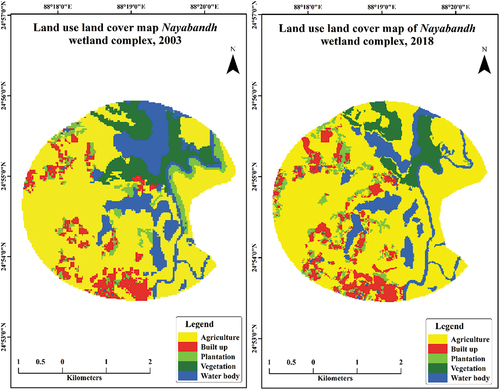
Table 10. Area under different classes in 2003 and 2018 (Nayabandh wetland complex).
A perusal of reveals in 2018 the area under built-up registered positive growth of 13.58% due to increasing housing and infrastructural facilities for an increasing population and agricultural land also slightly increased in 2018 with positive growth of 9.33% having occupied an area of 1022.21 ha as compared with 934.97 ha in 2003. Whereas, waterbody registered negative change of −29.63% and similarly significant negative change has been noticed in the category of plantation with −35.61% and occupied an area of 108.93 ha in 2003 and 70.14 ha in 2018. A negative change of −31.93% in the vegetation category has been found as the area under vegetation was 172.06 ha in 2003 which decreased significantly to 117.12 ha in 2018.
Land transformation in and around Nayabandh wetland complex
The transformation matrix shows that agriculture is the most occupied area among all classes where it gained 87.24 ha area from different classes, viz., plantation, vegetation, and waterbody as 69.43, 58.13, and 105.64 ha, respectively, in the assessment period. Built-up encroached on other classified categories at the amount of 65.08, 20.68, 2.21, and 0.69 ha, from agriculture, plantation, vegetation, and waterbody, respectively. Whereas plantation has lost an area of 69.43, 20.68, 0.03, and 4.34 ha to agriculture, built-up area, vegetation, and waterbody. Vegetation has lost its area to different classes at an amount of 58.13, 2.21, 5.73, and 4.99 ha to agriculture built-up plantations and waterbodies, respectively. Waterbody lost area of 105.64, 0.69, 1.01, and 9.64 ha and were converted to agriculture, built-up, plantation, and vegetation, respectively (, ).
Figure 10. Change detection map of Nayabandh wetland complex (2003–2018).
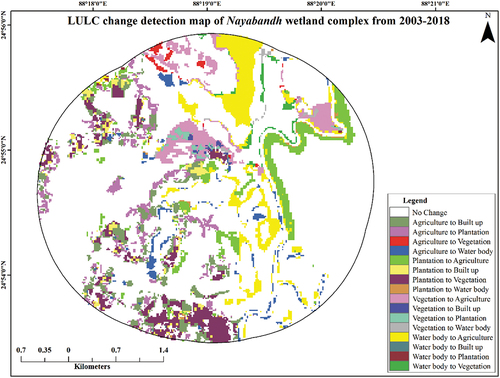
Table 11. Transformation matrix of Nayabandh wetland complex.
Water quality assessment of the selected wetlands
To fulfil the objectives of this study, this part deals with the physico-chemical analysis of water quality parameters from the sampled wetland for pre- and post-monsoon seasons. This section also includes a water quality index and anthropogenic activities around the waterbodies of the study area.
Physico-chemical analysis of Chakla Beel
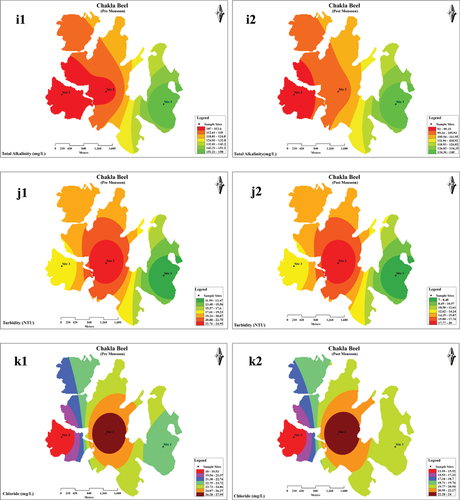
The Chakla Beel is one of the largest wetlands in the Tal tract. This wetland gets enlarged as it is fed by the rain water and gets water from the small channels of the Mahananda River. It has a significant slope and gets frequently inundated by rainwater during monsoon. The wetland acts as a water container because it soaks a significant amount of water from the Mahananda River and controls the flood as well as supports the livelihood for the wetland-dependent population living around the wetland. The physico-chemical parameters values of Chakla Beel water have been shown in . Spatial variation of water quality parameters of Chakla Beel during pre- and post-monsoon has been displayed through interpolation maps (a1–11k2).
Figure 11. (A1 to k2): Spatial variation of water quality parameters of Chakla Beel during pre- and post-monsoon. 1= pre-monsoon, 2= post-monsoon, a-Depth, b- Temperature, c- pH, d- Electrical conductivity, e-TDS, f- Total Hardness, g- Hardness (ca), h- Harness (mg), i- Total Alkalinity, j- Turbidity, k- Chloride.
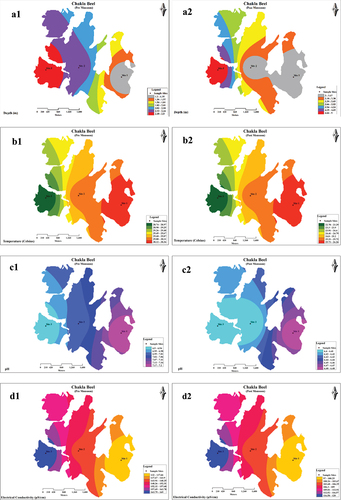
Figure 11. (Continued).
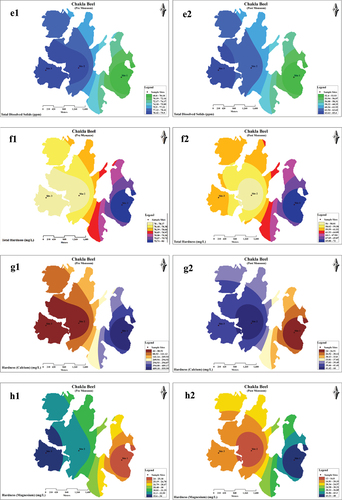
Figure 11. (Continued).
Chakla Beel has a significant depth in post-monsoon season which reaches up-to 5 m at site S3 and the minimum depth was recorded 1.2 m during pre-monsoon at site S1. The minimum recorded depth was 3 m at sites S1 and S2 for post-monsoon and maximum depth was 2.5 m measured at site S3 in pre-monsoon (; ). Due to its low-lying nature, this wetland never gets dried.
Variation in water temperature in Chakla Beel ranges from 22.78°C to 30.36°C, of which maximum recorded was 30.36°C and 26.27°C at site S1 in pre- and post-monsoon season. The minimum temperature recorded was 28.74°C and 22.78°C at site S3 during pre- and post-monsoon sequentially (; ).
Water chemistry is employed in wetlands classification systems as salinity and pH modifiers. Concentrations of primary ions such as calcium, magnesium, sodium, potassium, bicarbonate, sulfate, and chloride generally define inland water salinity. The interplay between rainfall, surface runoff, groundwater flow, evaporation, and evapotranspiration determines the saltiness of a wetland (Rahimi et al., Citation2023). The level of pH in the wetland inclined towards both acidic and basic water. The maximum pH values were recorded at 7.20 and 6.48 at site S1 in pre- and post-monsoon and the minimum pH was measured at site S3 was 6.90 and 6.41 in pre- and post-monsoon (; ).
The electrical conductivity (EC) of Chakla Beel was recorded between 97 and 169 μS/cm throughout the season. The maximum EC was observed at 169 and 120 μS/cm in pre- and post-monsoon at site S3, while the minimum was measured at132 and 97 μS/cm in pre- and post-monsoon at site S1, respectively (; ). The recorded EC was found highest in pre-monsoon and lowest in post-monsoon which was confined within the permissible limit proposed by BIS ().
Table 12. Standard limit and assign weights.
Table 13. Physico-chemical concentration values of water quality parameters at selected sites of the wetlands.
Total Dissolved Solids (TDS) in Chakla Beel varies from season to season. In the present study, the maximum TDS concentration was measured at 79.510−6 and 65.410−6 in pre- and post-monsoon at site S3. While, the minimum TDS concentration values were observed at 68.810−6 and 52.410−6 in pre- and post-monsoon at site S1 (; ). However, the concentration of TDS in Chakla Beel is healthy and within the permissible limit.
The total hardness (TH) of the wetland is considered soft water throughout the seasons. The maximum concentration of total hardness recorded was 80 and 72 mg/L at site S1, whereas the minimum noted values were to 78 and 56 mg/L at site S2 during pre- and post-monsoon season(; ). The total hardness concentration values of the Chakla Beel lie below the proposed limit by BIS.
Regarding calcium (ca) concentration measurement, it was found maximum at site S1 in pre-monsoon and at site S2 in post-monsoon as 56 and 44 mg/L, respectively (; ). The calcium concentration values were recorded were found within the acceptable limit (<75) recommended by BIS (). The estimated magnesium hardness concentration fluctuates from 12 to 48 mg/L through the wetland.
The observed magnesium (mg) concentration values exceed the acceptable limit proposed by BIS (30 mg/L) (). The maximum magnesium concentration was found at 34 mg/L at site S3 in pre-monsoon and 48 mg/L at site S1 in post-monsoon. The minimum Mg concentration value was measured in pre-monsoon and post-monsoon were 24 mg/L at S1 and 12 mg/L at S2, respectively (; ).
The present physico-chemical monitoring of Chakla Beel water shows the spatial variation in total alkalinity values were observed at different selected sites during pre- and post-monsoon from 92 to 158 mg/L. Maximum alkalinity value was measured at 158 mg/L at site S1 and 140 mg/L at site S1 in pre- and post-monsoon. While, minimum alkalinity was recorded at 107 and 92 mg/L at site S3 in pre- and post-monsoon (; , 11i2). However, the alkalinity concentration values of this wetland were found within the standard limit prescribed by BIS and WHO ().
In the Chakla Beel the recorded values of turbidity of each site exceeds the permissible limit prescribed by BIS and WHO (). The spatial variation of turbidity ranges from 7 Nephelometric Turbidity unit (NTU) to 25 NTU in the wetland. The maximum concentration of the turbidity value was recorded at site S2 for both the seasons. In pre-monsoon the maximum turbidity was measured at 25 NTU and in post-monsoon it was 20 NTU. While, the minimum turbidity concentration recorded was 11.99 NTU and 7 NTU at site S1 in pre- and post-monsoon sequentially (; ).
The concentration of chloride varied from 13 to 27 mg/L, which is within the recommended range prescribed by BIS. The maximum concentration of chloride was recorded at site S2, in pre-monsoon at 27.99 mg/L and in post-monsoon it was recorded 24 mg/L. While, the minimum concentration of chloride was recorded at site S3, in pre- and post-monsoon were 18 and 13.99 mg/L, respectively (; ).
Physico-chemical analysis of Chatra wetland
This is the only wetland in the district which is located on the periphery of the urban area. This wetland is considered as the lung for the inner-city region in the district. The physico-chemical parameters values of Chatra wetland water have been shown in . Spatial variation of water quality parameters of Chatra wetland during pre- and post-monsoon has been displayed through interpolation maps (a1–12k2).
Figure 12. (A1 to k2): Spatial variation of water quality parameters of Chatra Wetland during pre- and post-monsoon. 1= pre-monsoon, 2 = post-monsoon, a – depth, b – temperature, c – pH, d – electrical conductivity, e-TDS, f – total Hardness, g – hardness (ca), h – harness (mg), i – total alkalinity, j – turbidity, k - chloride.
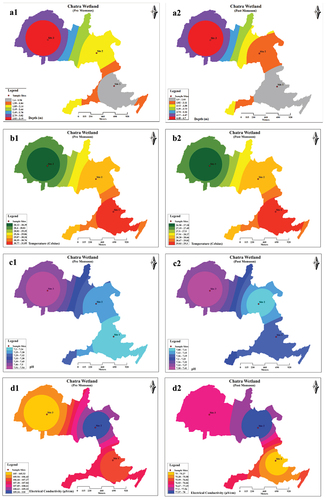
Figure 12. (Continued).
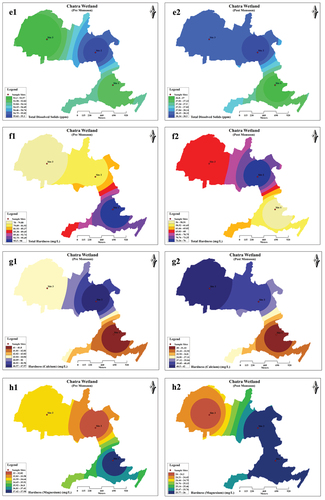
Figure 12. (Continued).
The depth of Chatra wetland fluctuates throughout the season due to surface runoff and municipal sewage. The maximum depths of this wetland were measured at 3.2 and 4.7 m in pre- and post-monsoon at the site S3 and the minimum depth were recorded at 1.4 and 2.5 m at site S1 in pre- and post-monsoon, respectively (; ).
The variation in temperature distribution ranges from 26.98°C as a minimum to 31.09°C as a maximum throughout the wetlands in different seasons. The maximum temperature was 31.09°C and 29.30°C in pre- and post-monsoon respectively at site S1, while the minimum recorded values were 28.12°C and 26.98°C at site S3 of pre- and post-monsoon seasons (; ).
The level of pH in the wetland inclined towards basic water. Although the pH level is acceptable but slightly high from its neutral value at all the selected sites throughout the seasons. The higher pH in water is considered basic water, the reason can be assumed for basic water in this wetland is mixing up off pollutants, chemicals, and municipal sewage from the surroundings. The maximum pH values were recorded at 7.54 and 7.41 at site S3 in pre- and post-monsoon, and the minimum pH was measured at site S1 was 7.18 and S2 was 7.08 in pre- and post-monsoon sequentially (; ).
Similarly, the maximum value of EC has measured at site S2 110 μS/cm and the minimum of 105 μS/cm at site S3 in pre-monsoon. While, the maximum EC was recorded at 78 μS/cm at site S2 and a minimum of 75 μS/cm at site S1 in post-monsoon season (; ). However, the range of electrical conductivity of Chatra wetland is within the standard limit set by BIS.
The fluctuation in the concentration of TDS has observed seen in the wetland, the maximum recorded reading was 55.3010−6 and 38.5010−6 at site S2 during pre- and post-monsoon. The minimum concentration of TDS was measured 53.3010−6 at site S3 in pre-monsoon and 36.8010−6 at site S1 in post-monsoon (; )
Total hardness in Chatra wetland varies from 56 to 98 mg/L throughout the different seasons. The maximum concentration of TH was 98 mg/L at site S1 and 76 mg/L at site S2 in pre- and post-monsoon, respectively. On the other hand, the minimum concentration of TH was recorded at 78 mg/L at site S3 and 56 mg/L at site S1 during pre- and post-monsoon (; ). However, the hardness of this wetland lies below the standard limit recommended by BIS and WHO ().
Similarly, the maximum calcium concentration values recorded in pre- and post-monsoon were 48 and 42 mg/L at site S2 and at site S3 respectively and minimum Calcium concentrations were recorded at site S1 in pre- and post-monsoon were 4 and 30 mg/L, respectively (; ). Calcium concentration in the wetland is within the acceptable limit (<75) proposed by BIS.
Another physico-chemical parameter of hardness as magnesium varied from 24 to 38 mg/L throughout the wetland in different seasons. Magnesium concentration in Chatra wetland exceeds from the acceptable limit (30 mg/L) during pre-monsoon prescribed by BIS (). The maximum magnesium concentration value was found at site S1 in both the seasons, 38 and 26 mg/L in pre- and post-monsoon, respectively. The minimum Mg concentration value measured 32 mg/L in pre-monsoon at site S2 and 24 mg/L at site S3 in post-monsoon (; ).
Regarding the total alkalinity, the values fluctuate from 142 to 178 mg/L at different sampling sites in pre-monsoon and 165 to 183 mg/L in post-monsoon. Maximum alkalinity was recorded at 178 and 183 mg/L at site S3 in pre- and post-monsoon and the minimum alkalinity was measured at 142and 165 mg/L in pre- and post-monsoon at site S2 (; i1, 12i2). The observed alkalinity of this wetland falls below the acceptable limit set by BIS and WHO ()
On the other hand, the turbidity of Chatra wetland extremely exceeds from the standard value recommended by BIS and WHO (). Maximum recorded turbidity was 33 NTU and 37 NTU in pre- and post-monsoon recorded at site S3. The minimum turbidity found at site S1 was recorded 26 NTU and 30 NTU in pre- and post-monsoon season (; ). The high turbidity in water is due to the presence of mud, clay, organic and inorganic decompositions in the wetland. Due to its urban vicinity, the wetland water is contaminated and severely turbid as a result of the unrestricted solid and liquid discharge of municipal and domestic waste as well as heavy siltation from construction sites.
In the present physico-chemical analysis of Chatra wetland water, the maximum chloride concentration was recorded at 18 and 22.99 mg/L in pre- and post-monsoon at site S3 and the minimum as 15 and 11.99 mg/L at site S2 in pre- and post-monsoon respectively (; ). The chloride concentration was within the acceptable range prescribed by BIS ().
Physico-chemical analysis of Nayabandh Wetland Complex (NWC)
The Nayabandh Wetland Complex (NWC) has its own unique characteristic in the district. The wetland is composed of many large and small waterbodies i.e., Chalka, Bakla, Vikon, Morkatta, Mona and Sirishdang. The wetland is situated near the Indo-Bangladesh border and extends upto Nayabandh Wetland. The Nayabandh wetland complex remains inundated during the monsoon season and are also fed by the major river like Tangon and Punarbhabha of the district. As wetland complex also lies between the Tangon and Mahananda Rivers and thus being connected with these rivers remains inundated during monsoon season. The key features of this wetland complex are a rich variety of aquatic vegetation and the shelter of migratory birds. This wetland has been considered as an important bird area and identified with 150 species of birds out of which 6 are globally threatened and 5 near threatened. Except for the bird species, 11 biome species have been identified in this wetland complex. Nayabandh wetland complex is designated as an IBA (IN324) for its value as a waterfowl habitat. If proper protection is provided, the NWC could host more than 20,000 waterfowl.
However, in the present study, the physico-chemical parameters of water have been analysed in the selected sites of this wetland. The parameters were measured from three separate points of this wetland due to its fragmented attribute. displays the physico-chemical properties of Nayabandh wetland complex water. Interpolation maps were used to show the spatial variation of parameters about water quality in NWC during the pre- and post-monsoon seasons ( to ).
Figure 13. (A1 to k2): Spatial variation of water quality parameters of Nayabandh wetland complex during pre- and post-monsoon. 1= pre-monsoon, 2= post-monsoon, a Depth, b – Temperature, c – pH, d – electrical conductivity, e – TDS, f – total hardness, g – hardness (ca), h- – harness (mg), i – total alkalinity, j – t urbidity, k – chloride.
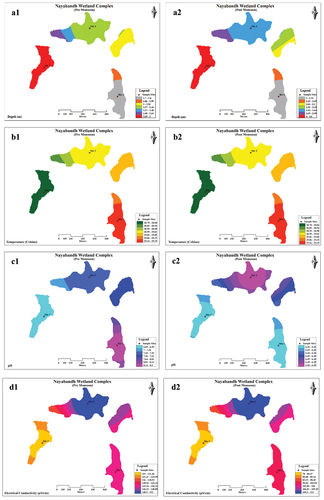
Figure 13. (Continued).
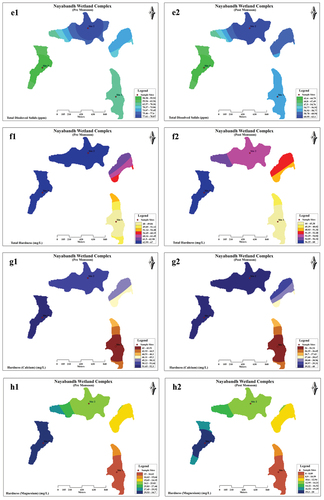
Figure 13. (Continued).
The depth of NWC varies from 1.7 to 4.6 meters throughout the seasons. The maximum depth was recorded 3 and 4.6 m in pre- and post-monsoon sequentially at site S3 (; ). The minimum depth was measured at 1.7 and 2 m during pre- and post-monsoon at site S1.
The water temperature of NWC slightly fluctuates from season to season; the maximum temperature was measured 29.19°C and 26.19°C in pre- and post-monsoon at site S1. While, the minimum temperature was recorded at 28.78°C and 24.00°C in pre-monsoon and post-monsoon at site S3 (; ).
The spatial variation in pH level value was observed from neutral to acidic as well as basic water. Although the pH level is acceptable but slightly high and sometimes low from its neutral value at the sampling sites throughout the seasons. The maximum pH values were recorded 8.20 at site S1 which is a bit high and 6.45 at site S2 in pre- and post-monsoon, respectively. The minimum pH values were measured at site S3 was 6.85 and 6.42 at sites S1 and S3 in pre- and post-monsoon season (; ).
The maximum EC was measured 152 and 113 μS/cm at site S2. While, the minimum was 119 and 78 μS/cm at site S3 in pre- and post-monsoon season (; ). However, the range of electrical conductivity of Nayabandh wetland complex is within the standard limit set by BIS ().
The fluctuation in TDS has been noticed in the wetland, the maximum of which was recorded at 78.8710−6 during pre-monsoon and 63.1010−6 during post-monsoon at site S2. The minimum concentration of TDS was measured 58.5810−6 and 43.4010−6 at site S3 in pre- and post-monsoon (; ).
Total hardness in Nayabandh wetland complex varies from 44 to 67 mg/L throughout the seasons. The maximum concentration values of TH were found 67 and 60 mg/L at site S3 in pre- and post-monsoon, respectively. On the other hand, the minimum concentration values of TH were recorded 48 and 44 mg/L at site S1 during pre- and post-monsoon period (; ). Overall, the hardness of this wetland lies below the standard limit recommended by BIS and WHO ().
Regarding the physico-chemical parameter of calcium, the maximum concentration recorded in pre- and post-monsoon was 52.30 and 40 mg/L, respectively, at site S3. On the other hand, minimum calcium concentration was found at site S1 in pre- and post-monsoon as 43 mg/L and 36 mg/L, respectively (; ). Calcium concentration in the wetland is within the acceptable limit (<75) proposed by BIS.
Another parameter of hardness as magnesium varied from 8 to 34.70 mg/L throughout the seasons. Magnesium concentration in Nayabandh wetland complex exceeds at some sites from the acceptable limit (30 mg/L) during pre-monsoon as prescribed by BIS (). The maximum magnesium concentrations recorded were 34.70 and 20 mg/L at site S3 in pre- and post-monsoon respectively. The minimum Mg concentrations measured in pre- and post-monsoon were 15 and 8 mg/L at site S1 (; ).
In the physico-chemical analysis of total alkalinity was found to fluctuate at the sampling sites during pre- and post-monsoon from 92 to 146 mg/L. It has been noticed that the alkalinity was always on the higher side in pre-monsoon as compared to post-monsoon in this wetland. The maximum alkalinity values were measured at 146 and 132 mg/L in pre- and post-monsoon at site S2. The minimum alkalinity values were recorded at 103 and 92 mg/L at site S1 in pre- and post-monsoon, respectively (; , 13i2).
In the NWC, the turbidity of each site exceeds the permissible limit prescribed by BIS and WHO (). The variation in Turbidity ranged from 15 to 69.99 NTU. The maximum turbidity was recorded at site S2 for both seasons. In pre-monsoon the turbidity was measured 60.99 NTU and in post-monsoon it was 66 NTU in terms of maximum value. The minimum turbidity concentration values were recorded 20.99 and 15 NTU at site S3 in pre- and post-monsoon sequentially (; ). Due to its proximity to the Punarbhava River, which feeds silt, sand, and fine particles, NWC experienced the high levels of turbidity; and also due to decreasing trend in its areal extent, NWC became increasingly fragmented and subject to a wide range of human activities. On the other hand, it is in the rural area and surrounded by vast agriculture land, the runoff from the fields make water more turbid.
The chloride concentration of this wetland varied from 11.99 to 23.99 mg/L and which is under the recommended range proposed by BIS (). The maximum concentration of chloride was found at site S2, in pre-monsoon the chloride concentration was measured 18 mg/L and in post-monsoon it was 23.99 mg/L at site S3. The minimum concentration of chloride was recorded at site S1, in pre- and post-monsoon the chloride concentration were found 14 and 11.99 mg/L, respectively (; ).
Water quality index analysis of the selected wetlands of Malda district
The purpose of using the water quality index (WQI) application in the present study is to assess the water quality by using the measurements of various water quality parameters at the selected sampling sites. A total of nine parameters were used to calculate the WQI for the selected wetlands in the district. The WQI was computed for both pre- and post-monsoon for each of the wetlands. The purpose of evaluating the water quality index is to inspect the water quality of the selected sites of each wetland. The considered parameters were, i.e.,, pH, electrical conductivity, total dissolved solids, total hardness, calcium concentration, magnesium concentration, total alkalinity, turbidity, and chloride. However, the Water Quality Index (WQI) values for Chakla Beel 62.02 to 100.98, Chatra wetland 107.65 to 139.10 and Nayabandh wetland complex 78.97 to 229.48 () throughout the seasons. WQI of each wetland has been classified into five categories under the rating scale.
Table 14. Water Quality Index (WQI) of selected sites of the wetlands.
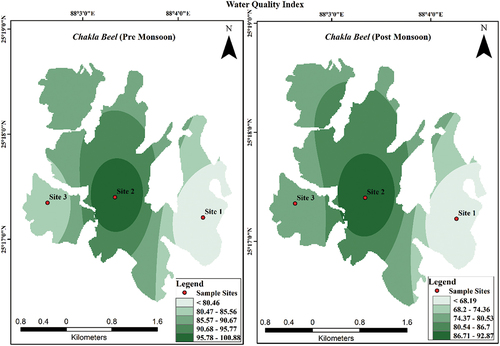
The Water Quality Index (WQI) values of the Chakla Beel were calculated to evaluate the overall quality of water. In the pre-monsoon, the WQI value was 100.98 at site S2, 81.75 at sites S3 and 75.5 at site S1. The sites S1 and S3 fall under moderately contaminated zone while, site S2 falls under highly contaminated zone in the pre-monsoon season. On the other hand, in post-monsoon the WQI values were falls under the moderately contaminated zone. The highest value was calculated for site S2 followed by S3 and S1, the WQI score of Chakla Beel were 92.87, 74.49, and 62.02, respectively (, ). The water quality parameters of Chakla Beel were within the standard limit preferred by BIS/WHO except for turbidity which exceeds from the permissible limit in both seasons and magnesium at S2 and S3 in pre-monsoon and at S1 in post-monsoon.
Figure 14. Water quality index of Chakla Beel.
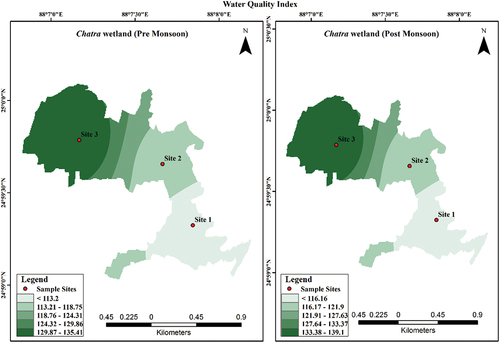
Chatra wetland is one of the threatened wetlands in the district due to its location. The WQI score of Chatra wetland falls under the highly contaminated zone in the rating scale ranging from 107.65 to 139.10 throughout the seasons. The WQI score in pre-monsoon was 135.41, 116.22, and 107.65 calculated for sites S3, S2, and S1, while in post-monsoon was 139.10, 118.64, and 110.43 at sites S3, S2, and S1, sequentially (, ). In the physico-chemical analysis of Chatra wetland water, the values of each parameter were within the proposed limit set by BIS/WHO except magnesium and turbidity at some sites. The magnesium concentration exceeded at sites S1, S2, and S3 as 38, 32, and 34 in pre-monsoon and the turbidity exceeded from the standard limit at all the sites throughout the seasons. Similarly, the pH of the Chatra wetland surpasses the neutral value in the wetland.
Figure 15. Water quality index of Chatra wetland.
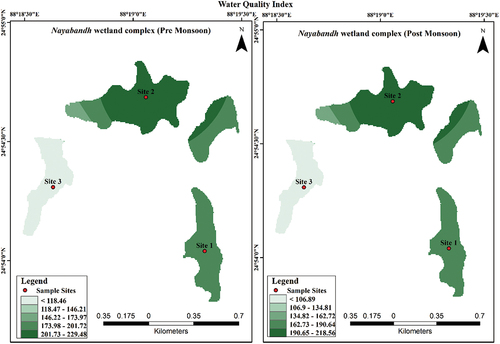
Nayabandh wetland complex is considered as the shelter of many bird species. The wetland is located along the Punarbhava River in the East and Tangon River in the west. It receives water during the post-monsoon by these rivers. However, the measured WQI score of this wetland falls under a very high contaminated zone, high contaminated zone, and moderately contaminated zone. In pre-monsoon at site S2 fall under a very high contaminated zone with 229.48 WQI scores followed by site S1 as high contaminated zone with 176.16 and site S3 as a moderately high contaminated zone with 90.70 WQI scores, respectively. Concerning post-monsoon, site S2 fall under a very high contaminated zone with 218.56 WQI scores followed by site S1 under a highly contaminated zone with 155.75 and S3 under a moderately high contaminated zone with 78.97 WQI scores sequentially (, ).
Figure 16. Water quality index of Nayabandh wetland complex.
Based on the above analysis, the selected wetland in the district falls under moderately high, highly contaminated, and very high contaminated classes as per the rating scale. Thus, the overall health of the wetlands is not in sound condition and is under alarming stress and there is an urgent need for taking care of this fragile ecosystem.
Range of water quality
The water quality index was classified into five categories, i.e., unsuitable for drinking (>300WQI), very poor (200WQI-300WQI), poor water (100WQI-200WQI), very good (50WQI-100WQI) and excellent water quality (<50WQI). The water quality index does not show the exact degree of pollution, rather it is used to assess the trend for water quality management (D. Mukherjee et al., Citation2012; Dubey et al., Citation2014; Ravikumar et al., Citation2013). However, the water quality status of selected wetlands calculated from the Water Quality Index (WQI) of each wetland extracted from .
Concerning Chakla Beel, the water quality status at site S2 in pre-monsoon falls under the poor water quality category, while the rest of the sites fall under very good quality. The WQI scores of this wetland were 75.35, 100.98, and 81.75 at sites S1, S2, and S3 in pre-monsoon, respectively (). On the other hand, the estimated WQI scores were 62.02, 92.87, 74.49 at sites S1, S2, S3 () respectively for post-monsoon season. However, this wetland is one of the largest wetlands in terms of area and water storage. The water quality status at site S2 was found of inferior quality in comparison to the estimated values of sites S1 and S3. Usually, this wetland is operating for fishing and gorgon cultivation, for which site S2 has a preferable depth for fishing and gorgon cultivation. Though the whole wetland is used for different activities, the central part (S2) experiences more coercion. Undoubtedly, the water of site S2 was found more polluted due to the use of chemicals, poisons, fertilizers, etc.
Table 15. Water Quality status of selected sites of the wetlands.
Regarding Chatra wetland, which is considered as the lung of Malda town is adjacent to the English Bazar Municipality and receives domestic sewage water regularly. The water quality status of this wetland falls under the poor water quality category for all the sites throughout the seasons. In pre-monsoon, the measured WQI score was 107.65 at site S1, 116.22 at site S2, and 135.41 at site S3, while in post-monsoon, the computed values were 110.43 at site S1, 118.64 at site S2, and 139.10 at site S3 (). This is the only wetland in the district which faces the most human intervention due to its peri-urban location than the rest of the wetlands. It receives point source pollution in the form of domestic sewage from the municipality wards. On the other hand, pisciculture, bird trapping, and duck keeping have been practiced in this wetland throughout the year.
In view of Nayabandh wetland complex, the WQI score has been computed and it shows that the wetland is under alarming threat. The water quality status of this wetland falls under poor and very poor water quality on the rating scale, except for site S3. The WQI of the Nayabandh wetland complex at site S1 was 176.16 and 155.75 () in pre-monsoon and post-monsoon season. While, the WQI score of site S2 was 229.48 and 218.56 in pre- and post-monsoon sequentially. On the other hand, S3 experiences the very good water quality in rating scale with 90.70 and 78.97 WQI score () in pre- and post-monsoon, respectively, while sites S1 and S2 have relatively poorer water quality than S3 due to human interventions. These two sites are located adjacent to the settlement which is much preferable for aqua farming. On the other side, the wetland receives a huge amount of toxic agricultural runoff and domestic effluents from the nearby households and deteriorating the water quality.
Anthropogenic activities in and around the wetlands of Malda
The result of the present study shows that the wetlands of the study area are heavily encroached by the built-up and agricultural land. With special reference to the Chatra wetland which is located in the immediate vicinity of the urban area are encroached by built-up (Jamal & Ali, Citation2021), transportation network, and ongoing construction of infrastructures, consequently dumping of domestic and municipal waste plays a significant role to reckless land filling in and around the wetland. On the other hand, the water quality of this wetland is unfit for drinking or domestic purposes due to several pollution factors. The high turbidity found in the wetland water is due to the presence of mud, clay, and organic and inorganic decompositions in the wetland. Due to its urban vicinity, the wetland water is contaminated and severely turbid as a result of the unrestricted solid and liquid discharge of municipal and domestic waste as well as heavy siltation from construction sites and human interventions. The magnesium concentration is also exceeding the acceptable limit and found to be hard water which indicates the wetland water is unfit for drinking and domestic purpose.
Considering the wetlands of rural part of the study area are surrounded by vast agricultural land causes the wetland area into cropland (Pal & Talukdar, Citation2018b). Still there is a land transformation around the wetlands by developing of infrastructure like brick kilns, roads, bridges, and residential area. Interference by the locals for different purposes plays a significant role in making the wetland water hazy. The rural wetland locations had substantial levels of turbidity caused by the agricultural runoff and soil erosion. Sometimes, ploughed croplands are the major source of turbidity in wetlands. The water quality analysis revealed that some sites of the selected wetlands surpassed the pH, turbidity, hardness (Ca and Mg), and alkalinity level due to existence of agricultural land around the wetlands which altered the water quality by its chemical runoff of pesticides, insecticides, fungicides, fumigants, etc. The deterioration in the water quality of the wetland (Chakla Beel) is also due to gorgon cultivation (Euryale ferox) which requires a significant amount of poisons, pesticides, and chemical fertilizers.
In respect of Chakla Beel under the Tal tract of the district is especially involved in gorgon cultivation which requires an excessive amount of chemicals to uproot the aquatic plants and eliminate the fish including other aquatic lives. On the other hand, use of chemicals, fertilizers, pesticides, mainly phosphorus and nitrogen from agricultural lands and phosphorus-based detergents from households, leads to an acceleration in eutrophication of the wetland. In the wetland of the Diara tract, it has been observed and studied that, the wetland experienced a havoc encroachment pressure due to the rapid growth of population. An abrupt increase of built-up in and around the wetland has been noticed. Regarding the wetland of the Barind tract, they are primarily used for irrigation due to being surrounded by extensive croplands. Illegal activities like poaching and hunting of aquatic resources including turtles and migratory birds have been noticed in the wetland of Barind region. At the same time, these wetlands are used for Pisciculture. The wetlands in the district are not free from human interference for various activities like overfishing, overgrazing, unscientific use of chemicals in the agricultural lands located around the wetlands, extraction of wetland water for irrigation, conversion of wetland area into agricultural land, filling, and fencing for duck keeping, dumping of wastes, etc.
Based on the findings of the present study, it is evident that the selected wetlands in the district are facing serious water quality issues. The use of the Water Quality Index (WQI) provides a comprehensive understanding of the overall quality of water by taking into account multiple parameters. However, despite the usefulness of WQI, it has certain limitations, such as it does not provide information about the source and nature of contaminants. Therefore, a possible model to improve the water quality of the selected wetlands could be the implementation of combined WQI with other techniques such as GIS mapping, remote sensing, and other advanced techniques to identify the sources and nature of contaminants, effective management practices, such as reducing anthropogenic activities near the wetlands, promoting sustainable land use practices, and implementing water conservation measures. Additionally, regular monitoring of water quality using WQI can help in early detection of any deterioration in water quality and enable prompt remedial actions. Community involvement and awareness campaigns can also play a vital role in the conservation of these valuable ecosystems.
Sustainable resource management
The rural economy depends heavily on wetlands as a source of natural resources. Naturally, the importance of wetlands and stakeholders’ role in conserving wetlands is significant from the perspectives of the economy and ecology. Education has previously been explored as a tool for wetland conservation in West Bengal and a participatory method might be used for better management to maintain the economy and the beel environment in the near future. Wetlands are used for a variety of functions and play a key part in the livelihoods of the local population living in the Gangetic flood plain of West Bengal, but due to enormous settlement pressure the wetlands are being lost. The Indo-Gangetic floodplain, which covers an area of 4.23 million sq. km, is one of the world’s largest and most productive river floodplains. It has significant cultural and economic importance. The primary means of subsistence for most people in the basin is agriculture, but there has been ongoing degradation of land, water, and biological resources as a result of overuse of groundwater, declining water tables, inefficient use and low productivity of surface water and rainwater resources, pollution, weak and inadequate water governance institutions and inadequate integration of crops, fisheries, and other production sectors. After agriculture, another major activity in the district is fishing, with about 60,000 MT produced by the district individually from inland waterbodies.
Over-extraction of aquatic resources led the wetlands into hazardous conditions. To strengthen the household’s economy, the dependent populations are directly and indirectly dependent on the wetland resources that cause severe damage to the wetlands. The household’s economy can be assisted by using the wetland resources in a sustainable way followed by fisheries development, alternate and additional income generation, institutional development, and community participation. A few remaining wetlands in the entire Gangetic plain are designated as wetland sanctuaries, yet despite this intervention, human pressures on these wetlands are rising. This is mainly an outcome of the undervaluation of the services that wetlands provide.
With respect to the wetlands of the district, they are very much rich in resources and support the livelihood settled around them. About two-thirds people are dependent on the wetlands to sustain their livelihood and engaged in different kinds of wetland practices like fishing, agriculture in wetland beds, resource collection, gorgon cultivation, etc. In the present study, the wetlands are losing their resources with increasing population pressure. Most of the wetland-dependent people do not have alternate income sources and are completely dependent on wetland resources to maintain their livelihood. However, in the present scenario, fish production in the district is quite unsatisfactory due to low water quality, multiple aquaculture practices in the wetlands, use of chemicals and poisons for gorgon cultivation, excessive drawing of water for irrigation, etc.
In and around wetland areas, it should be strictly forbidden to expand human settlements, set up industries, and build roads and railroads. The increasing number of brick kilns adjacent to the wetlands is a severe threat, and there must be a guideline for constructing such industries far from the biodiversity zone. The confined authority should be aware of the issue.
Setting up a buffer zone around the wetland’s perimeter and restricting human activity there could help in restoring the wetland’s natural functioning. This buffer zone should be filled with various plants, preferably ones native to the area. This helps trap nutrients, metals, sediments, invasive weeds, and other pollutants, and it makes it harder for humans to harm the area by making it harder to get to.
Dumping of household waste and agricultural runoff prevailed in the wetlands of the district. Sufficient sewage treatment plants must be installed across the wetland water to ensure indigenous sewage treatment and the restoration of these critical ecosystems. Resolving non-point source pollution issues with the help of the community and raising public awareness through initiatives for environmental awareness. Toxins from Washing Ghats, agricultural fields, and residential areas must be cleaned before they go into wetlands.
Mud extraction from the wetlands in the district is a common practice that is done to decorate their households and making of clay crafts. This activity takes the essential minerals out of the wetlands soil. A reduction in its uses should be made.
One of the factors that contribute to a decline in the overall quality of the water in wetland areas is jute retting. For the sake of maintaining a balanced and robust wetland environment, it needs to be managed and governed. Gorgon cultivation is a lucrative aqua crop in the district especially practiced in the wetlands of the Tal region. Before cultivation, farmers apply poisons and chemicals to kill fish and other wetland species. The concerned department must concentrate on the specific problem before it is too late. We anticipate that this research will provide policymakers with information they can use to understand better the wetland ecosystem scenario in Malda district and the associated changing LULC patterns, as well as to develop policies for preserving and enhancing the ecological integrity of these aquatic ecosystems in an accurate, and environmentally sustainable manner. The data on the current state of the district’s wetlands is quite insufficient. Thus, it is necessary to immediately create a database on the different types of wetlands, surface water quality, socioeconomic dependency, livelihood dynamics, hydrology, biodiversity, and land change systems in the ecosystems. This kind of database assists in identifying and highlighting the aquatic ecosystems’ stress.
Conclusion
The Malda district, located in the northern part of West Bengal, India, is home to a variety of water features, including lakes, wetlands, lowlands, cut-off meanders, and ox-bow lakes. These waterbodies play a crucial role in maintaining the ecological balance of the region and contribute significantly to human health and well-being. Riparian wetlands, in particular, are of immense social and environmental significance as they provide essential ecosystem services such as water filtration, flood control, and nutrient cycling.
However, the wetlands in Malda district are facing severe threats due to human activities, primarily the construction of residential buildings, roads, farms, and disposal sites in and around the waterbodies. The encroachment, earth filling, agricultural runoff, and waste dumping in and around the wetlands have contributed to the deterioration of the waterbodies, making them one of the most degraded and altered ecosystems in the region.
A land-use and land-cover (LULC) study conducted between 2003 and 2018 revealed that the area covered by waterbodies have shrunk significantly over the years due to built-up and infrastructural development in and around the waterbodies. The wetlands have been heavily encroached upon for residential purposes, construction of brick kilns, and earth filling for agricultural practices, leading to a reduction in their area and quality.
Furthermore, the current study also revealed that the surrounding land cover of the wetlands have been converted from one category to another over time, leading to the deterioration of the wetland ecosystem’s water quality. The wetlands are facing several threats, including toxic runoff from agricultural activities and household pollutants, the collection of water resources, extraction of wetland water for irrigation, spreading of poisons for killing fishes and aquatic species before aquaculture, dumping of household wastes, fishing, poaching, hunting, recreational activities, encroachment, and others.
To understand the water quality status of the three wetlands, of which two were located in rural areas, namely Chakla Beel and Nayabandh wetland complex, and one in the urban area, namely Chatra wetland revealed that water quality status of the wetlands mostly fell under the poor and very poor categories.
Overall, the study concludes, that urgent efforts, actions, and appropriate strategies are needed to monitor the wetlands in the Malda district. Continuous water quality monitoring is necessary for the ecological sustainability of the wetlands of the lower-Gangetic plains. Limnological characterization and eco-zonation plans can be supplemented with regular monitoring to ensure the long-term conservation of these vital ecosystems. Such efforts are crucial for maintaining the ecological balance and ensuring the well-being of the people who depend on these ecosystems.
Disclosure statement
No potential conflict of interest was reported by the author(s).
Additional information
Funding
References
- Adebayo, A. A., Briski, E., Briski, E., Kalaci, O., Hernandez, M., Ghabooli, S., & MacIsaac, H. J. (2011). Water hyacinth (Eichhornia crassipes) and water lettuce (Pistia stratiotes) in the great lakes: Playing with fire? Aquatic Invasions, 6(1), 91. https://doi.org/10.3391/ai.2011.6.1.11
- Admiraal, J. F., Wossink, A., de Groot, W. T., & de Snoo, G. R. (2013). More than total economic value: How to combine economic valuation of biodiversity with ecological resilience. Ecological Economics, 89, 115–122. https://doi.org/10.1016/j.ecolecon.2013.02.009
- Ajmal, U., & Jamal, S. (2023). A remote sensing and gis-based approach for assessment of drinking water quality and its association with land-use land-cover in Azamgarh city, India. In A. Rahman, S. S. Roy, S. Talukdar, & S. Fahad (Eds.), Advancements in Urban environmental studies: application of geospatial technology and artificial intelligence in urban studies (pp. 431–444). Springer International Publishing.
- Ajmal, U., Jamal, S., Ahmad, W. S., Ali, M. A., & Ali, M. B. (2022). Waterborne diseases vulnerability analysis using fuzzy analytic hierarchy process: A case study of Azamgarh city, India. Modeling Earth Systems and Environment, 8(2), 2687–2713. https://doi.org/10.1007/s40808-021-01237-x
- Anderson, J. R. (1976). A land use and land cover classification system for use with remote sensor data (Vol. 964). US Government Printing Office.
- Aung, T. D. W., Kyi, S. W., Suzue, K., Theint, S. M., Tsujita, K., Yu, T. T., Merriman, J. C., & Peh, K. S. H. (2021). Rapid ecosystem service assessment of a protected wetland in Myanmar, and implications for policy development and management. Ecosystem Services, 50, 101336. https://doi.org/10.1016/j.ecoser.2021.101336
- Bandyopadhyay, S., Kar, N. S., Das, S., & Sen, J. (2014). River systems and water resources of West Bengal: A review. Geological Society of India Special Publication, 3(2014), 63–84.
- Behera, D. K., Jamal, S., Ahmad, W. S., Taqi, M., & Kumar, R. (2023). Estimation of soil erosion using RUSLE Model and GIS tools: A study of chilika lake, Odisha. Journal of the Geological Society of India, 99(3), 406–414. https://doi.org/10.1007/s12594-023-2324-y
- Bhatt, B., Gupta, V., Kumar, L., Singh, I. S., & Sarkar, B. (2007). Euryale ferox (Salisb): Promising aquatic food crop of eastern indo gangetic plains. International Journal of Current Microbiology and Applied Sciences, 6(6), 1914–1921. https://doi.org/10.20546/ijcmas.2017.606.223
- Blackwell, M. S., & Pilgrim, E. S. (2011). Ecosystem services delivered by small-scale wetlands. Hydrological Sciences Journal, 56(8), 1467–1484. https://doi.org/10.1080/02626667.2011.630317
- Chopra, R., Verma, V. K., & Sharma, P. K. (2001). Mapping, monitoring and conservation of Harike wetland ecosystem, Punjab, India, through remote sensing. International Journal of Remote Sensing, 22(1), 89–98. https://doi.org/10.1080/014311601750038866
- Cohen, J. (1960). A coefficient of agreement for nominal scales. Educational and Psychological Measurement, 20(1), 37–46. https://doi.org/10.1177/001316446002000104
- David, C. P. C., Siringan, F. P., Reotita, J. M., Zamora, P. B., Villanoy, C. L., Sombrito, E. Z., & Azanza, R. V. (2009). Coastal pollution due to increasing nutrient flux in aquaculture sites. Environmental Geology, 58(2), 447–454. https://doi.org/10.1007/s00254-008-1516-5
- Dubey, R. K., Hussain, J., Malhotra, N., & Mehta, A. (2014). Ground water quality and water quality index of dwarka district of national capital of India. International Journal of Research in Engineering and Technology, 3(04), 2321–7308.
- Eng, C. T., Paw, J. N., & Guarin, F. Y. (1989). The environmental impact of aquaculture and the effects of pollution on coastal aquaculture development in Southeast Asia. Marine Pollution Bulletin, 20(7), 335–343. https://doi.org/10.1016/0025-326X(89)90157-4
- Gabr, M. E. (2020). Design methodology of a new surface flow constructed wetland system, case study: East South EL-Kantara region North Sinai, Egypt. Port-Said Engineering Research Journal, 24(1), 23–34. https://doi.org/10.21608/pserj.2020.19040.1016
- Gabr, M. E. S. (2021). Proposing a constructed wetland within the branch drains network to treat degraded drainage water in Tina plain, North Sinai, Egypt. Archives of Agronomy and Soil Science, 67(11), 1479–1494. https://doi.org/10.1080/03650340.2020.1799353
- Gabr, M. E. (2022). Design methodology for sewage water treatment system comprised of Imhoff‘s tank and a subsurface horizontal flow constructed wetland: A case study Dakhla Oasis, Egypt. Journal of Environmental Science and Health, 57(1), 52–64. https://doi.org/10.1080/10934529.2022.2026735
- Gabr, M. E., Al-Ansari, N., Salem, A., & Awad, A. (2023). Proposing a wetland-based economic approach for wastewater treatment in arid regions as an alternative irrigation water source. Hydrology, 10(1), 20. https://doi.org/10.3390/hydrology10010020
- Gabr, M. E., Salem, M., Mahanna, H., & Mossad, M. (2022). Floating wetlands for sustainable drainage wastewater treatment. Sustainability, 14(10), 6101. https://doi.org/10.3390/su14106101
- Ganaie, T. A., Jamal, S., & Ahmad, W. S. (2021). Changing land use/land cover patterns and growing human population in wular catchment of Kashmir Valley, India. GeoJournal, 86(4), 1589–1606. https://doi.org/10.1007/s10708-020-10146-y
- Ghosh, S., & Das, A. (2019). Urban expansion induced vulnerability assessment of East Kolkata wetland using fuzzy MCDM method. Remote Sensing Applications: Society and Environment, 13, 191–203. https://doi.org/10.1016/j.rsase.2018.10.014
- Jamal, S., & Ahmad, W. S. (2020). Assessing land use land cover dynamics of wetland ecosystems using Landsat satellite data. SN Applied Sciences, 2(11), 1–24. https://doi.org/10.1007/s42452-020-03685-z
- Jamal, S., Ahmad, W. S., Ajmal, U., Aaquib, M., Ashif Ali, M., Babor Ali, M., & Ahmed, S. (2022). An integrated approach for determining the anthropogenic stress responsible for degradation of a Ramsar site–Wular lake in Kashmir, India. Marine Geodesy, 45(4), 1–28. https://doi.org/10.1080/01490419.2022.2034686
- Jamal, S., & Ali, M. A. (2021). Remote sensing application for exploring land use and land cover dynamics in and around Chatra wetland, English Bazar, West Bengal. Creative Space, 9(1), 15–27. https://doi.org/10.15415/cs.2021.91002
- Jamal, S., Malik, I. H., & Ahmad, W. S. (2022). Dynamics of urban land use and its impact on land surface temperature (LST) in Aligarh City, Uttar Pradesh. In R. Singh (Ed.), Re-envisioning advances in remote sensing (pp. 25–40). CRC Press. https://doi.org/10.1201/9781003224624
- Jindal, R., & Thakur, R. K. (2013). Diurnal variations of plankton diversity and physico-chemical characteristics of rewalsar wetland, Himachal Pradesh, India. Recent Research in Science and Technology, 5(3), 4–9.
- Khursheed, V., Jamal, S., & Ahmad, W. S. (2022). Impact assessment of land use land cover dynamics and population growth on food security of Kashmir Valley, India. In M. Rani, B. S. Chaudhary, S. Jamal, & P. Kumar (Eds.), Towards sustainable natural resources: Monitoring and managing ecosystem biodiversity (pp. 123–149). Springer International Publishing.
- Kumari, T., Singh, R., & Verma, P. (2019). Agriculture, forest and environmental management trinity: Towards environmental sustainability and climate change mitigation. Tropical Ecology, 60(2), 306–310. https://doi.org/10.1007/s42965-019-00025-0
- Leach, T. H., Winslow, L. A., Hayes, N. M., & Rose, K. C. (2019). Decoupled trophic responses to long‐term recovery from acidification and associated browning in lakes. Global Change Biology, 25(5), 1779–1792. https://doi.org/10.1111/gcb.14580
- Marambanyika, T., & Beckedahl, H. (2016). Wetland utilisation patterns in semi-arid communal areas of Zimbabwe between 1985 and 2013 and the associated benefits to livelihoods of the surrounding communities. Transactions of the Royal Society of South Africa, 71(2), 175–186. https://doi.org/10.1080/0035919X.2016.1152520
- Markovic, D., Carrizo, S. F., Kärcher, O., Walz, A., & David, J. N. (2017). Vulnerability of European freshwater catchments to climate change. Global Change Biology, 23(9), 3567–3580. https://doi.org/10.1111/gcb.13657
- McDowell, R. W., Biggs, B. J. F., Sharpley, A. N., & Nguyen, L. (2004). Connecting phosphorus loss from agricultural landscapes to surface water quality. Chemistry and Ecology, 20(1), 1–40. https://doi.org/10.1080/02757540310001626092
- Merriman, J. C., Gurung, H., Adhikari, S., Butchart, S. H., Khatri, T. B., Pandit, R. S., Thapa, I., Thomas, D. H. L., & Thapa, I. (2018). Rapid ecosystem service assessment of the impact of Koshi Tappu Wildlife Reserve on wetland benefits to local communities. Wetlands Ecology and Management, 26(4), 491–507. https://doi.org/10.1007/s11273-017-9587-2
- Mills, K., Vane, C. H., dos Santos, R. A. L., Ssemmanda, I., Leng, M. J., & Ryves, D. B. (2018). Linking land and lake: Using novel geochemical techniques to understand biological response to environmental change. Quaternary Science Reviews, 202, 122–138. https://doi.org/10.1016/j.quascirev.2018.09.038
- Mukherjee, D., Dora, S. L., & Tiwary, R. K. (2012). Evaluation of water quality index for drinking purposes in the case of Damodar River, Jharkhand and West Bengal region, India. Journal of Bioremediation & Biodegradation, 3(9), 161. https://doi.org/10.4172/2155-6199.1000161
- Mukherjee, K., & Pal, S. (2018). Channel migration zone mapping of the river Ganga in the diara surrounding region of Eastern India. Environment, Development and Sustainability, 20(5), 2181–2203. https://doi.org/10.1007/s10668-017-9984-y
- Mukhopadhyay, S., & Mazumdar, S. (2019). Habitat-wise composition and foraging guilds of avian community in a suburban landscape of lower Gangetic plains, West Bengal, India. Biologia, 74(8), 1001–1010. https://doi.org/10.2478/s11756-019-00226-x
- Naskar, M., Sarkar, U. K., Mishal, P., Karnatak, G., Saha, S., Bandopadhyay, A., Das, B. K., Das Ghosh, B., & Das, B. K. (2022). Assessing vulnerability of wetland fisheries to climate change: A stakeholders’ perception-based approach. Climate and Development, 14(7), 600–616. https://doi.org/10.1080/17565529.2021.1956410
- National Wetland Atlas: INDIA. (2011) . SAC/EPSA/ABHG/NWIA/ATLAS/34/2011. space applications centre (ISRO). Ahmedabad, India.
- Nissa, M., & Bhat, S. U. (2016). An assessment of phytoplankton in nigeen lake of Kashmir Himalaya. Asian Journal of Biological Sciences, 9(1–2), 27–40. https://doi.org/10.3923/ajbs.2016.27.40
- Pal, S., & Talukdar, S. (2018a). Application of frequency ratio and logistic regression models for assessing physical wetland vulnerability in Punarbhaba river basin of Indo-Bangladesh. Human and Ecological Risk Assessment: An International Journal, 24(5), 1291–1311. https://doi.org/10.1080/10807039.2017.1411781
- Pal, S., & Talukdar, S. (2018b). Drivers of vulnerability to wetlands in Punarbhaba river basin of India-Bangladesh. Ecological Indicators, 93, 612–626. https://doi.org/10.1016/j.ecolind.2018.05.043
- Prasher, K. (2018, November 8). The state of India’s disappearing 919 wetlands. The Weather Channel India. https://weather.com/en-IN/india/news/news/2018-11-08-the-case-of-indiasdisappearing-wetlands
- Rahimi, M., Zarei, M., Keshavarzi, B., Golshani, R., & Zafarani, S. G. G. (2023). Water quality stress to Amirkalayeh wetland, Northern Iran. Environmental Monitoring and Assessment, 195(1), 49. https://doi.org/10.1007/s10661-022-10691-8
- Ravikumar, P., Aneesul Mehmood, M., & Somashekar, R. K. (2013). Water quality index to determine the surface water quality of Sankey tank and Mallathahalli lake, Bangalore urban district, Karnataka, India. Applied Water Science, 3(1), 247–261. https://doi.org/10.1007/s13201-013-0077-2
- Rosenfield, G. H., & Fitzpatrick-Lins, K. (1986). A coefficient of agreement as a measure of thematic classification accuracy. Photogrammetric Engineering and Remote Sensing, 52(2), 223–227.
- Roy, P. S., Roy, A., Joshi, P. K., Kale, M. P., Srivastava, V. K., Srivastava, S. K., Dwevidi, R., Joshi, C., Behera, M., Meiyappan, P., Sharma, Y., Jain, A., Singh, J., Palchowdhuri, Y., Ramachandran, R., Pinjarla, B., Chakravarthi, V., Babu, N., Gowsalya, M. … Kushwaha, D. (2015). Development of decadal (1985–1995–2005) land use and land cover database for India. Remote Sensing, 7(3), 2401–2430. https://doi.org/10.3390/rs70302401
- Salazar, F. J., & Saldana, R. C. (2007). Characterization of manures from fish cage farming in Chile. Bioresource Technology, 98(17), 3322–3327. https://doi.org/10.1016/j.biortech.2006.07.003
- Salem, M., Mohamed, E. L., Mossad, M., & Mahanna, H. (2022). Random forest modelling and evaluation of the performance of a full-scale subsurface constructed wetland plant in Egypt. Ain Shams Engineering Journal, 13(6), 101778. https://doi.org/10.1016/j.asej.2022.101778
- Sarkar, U. K., Mishal, P., Borah, S., Karnatak, G., Chandra, G., Kumari, S., Das, B. K., Debnath, D., Yengkokpam, S., Das, P., DebRoy, P., Yadav, A. K., Aftabuddin, M., Gogoi, P., Pandit, A., Bhattacharjya, B. K., Tayung, T., Lianthuamluaia, L., & Das, B. K. (2020). Status, potential, prospects, and issues of floodplain wetland fisheries in India: Synthesis and review for sustainable management. Reviews in Fisheries Science & Aquaculture, 29(1), 1–32. https://doi.org/10.1080/23308249.2020.1779650
- Singha, P., & Pal, S. (2023). Wetland transformation and its impact on the livelihood of the fishing community in a flood plain river basin of India. The Science of the Total Environment, 858, 159547. https://doi.org/10.1016/j.scitotenv.2022.159547
- Singh, S., Bhardwaj, A., & Verma, V. K. (2020). Remote sensing and GIS based analysis of temporal land use/land cover and water quality changes in harike wetland ecosystem, Punjab, India. Journal of Environmental Management, 262, 110355. https://doi.org/10.1016/j.jenvman.2020.110355
- Singh, S., Kanhaiya, S., Singh, A., & Chaubey, K. (2019). Drainage network characteristics of the ghaghghar river basin (GRB), son valley, India. Geology, Ecology, and Landscapes, 3(3), 159–167. https://doi.org/10.1080/24749508.2018.1525670
- Sinha, S., Basu, L. K., Halder, A., & Chakraborty, T. (2013, February). A case study on the changing pattern of wetlands in West Bengal and its possible impacts on groundwater resources. In Workshop on Sustainable development and management of ground water in West Bengal and future of irrigation vis-a-vis arsenic contamination in ground water. Central Ground Water Authority & Central Ground Water Board Eastern Region, Kolkata (Vol. 19).
- Tovar, A., Moreno, C., Manuel-Vez, M. P., & Garcı́a-Vargas, M. (2000). Environmental implications of intensive marine aquaculture in earthen ponds. Marine Pollution Bulletin, 40(11), 981–988. https://doi.org/10.1016/S0025-326X(00)00040-0
- Wang, H., Mao, L., Lu, S., Ying, J., Jiang, Q., Yuan, R., Zhao, D., Wang, M., & Zhao, D. (2019). What determines the change of lakes in large cities under climate change and anthropogenic activities? Evidence from Eastern China. Polish Journal of Environmental Studies, 28(3), 1949–1956. https://doi.org/10.15244/pjoes/90036
- Yadav, P., Yadav, V. K., Yadav, A. K., & Khare, P. K. (2013). Physico-chemical characteristics of a fresh water pond of Orai, UP, Central India. Octa Journal of Biosciences, 1(2). https://doi.org/10.12816/0004139