
ABSTRACT
In temperate forests, herbs comprise up to 90% of species richness yet received less attention, and their community structure, diversity patterns, and driving mechanisms still remain understudied. We provide a phytosociological overview of herb stratum to develop a vegetation model to characterize and designate vegetation groups and interpret their diversity and species distribution patterns. Multivariate analyses – classification (TWINSPAN) and ordination (indicator species analysis [ISA], non-metric multidimensional scaling [NMDS], and Canonical Correspondence Analysis [CCA]) were applied to data set collected from 32 plots across Gurez valley, Kashmir Himalaya to recognize the understory plant communities, determine the environmental predictors and highlight their significance. Altogether, 131 herbs from 38 families were recorded. TWINSPAN classified understory vegetation into three communities: Tanacetum multicule – Pedicularis pectinata – Aconitum heterophyllum (TPA), Taraxacum officinale – Trifolium repens – Plantago major (TTP), and Impatiens brachycentra – Tussilago farfara – Galium boreale (ITG). Diversity indices and species richness vary significantly, following the trend TTP>TPA>ITG. CCA revealed that disturbances, canopy, altitude, and moisture were the strongest parameters determining species differentiation. The study outlines a methodological workflow based on analytical methods and vegetation-plot data that describe vegetation groups and might be helpful in further in-depth vegetation classification syntheses and decision-making in conservation, global change issues, and management.
1. Introduction
Mountain ecosystems support one-third of all terrestrial biodiversity characterized by topographic and habitat heterogeneity (Spehn et al., Citation2011). To ascertain the extent of species density and diversity for conservation interests, phytosociological explorations in mountain ecosystems are highly recommended (Gómez-Díaz et al., Citation2017; López-Angulo et al., Citation2018). Understory herbaceous stratum or ground herbs constitute majority of the cumulative floristic diversity in temperate forests, accounting for 90% of plant species (Gilliam, Citation2007; Spicer et al., Citation2020). Herb stratum, a taxonomically and ecologically heterogeneous group, governs various ecological processes in forests (Gilliam, Citation2007; Landuyt et al., Citation2019; Whigham, Citation2004). Consequently, several herbs are well-acknowledged indicators of environmental conditions, forest management, climate change, sustainability, health, and conservation status in forest ecosystems (Chávez & Macdonald, Citation2012; Lencinas et al., Citation2008). Exploring the mechanisms shaping the formation, development, and structuring of ecological communities has drawn much attention in ecological research. Such cognizance not only aids in comprehending the geographical heterogeneity in species distribution and plant community structure but also environmental requirements needed for effective ecological restoration and biodiversity conservation (Solefack et al., Citation2018). In the backdrop of changing environmental conditions and declining biodiversity, characterizing and monitoring herb-layer diversity remains challenging.
Experimental and theoretical investigations in mountain systems revealed that complex vegetation, climate, and soil characteristics (A. A. Dar & Parthasarathy, Citation2022a; Mestre et al., Citation2017; X. Zhang et al., Citation2021) drive species diversity patterns and community structure. Thus, it is evident that complex interrelationships exist among environmental covariates over species distribution; however, responses to environmental variables vary across plant groups (Kreft et al., Citation2010; Ricklefs & Renner, Citation2012). Topographic complexity alters solar radiation distribution, hydrology, and nutrient availability, resulting in significant fluctuations in climate, illumination hour, seasonal duration, geology, and anthropogenic disturbances; consequently, physiognomic differentiation of vegetation (Körner, Citation2007; Moeslund et al., Citation2013).
Over the past three decades, biodiversity loss triggered by anthropogenic activities has emerged as a major concern for field ecologists, notably following the Rio de Janeiro Convention on Biological Diversity summit on global biodiversity. Research in Himalaya has shown the impact of human activities on edaphic and environmental conditions by altering the vegetation diversity and distribution patterns (Wang et al., Citation2019). The impact of grazing on vegetation diversity is obscure since it depends on several temporal, geographical, and ecological constraints (Olsvig-Whittaker et al., Citation2006). Excessive degradation or the establishment of roads, powerlines, or other anthropogenic pathways may promote the invasion of non-native species (Le et al., Citation2018; Wedegärtner et al., Citation2022). Non-native taxa may change the structure and inherent functional aspects of the vegetative community without altering diversity, which might, in turn, affect ecological processes (Tilman et al., Citation1997). The disruptions caused by human activities, such as ecotourism, harvesting wild herbs and vegetables, and deforestation, are other key aspects determining the community structure (J. -T. Zhang et al., Citation2016). Considering the aforementioned threats and challenges, it is essential to investigate the interactions among forests, environment, and disturbance as well as comprehend the status of biodiversity in hitherto unexplored and species-diverse mountain areas.
The Himalaya represents one of the planet’s most intricate and diverse highland habitats, distinguished by extreme climatic variations and strong seasonality, harboring a wide range of ecosystems and species (Kala & Mathur, Citation2002; Oommen & Shanker, Citation2005). With a poorly protected geographical extent of over 600,000 km2, the Himalaya consists of a network of mountains that span the borders of five countries – China, India, Bhutan, Nepal, and Pakistan (Wambulwa et al., Citation2021); nonetheless, recent data suggest that not more than 42% of the forest remains. Forests cover 7,13,789 km2 of the land surface of India (21.71% of the total land area), of which more than 28% correspond to Himalayan landscape (Forest Survey of India (FSI), Citation2021). However, owing to remote access, uneven terrain, and unsettled geopolitical status, a significant area of the landscape awaits ecological exploration (Liang et al., Citation2020; Oommen & Shanker, Citation2005; S. M. Khan et al., Citation2013). The Kashmir Himalaya is no exception, exhibiting heterogeneous relief patterns. These differences have generated numerous habitats with distinct climates, plant groups, and species richness. Research characterizing species richness in these mountains covers specific areas, leaving several areas unstudied. Gurez valley, a part of Kashmir Himalayan landscape, is one such example. Prior investigations of the montane vegetation in Gurez valley have tended to be descriptive with limited quantitative approaches (Dad & Khan, Citation2011a, Citation2011b; Dad & Reshi, Citation2015), especially computer-based vegetation data analysis. No attempts have been undertaken to quantify the plant communities along with environmental predictors to determine the primary drivers of vegetation patterns. Such quantitative efforts may provide new perspectives on the processes governing species distribution, which are crucial for management as well as conservation initiatives in the context of global environmental change.
Application of computer-aided methods to analyze vegetation, especially in connection to species heterogeneity across environmental gradients, is a well-established field in ecology (S. M. Khan et al., Citation2013). Multivariate analyses are robust procedures intended to investigate multivariate interacting systems. Such analyses have been extensively implemented in ecological research and can efficiently characterize plant communities (Gauch, Citation2010). The classification (cluster analysis) and ordination tools (indicator species analysis [ISA], non-metric multidimensional scaling [NMDS], and Canonical Correspondence Analysis [CCA]) are used to recognize plant communities by creating a low-dimensional space in which related sample plots/species aggregate together, determine the environmental predictors and highlight the significance of interactions between vegetation and environmental matrices (Dufrêne & Legendre, Citation1997; Ter Braak, Citation1987). In this study, we applied multivariate analysis to an observational data set collected from 32 plots across the Gurez valley. The data set contains temporal measurements of understorey herb diversity and abundance with precise measurements and records of climatic, topographic, disturbance, and canopy cover variables. Combined with multivariate analysis, the data set renders a good opportunity to examine relative contribution of predictor variables to the observed species distribution patterns. The present study intends to develop an empirical vegetation model to characterize and designate the vegetation groups and present them in an ecological and vegetation paradigm to recognize indicators for specific micro-environmental conditions. Specifically, we pose and attempt to address: (Q1) Do sampled data exhibit clustering, i.e., presence of different communities; (Q2) Do species composition and diversity and density of the herb layer differ among communities? and (Q3) What are the principal environmental predictors of understory herb stratum, and are these drivers equally important? To address the first and third questions, we used multivariate analytical techniques to tease apart the communities and check for the drivers of species distribution patterns. We hypothesized – First (H1), species composition, density, and diversity vary among the plant communities due to micro-environmental variation; Second (H2), we expected that understory vegetation is influenced by topography, climate, disturbance, and canopy cover to varying extent. Altitude is likely the most significant determinant because it affects the microenvironment that supports the survival of understory vegetation (Rahman et al., Citation2020).
2. Materials and methods
2.1. Study area
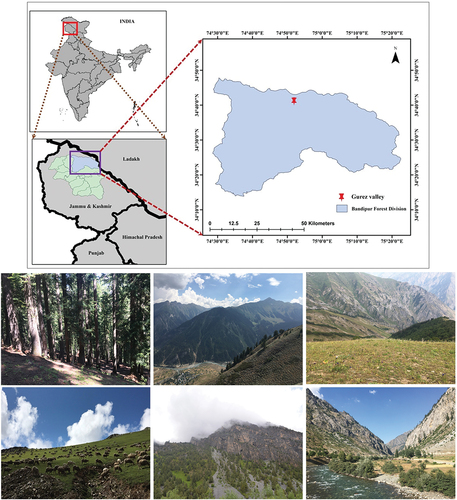
The study was conducted in Gurez valley, located on the banks of river Neelam extending between 34°30′–74°41′N and 74°37′–74°46′E in Kashmir Himalaya, India (). The area shares an international boundary with Pakistan and is, therefore, largely remained unexplored due to security concerns. The valley lies at an average altitude of about 2370 m, experiencing a mean annual temperature and precipitation of 4.6°C and 742 mm, respectively (https://www.worldclim.org/). The climate is temperate, characterized by brief, cool summer, and prolonged, harsh winter with frequent snow and frost. Lofty snow-covered mountains bound the valley with the highest peak at Razdan-top. The understory begins to emerge when the snow melts in the spring and summer, blooming fully from June to September and drying up by the end of October. The soil is shallow, and typically, only bed rock is visible at the summits of steep, bare cliffs and protruding ridges; however, at lower altitudes, the soil is deeper and has a medium to fine texture (Dad & Reshi, Citation2015). The study area is an important ecological landscape characterized by dense coniferous forests dominated by Abies pindrow and Pinus wallichiana with intermittent patches of Betula utilis at higher altitudes followed by alpine vegetation. Microclimatic variations due to complex topography support highly diverse understory vegetation (Dad & Reshi, Citation2015). Grazing by livestock is common during the short summer.
Figure 1. Study area location and landscape overview of Gurez valley, Kashmir Himalaya, India.
2.2. Data collection and analyses
A floristic survey was carried out in summer of 2020 to investigate the herb-layer species diversity of hitherto unstudied coniferous forest of Gurez valley in Kashmir Himalaya. Phyto-sociological approach (F. Haq et al., Citation2017; Laurance et al., Citation2004) was adopted to record quantitative features of understory herb stratum in five 1 m × 1 m sub-quadrats (four at corners and one at the centre) nested within 0.25 ha ([1 m2] × [5] × [32]) plots established randomly along topographic, climatic, canopy and disturbance gradients (A. A. Dar & Parthasarathy, Citation2022a; Cochran, Citation1977) with a minimum distance of 500 m between plots. Attempts were made to replicate plots evenly across the landscape, but this was not always possible because of logistic constraints and steep terrain. Species composition, richness (total number of species), and abundance encountered per plot were recorded. Botanical specimens were collected, poisoned, pressed, dried, and layered between newspapers. Specimens were provisionally identified by means of available web resources – Flora of Pakistan (http://legacy.tropicos.org/Project/Pakistan), Flowers of India (http://www.flowersofindia.net/), Indian Biodiversity Portal (https://indiabiodiversity.org/) and Plants of the World Online (https://powo.science.kew.org/) and the book – Flowers of Himalaya (Polunin & Stainton, Citation1984) before being validated at Centre for Biodiversity and Taxonomy, University of Kashmir. Nomenclature of families is based on the Angiosperm Phylogeny Group classification (Angiosperm Phylogeny Group et al., Citation2016), and species follow The World Flora Online (http://www.worldfloraonline.org/) to attain global homogeneity and to remain in touch with revised taxonomic nomenclature. Coordinates (latitude and longitude) and altitude of the sampling plots were recorded using a JUNO 3E (accuracy 2–5 m) handheld GPS, and other corresponding topographic variables – slope (°) and aspect (°), are determined through modelling 30 m digital elevation model (DEM) using ArcGIS (10.3; ESRI, Redlands, CA, U.S.A). Climate data (temperature and precipitation) of respective vegetation plots retrieved from WorldClim global database (https://www.worldclim.org/) using “raster” library (v. 3.5–11; Hijmans, Citation2021) are downscaled to 1-arc second (30 m resolution) to maintain spatial homogeneity with DEM data. Canopy (%) is assessed by observing the tree canopy and assigned to one of five classes (1–5, open to closed). To account for disturbance, grazing was determined by observing recent signs and assigning “Yes” or “No”, number of trails crossing through the plot, and number of invasive alien species per plot (A. A. Dar & Parthasarathy, Citation2022a; Ebrahimi et al., Citation2014; Wangchuk et al., Citation2014). IUCN criteria (https://www.iucnredlist.org/) is applied to identify the Red List status (critically endangered, endangered, rare, and vulnerable) of the species. Endemics (restricted to Himalayan landscape) are categorized based on literature (Chawla et al., Citation2008) and online web sources (https://powo.science.kew.org/). Density, and frequency of each species are computed and changed to their relative values to evaluate modified importance value index (IVI; Curtis & McIntosh, Citation1950; Rasingam & Parthasarathy, Citation2009) in “BiodiversityR” library (v. 2.14–4; Kindt, Citation2023) in R software (R Core Team, Citation2022). To check sampling completeness and to visualize the richness differences among plant associations, the sampling coverages are computed and plotted using 50 bootstrap replicates with 95% confidence interval in “iNEXT” library (v. 2.0.20; Hsieh et al., Citation2022). The diversity function of “vegan” library (v. 2.6–4; Oksanen et al., Citation2022) is used to calculate Shannon diversity index and Pielou evenness following Magurran (Citation2004). For β-diversity analysis, we used the spatial turnover and nestedness-resultant components, applying “Jaccard” as family of dissimilarity index using “adespatial” (v. 0.3–21; Dray, Bauman, et al., Citation2023) and “ade4” (v. 1.7–22; Dray, Dufour, et al., Citation2023) libraries. The species are divided into five frequency classes – Rare (1 − 20%), Occasional (21 − 40%), Frequent (41 − 60%), Abundant (61 − 80%), and very abundant (81 − 100%), following Tansley and Chipp (Citation1926) and Tansley (Citation1946). Kruskal-Wallis test/one-way ANOVA is used to test the statistical differences (p < 0.05) of different variables among plant communities, followed by post hoc pairwise comparisons given that the χ2/F is significant (p ≤0.05). Descriptive statistical tools are used to calculate the mean and standard error (SE) of the data.
2.3. Multivariate analyses
IVI of all the recorded plant species, along with climatic, disturbance, and topographic data, was used for multivariate analytical techniques (Rahman et al., Citation2020). The Hopkins statistics (Lawson & Jurs, Citation1990) analyze the likelihood that a particular dataset was produced by a uniform data distribution, which enables it to determine the spatial randomness (clustering tendency) of the dataset. The null hypothesis (H0) asserts that the data follow a continuous distribution (implying no meaningful clusters). H > 0.5 allows rejecting the null hypothesis (Hopkins & Skellam, Citation1954). We performed a hierarchical unsupervised divisible classification – two-way indicator species analysis (TWINSPAN; Hill, Citation1979) and a non-parametric multiscale ordination technique – NMDS (Clarke, Citation1993) using the Bray – Curtis distance of the whole data to identify plant communities using “twinspan” (v. 0.9–0; Oksanen & Hill, Citation2019) and “vegan” libraries. TWINSPAN classified sample plots by reciprocal averaging (Hill, Citation1979), and a dendrogram was constructed based on eigenvalues. NMDS aims to depict the relative position of plant associations in multidimensional space using minimal recognizable dimensions (Thakur et al., Citation2022). Non-parametric Permutational Multivariate Analysis of Variance (PERMANOVA) post hoc test utilizing Bray – Curtis dissimilarity is carried out with ”adonis2()” function of ‘vegan’ library to analyze the significant differences (after 999 permutations) among plant associations. Once the number of clusters is determined, the affinity of species (specificity and fidelity) in each habitat type is evaluated by indicator species analysis (ISA; sensu Dufrêne & Legendre, Citation1997) using ‘indicspecies’ library (v. 1.7.12; De Caceres & Legendre, Citation2009). Indicator values of species within each determined association are obtained and tested for statistical significance using a Monte Carlo test (n = 999 random permutations). The cut-off for identifying indicator species is set at 30% with a 95% confidence level (Dufrêne & Legendre, Citation1997; Ter Braak & Prentice, Citation1988), and the selected indicator species are then utilized to name the communities. To link species distribution patterns (species matrix) to changes in environmental conditions (environmental matrix) using ”cca()” (canonical correspondence analysis) function in “vegan” library, we measured 11 variables related to topography, climate, canopy, and disturbance characterizing the environment of each plot. Variance inflation factor (VIF) of variables is used to measure how much other explanatory variables inflate the regression coefficient; therefore, explanatory variables with VIF > 5 are removed through the backward selection. Finally, we used the Monte Carlo test (n = 999 permutations) to assess order (ranking), significance (p < 0.05) of environmental variables on the response variables (species and plots) and to test the significance of each environmental variable in the canonical axes (Hill & Gauch, Citation1980; Hill, Citation1979; Ter Braak, Citation1986).
3. Results
3.1. Floristic composition
We recorded 131 understory herbs representing 38 families in 32 sampling plots with a mean species richness of 13.97 (±1.11) species m−2 across the study area ( and S1). Asteraceae (17 genera, 23 species), Fabaceae (7, 12), Apiaceae (7, 10), Lamiaceae (7, 9), and Rosaceae (5, 8) exhibit highest diversity in both genera and species, respectively (). Angiosperms represent 37 families and 130 (90.1%) species, and pteridophytes by one family harboring just single species. Eight families are represented by two species, whereas four families are by three, and 15 are monotypic, represented by single species. Viola (4 spp.), Artemisia (3), Cynoglossum (3), Gentiana (3), and Saussurea (3) constitute the most diversified genera. The categorization of species into major plant groups showed that the majority of them are allied to the Magnoliopsida (dicotyledonous; 116 spp., 88.55%), followed by Liliopsida (monocots; 16 spp., 10.69%), and Polypodiopsida (ferns; one sp.). List of the species, along with letter codes are presented in Table S1.
Figure 2. Differentiation of species by family across three understory herb associations in Gurez valley of Kashmir Himalayan region.
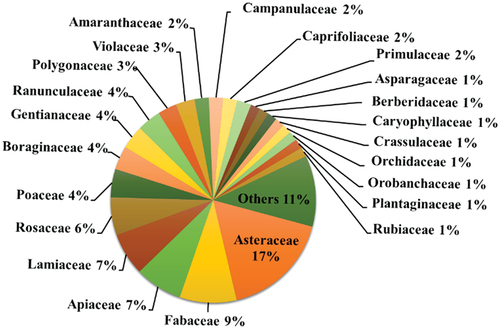
Table 1. Descriptive statistics (mean ± SE) of community attributes across three understory herb communities in Gurez valley of Kashmir Himalayan region.
3.2. Community associations
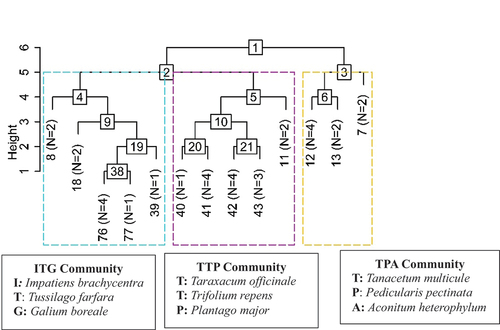
Hopkins’ statistics show that the null hypothesis is rejected (H > 0.5), indicating that dataset very likely contains clusters. TWINSPAN effectively discriminated the plots into three interpretable plant communities, which can be clearly seen in three main branches of the dendrogram (). The variation in forest communities is evident and related to intricate ecological gradients: (i) a relatively lower altitude (2758.71 m) association within mixed evergreen forest; (ii) a mid-elevation (3066.10 m) community dominated by moist temperate and sub-alpine elements and (iii) a high altitude (3208 m) plant community segregating the alpine vegetation ().
Figure 3. Classification (TWINSPAN) of understory herb vegetation presenting three communities structured in Gurez valley of Kashmir Himalayan region. The numerical numbers within square at each node represent the division number. N is the number of plots. Communities are named based on the indicator species.
3.2.1. Impatiens brachycentra–Tussilago farfara–Galium boreale (ITG)
The ITG community is comprised of 37.58 (±5.65) individuals per plot representing 55 (60%) plant species with a mean of 12.10 (±1.63) species m−2 (). This plant community is recognized in 10 sampling plots occupying north-to-northeast (steep) slopes at 3066.10 (±55.11) m. The leading indicators are Impatiens brachycentra (stat = 0.87; p = 0.001), Tussilago farfara (stat= 0.62; p = 0.025), and Galium boreale (stat = 0.61; p = 0.025), thus referred as ITG community. Besides, other associated significant indicators include Epitalem elatum and Trillium govanianum. Fragaria nubicola is the most abundant, while Galium boreale, Geranium wallichianum, Impatiens brachycentra, and Tussilago farfara are abundant. Moreover, there are two frequent, 19 occasional, and 29 rare species. Despite being least affected by anthropogenic factors (), ITG harbours least number of indicator species (25). The community supports three critically endangered (Saussurea costus), two endangered (Trillium govanianum and Aconitum heterophyllum), two vulnerable (Cypripedium cordigerum and Polygonatum verticillatum), and two endemic species ().
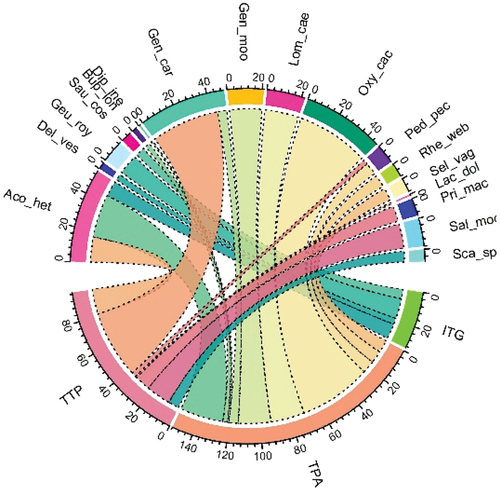
Figure 4. Distribution of endemic and IUCN threatened species across three understory herb communities in Gurez valley of Kashmir Himalayan region. The number on the scale represents the species abundance. Letter codes represent the species as: Aco_het: Aconitum heterophyllum; Del_ves: Delphinium vestitum; Geu_roy: Geum roylei; Sau_cos: Saussurea costus; Bup_lon: Bupleurum longicaule; Dip_ine: Dipsacus inermis; Gen_car: Gentiana carinata; Lom_cae: Lomatogonium caeruleum; Oxy_cae: Oxytropis cachemiriana; Ped_pec: Pedicularis pectinata; Rhe_web: Rheum webbianum; Sel_veg: Selinum vaginatum; Lac_dol: Lactuca dolichophylla; Pri_mac: Primula macrophylla; Sal_mor: Salvia moorcroftiana; and Sca_spe: Scabiosa speciosa.
3.2.2. Taraxacum officinale–Trifolium repens–Plantago major (TTP)
Collectively, 14 sample plots hosted this plant association exhibiting diverse and heterogeneous floristic composition (87 [66.41%]) with the highest mean species count (16.43 ± 1.76 m−2) distributed at relatively lower altitude (2758.71 ± 66.45 m). This community was recorded mostly on northern aspect except for two plots (TTP_16 and TTP_19) which lie on southern side. TTP comprises the highest number of significant indicators (37 spp.) with Taraxacum officinale (stat = 0.82; p = 0.002), Trifolium repens (0.82; 0.001), and Plantago major (0.76; 0.004) being the topmost species. Pimpinella diversifolia, and Ranunculus laetus are other associated significant indicator herbs. Maximum density (43.26 ± 3.36 ind. m−2) with intensive grazing has led to an increase in number of invasive aliens. Among the recorded species, most abundant, abundant, frequent, occasional, and rare species account for 3.45%, 1.15%, 5.756%, 25.29%, and 64.37%, respectively. One critically endangered (Aconitum chasmanthum), one endangered (Aconitum heterophyllum), one vulnerable (Silene vulgaris), and four endemic species are supported by this community ().
3.2.3. Tanacetum multicule–Pedicularis pectinata– Aconitum heterophyllum (TPA)
TPA is a high-altitude (3208 ± 190.50 m) plant community recognized in eight sampling plots on steep slopes above the tree line in alpine Himalaya, contributing 57 (43.51%) plant species (). Tanacetum multicule, Pedicularis pectinata, and Aconitum heterophyllum characterize the top three indicators with an indicator value of 0.87 (p = 0.00), 0.63 (p = 0.00), and 0.62 (p = 0.00), respectively. Distributed on the northeastern slopes with lowest density (23.00 ± 5.01 ind. m−2) and species richness (12.00 ± 2.22 spp. m−2), this association prefers low temperature and precipitation. The community suffers intense grazing pressure (0.75 ± 0.16) during the brief growing season in summer. The abundant species include Tanacetum multicaule and Koeleria macrantha, whereas 15 species occurred occasionally, and 36 are rare species. The community exhibits two critically endangered (Aconitum chasmanthum and Fritillaria roylei), one endangered (Aconitum heterophyllum), one vulnerable (Rheum webbianum), and 10 endemic species.
3.3. Species diversity and significance testing
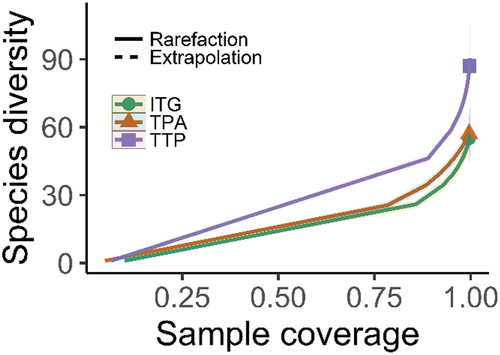
NMDS generated a two-dimensional solution (stress = 0.19) with clearly distinguished three plant associations, as indicated by the distinct separation of the communities along the first two axes (). Plots in close proximity indicate that they share similar species composition. The species distribution in ordination space demonstrates a consistent variation in species composition across communities. Species congregated close to the center of the biplot indicate their lack of affinity for a particular environment and are omnipresent. The post hoc PERMANOVA characterizes a strong compositional difference (F = 10.77, p < 0.001) among communities. TTP community has a significantly higher H′ (2.07 ± 0.14), followed by TPA and ITG communities (χ2 = 6.61; p = 0.03; ; ). The J ranged between 0.63 and 0.77 and followed the trend TPA > TTP > ITG. The three communities have nearly identical sample coverage (ITG = 99.60 [±0.005]%; TPA = 99.61 [±0.008]% and TTP = 99.70 [±0.002]%), implying they are equally complete (). The extrapolation across the communities increases the sample coverage by mere 0.002%, 0.004%, and 0.002% in ITG, TPA, and TTP, respectively. The estimated ITG and TPA richness is almost equal; however, TTP is 1.53 and 1.58 times richer than ITG and TPA communities (). Across the three communities, the beta diversity ranges between 0.35 and 0.42, with highest turnover and nestedness in TPA (0.26) and TTP (0.08). The maximum LCBD corresponds to TPA, followed by ITG and TTP communities (F = 3.47; p = 0.04), whereas SCBD follows ITG > TPA > TTP (). Pairwise comparison results show that altitude of TTP is significantly lower (p = 0.003) than ITG, whereas densities in ITG (p = 0.04) and TPA (p = 0.01) are significantly lower than TTP. Likewise, the number of invasive aliens is statistically higher in TTP compared to ITG (p = 0.000) and TPA (p = 0.014; ).
Figure 5. Two-dimensional ordination plot of the distance matrices from a NMDS (non-metric multidimensional scaling; stress = 0.19) segregating 32 sampling sites representing 131 plant species into three plant communities (ITG: Impatiens brachycentra–Tussilago farfara–Galium boreale; TPA: Taraxacum officinale–Trifolium repens–Plantago major; TTP: Tanacetum multicule–Pedicularis pectinata–Aconitum heterophylum) in Gurez valley of Kashmir Himalayan region. Refer to the supplementary (Table S1) for scientific names of the species letter codes.
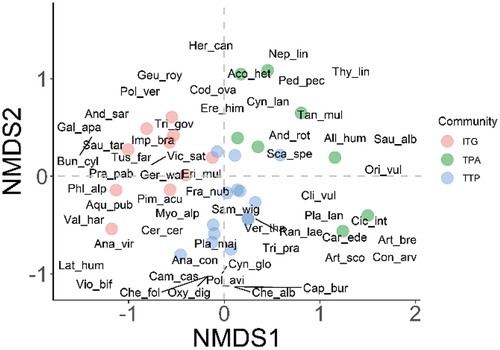
Figure 6. Statistical variations in community attributes in Gurez valley of Kashmir Himalayan region.
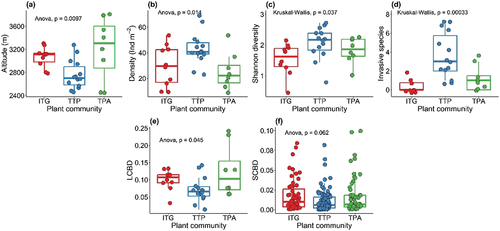
Figure 7. Coverage-based rarefaction and extrapolation curves with 95% confidence intervals comparing plant species richness across three understory herb communities (ITG, TPA, and TTP) in Gurez valley of Kashmir Himalayan region. Note solid lines represent the reference samples, and the extrapolation part is almost invisible.
3.4. Species environment relationships
Results of CCA are summarized in and . Temperature is removed from the list of potential predictors owing to its co-linearity (VIF >10), enabling other variables to account for 41.92% variation (eigenvalues: 1.20). Together, the first two canonical axes account for 56% inertia representing an eigenvalue of 0.28 for each (CCA1: F = 3.5; p = 0.001 and CCA2: F = 2.67; p = 0.034). Overall, the CCA model is significant (F = 1.76; p = 0.001), suggesting further testing (Monte Carlo permutation) of the constrained axes and variables. Significance testing depicts that key factors influencing species distribution are canopy, altitude, number of trails, and invasive aliens (p < 0.05), followed by (in order) grazing, aspect, slope, and precipitation (though insignificant). CCA1 exhibits strong positive and negative correlations with disturbance and precipitation, and altitude, suggesting a complex disturbance-topographic-precipitation gradient from lower altitude with high precipitation and grazing to high mountains with low precipitation. The CCA2 is positively and negatively correlated with altitude and canopy, reflecting altitude-canopy gradient, separating canopy-dense plots at lower altitudes from open plots at higher altitudes. Biplot demonstrates that key diagnostic species of ITG community strongly correlate with precipitation-disturbance gradient. The indicator species of TPA are strongly associated with open slopes along CCA2 at higher altitudes, whereas TTP community prefers precipitation-altitude gradient.
Figure 8. Species distributions on topographic, climatic (PPT: precipitation; MI: moisture index), and disturbance (IA: invasive aliens) gradients across the three understory plant communities in Gurez valley of Kashmir Himalayan region. Green circles represent the sampled plots. The six-letter code represents the name of the plant species, with first three letters corresponding to the genus name and the subsequent letters being initials of species name. Refer to the supplementary (Table S1) for scientific names of the species letter codes.
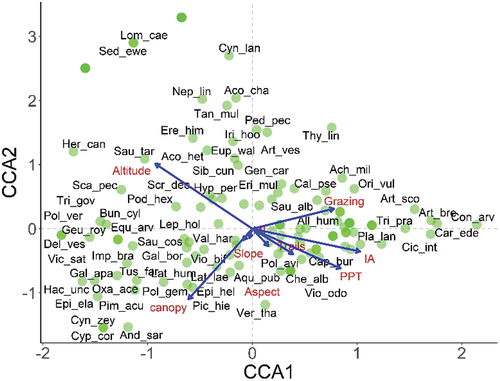
Table 2. Summary of canonical correspondence analysis (CCA).
4. Discussion
4.1. Species diversity
Despite being described as structurally diverse and species-poor ecosystems with oligarchic patterns, temperate forests may significantly enhance the diversity of distinct plant groups (e.g., herbaceous flora) or even promote regional diversity (Draper et al., Citation2018). The understory vegetation has major ecological significance because it affects tree regeneration and inhibits the establishment of characteristic seedlings (Thrippleton et al., Citation2016). The understory flora of Gurez valley is fairly heterogeneous across the complex mountain landscape (). Regardless of the area sampled, the number of species documented in our study was greater than many prior Himalayan studies (Altaf et al., Citation2021; Tiwari et al., Citation2020; Ullah et al., Citation2022) and studies undertaken elsewhere (Ebrahimi et al., Citation2014; Wang et al., Citation2019). Compared to ITG and TPA communities, the abundance and richness in TTP community are greater, presumably due to diverse microhabitats, greater resource availability, and disturbance mechanisms that led to the localization of non-native species too supporting the H1. The enhancement of species richness by intermediate disturbance levels, as proposed by Connell (Citation1978), is well supported by our results. Since the survival of several understory taxa depends on trees, “sheltering effect” might be another potential mechanism for greater herbaceous diversity (Sánchez-Jardón et al., Citation2010; Treydte et al., Citation2007). Decreasing trend in species richness from TTP to TPA along the altitudinal gradient may have resulted from eco-physiological limitations due to persistent snow cover and freezing temperature, thereby inhibiting plant growth and ecosystem productivity and, consequently, reducing diversity (Gómez-Díaz et al., Citation2017; Körner et al., Citation2011). The alpine flora acquired various adaptations, viz., enhanced resource investment in reproductive and underground components (e.g., rhizomes, bulbs, etc.), extended pollinator-attractive parts, and improved dispersal methods to endure severe conditions (Fabbro & Körner, Citation2004). The Shannon diversity of the observed plant associations is consistent with prior vegetation studies in the Himalayan landscape (Altaf et al., Citation2021; J. A. Dar & Sundarapandian, Citation2015; Kumar et al., Citation2020). However, compared to western Himalaya (Joshi et al., Citation2022; Rana et al., Citation2022), coniferous forests in Bhutan (Wangchuk et al., Citation2014), and Bogd Khan Mountain, Magnolia (Bazarragchaa et al., Citation2022), our study area is less diverse. This could be attributed to plot type and size variations, area inventoried, and vegetation type since distinct habitats encourage heterogeneous species richness (A. A. Dar & Parthasarathy, Citation2022b). Lesser evenness observed in ITG community indicates the uneven distribution of abundance among species resulting in the dominance of certain species compared to TTP and TPA communities. Majority of the species exhibit patchy distribution specialized for a particular community; over half the species occurred in either one of the communities. For example, the least overlap between TPA and ITG communities suggests that many alpine species are not prevalent and/or susceptible to competition, characteristic environmental conditions, and dispersal restrictions because of their smaller fruit size and short stature (Leal et al., Citation2014; Lima et al., Citation2015). The abundance of these characteristic species might be used as effective markers for gauging the efficacy of management strategies (D’Amato et al., Citation2009). However, several species (ubiquitous) possess characteristics such as effective seed dispersal, efficient water and mineral uptake, vegetative reproduction, etc., that enhance their competitiveness and capacity for colonization (Lima et al., Citation2015). Asteraceae, Fabaceae, and Apiaceae were in the order of dominance. Asteraceae exhibits a wide ecological range and has a firm commitment to finite resources, enabling it to dominate in a wide environmental setting. The observed family dominance resembles other vegetation studies conducted across Himalayan landscape (Joshi et al., Citation2022; S. M. Haq et al., Citation2021; Tiwari et al., Citation2020) and elsewhere in the world (Tserendulam et al., Citation2018; Wang et al., Citation2019).
4.2. Multivariate techniques in community analysis
With the development of new analytical tools and approaches, several attempts in recent vegetation ecology have uncovered the intricate pattern of vegetative structure (Mayor et al., Citation2017). Such knowledge is essential for devising future conservation and plan management strategies. Forest policy and management efficiency may increase by using conservation techniques based on spatial patterns of species richness and diversity, including the recognition of key floristic groups and target locations for conservation (W. Khan et al., Citation2016). The multivariate analyses carried out as part of this study established three distinct plant communities in the Gurez valley of Kashmir Himalaya. The number of plant associations varies depending on the area studied, sampling method, and analytical techniques used. For instance, Bano et al. (Citation2018) identified four vegetation communities across Beer Hills, Pakistan. Likewise, the number of associations can be three (Rahman et al., Citation2020), four (Ullah et al., Citation2022), five (W. Khan et al., Citation2016), and can go all along up to 24 (A. M. Khan et al., Citation2019; Ahmed et al., Citation2006; F. Haq et al., Citation2017). The NMDS strongly validated the cluster analysis as communities identified can easily be projected on the two-dimensional NMDS ordination space.
In recent years, the application of indicator species analysis for monitoring environmental conditions or identifying habitat or community types has become a well-established approach in vegetative ecology for both theoretical and practical reasons (W. Khan et al., Citation2016). One or more indicator species typically exist for each kind of environment and plant group (Vilches et al., Citation2013), which is clearly elucidated in our findings. These indicators reflect a particular microclimatic state or environmental change. Indicator species have been utilized as a powerful management tool, with the flexibility to characterize any ecoregion for the purpose of analyzing biodiversity and overall ecosystem health (Legendre, Citation2013; S. M. Khan et al., Citation2011). Employing the indicator species framework, our results highlight realistic targets for designing a long-term and pragmatic biodiversity conservation plan for the Gurez valley.
4.3. Environmental drivers facilitating species distribution
The role of ecological gradients exhibiting heterogeneity over space and time in structuring plant communities is well acknowledged (Bueno et al., Citation2018; J. -T. Zhang et al., Citation2015; Radhamoni et al., Citation2023). This was proven true in Gurez valley ( and ). Each community displayed a distribution area corresponding to a particular set of environmental factors. The findings are congruent with the environmental heterogeneity hypothesis (Huston, Citation1994), which asserts that subtle environmental variations govern species diversity. This could be attributed to the synchronous existence of several plant groups, such as sciophytes, together with resource-demanding heliophytes and generalist species (Chávez & Macdonald, Citation2012). Our findings emphasize the significant contributions of the aforementioned drivers to species distribution, particularly in relation to the distribution of the indicators.
4.3.1. Role of altitude
CCA ordination of herb stratum revealed a vegetation continuum that emerges to be a function of disturbance and altitude since both are strongly linked with the first axis (CCA1). Consequently, it can be claimed that the disturbance-altitude gradient is the main factor regulating understorey vegetation, which is consistent with the findings of prior research on mountain vegetation (e.g., Bisht et al., Citation2022; Gómez-Díaz et al., Citation2017). Topographic limitations are principal contributors to regional habitat heterogeneity regulating the vegetation distribution patterns in mountain landscapes (Titshall et al., Citation2000). In the present study, the relative contribution of topography, in particular the altitude, is significant (), probably because altitude, together with slope and aspect, shapes the solar azimuth, hydrology, climate, and edaphic characteristics, indirectly affecting the vegetation by creating microenvironments (A. A. Dar & Parthasarathy, Citation2023; S. M. Khan et al., Citation2013). This is additionally backed up by the fact that the majority of the vegetation in our area is distributed between 2300 and 3800 m. These findings are analogous to vegetation studies carried out in the western (Ilyas et al., Citation2018; S. M. Khan et al., Citation2013), eastern (Tambe & Rawat, Citation2010), and northwestern Himalayas (Dvorský et al., Citation2011; Ullah et al., Citation2022), which likewise noted the significant influence of altitude.
4.3.2. Role of climate
Altitudinal increase in mountain systems is often accompanied by reduced temperatures and increased humidity. This climate gradient which serves as a stressor for plants governs the regional vegetation trends by encouraging species that can survive at various altitudes (Klimes, Citation2003). The ideal limits of resilience to temperature, precipitation, and moisture levels vary across understory herbs. Temperature limitations cause a reduction in species richness at higher altitudes (Brinkmann et al., Citation2009). Alpine species are susceptible to temperature increases since they already occur at the mountain peaks and are unable to ascend uphill. The higher species richness of specialized plant groups at different altitudes reflects an evolutionary inheritance or greater speciation or reduced extinction under certain conditions, as reported for the family richness of herbaceous angiosperms across the latitudinal gradient (Hawkins et al., Citation2011; Jablonski et al., Citation2006). Even though precipitation generally decreases with altitude, humidity tends to rise because lower temperatures induce less evaporation, and clouds and mist generate additional water input that is not taken into account by conventional precipitation estimates (Gehrig-Downie et al., Citation2011; Karger et al., Citation2012).
4.3.3. Role of disturbance
Disturbance intensity directly (e.g., trampling, flexing shoots, chopping stems, harvesting plants and plant components, and grazing) as well as indirectly (e.g., soil compactness, accumulation, and decay of litter) affects plant growth, development, and regeneration (Austrheim, Citation2002; Sproull et al., Citation2015). Multiple studies (Jamtsho & Sridith, Citation2015; S. M. Khan et al., Citation2013; Shaheen et al., Citation2015) have revealed the prominent role of human disturbances in unsettling the sensitive Himalayan forest ecosystems. Our findings demonstrate the essential role of disturbances in framing the plant communities (). Overgrazing may exacerbate the problem by enhancing aridity and insolation, making mountainous terrain less suitable for plant growth. Additionally, grazing may alter the pattern of species dominance (Li et al., Citation2021; Múgica et al., Citation2021) and modify communities based on species’ sensitivity to grazing. Grazing eliminates many opportunistic rivals (mat- and rosette-forming species that grow near the surface to dodge grazing) of the showy blooming plants that distinguish the high alpine meadows. Several species, including Podophyllum hexandrum and Aconitum hereophyllum, designated by the IUCN as Red-List species, were collected for medicinal purposes. Additionally, these plant biosystems are threatened by rapid economic transformation, tourist boom, and societal shifts. Proactive efforts can assist in safeguarding the biota of these mountains and mitigate multiple problems that other Himalayan highlands are encountering (S. M. Khan et al., Citation2013).
Grazing can influence ecological conditions, notably competition among species (Anderson & Hoffman, Citation2007; Vera, Citation2000), alter vegetation structure and composition, and facilitate plant invasion. The rising temperature and retreating snow cover are other challenges that are further attributed to enhanced weed invasion in Himalayan landscape (A. M. Khan et al., Citation2018). Invasive species, distinguished by high reproductive success and strong competitive ability, vigorously compete with native species and have the potential to profoundly alter vegetation characteristics and ecological processes (Godefroid et al., Citation2005; Martins da Silva et al., Citation2009). Although the migration of invasive species into natural habitats often takes time, human involvement and site deterioration speed up the process (Martins da Silva et al., Citation2009). The higher disturbance intensity and larger numbers of landscape passages, such as trails, facilitate the dispersion of alien species, as reported in the previous studies (Liedtke et al., Citation2020; Wedegärtner et al., Citation2022). Since onsite disturbances directly impact species diversity and richness, conservation initiatives should be designed in conjunction with the local community to encourage education and proper land use in order to safeguard natural resources and diversity.
4.3.4. Role of canopy
CCA also highlights the important role of forest canopy in composition and distribution of herbaceous communities, probably by setting up unfavorable understory conditions; since their thick canopy cover limits light availability, and their persistent acidic litter reduces soil pH and nutrient availability to the plants (Chávez & Macdonald, Citation2010; Macdonald & Fenniak, Citation2007; Radhamoni et al., Citation2023). Inter-specific competition in conifers may not significantly impact understorey diversification patterns. Instead, these hostile environments serve as a filter, hindering light- and nutrient-demanding species, while encouraging the dominance of species which can survive and flourish under such conditions, e.g., shade-tolerant species (Hart & Chen, Citation2006; Macdonald & Fenniak, Citation2007). Decreasing canopy cover enhances solar radiation on the forest floor, accelerating plant growth by supplying energy for photosynthesis (Hofmeister et al., Citation2009; Tinya et al., Citation2009). However, others observed no effect (Augusto et al., Citation2003; Lenière & Houle, Citation2006).
5. Conclusions
Our study demonstrated empirically how cutting-edge multivariate analytical tools could help analyze plant communities and identify a list of statistically derived combination of indicator species. These results can be used to monitor changes under global change and frame better conservation and management planning in plant communities distributed across varied environmental gradients. Further, the workflow adopted might be helpful as a pathway for similar vegetation classification studies. Additionally, many distinct questions were addressed, and the information gathered enabled the following conclusions:
The data demonstrate that understorey herbs in Gurez valley are relatively heterogeneous across the complex landscape. TTP harbors higher species diversity attributed to favorable ecological conditions and thus should be prioritized for species conservation without undermining the importance of ITG and TTP communities (H1).
Further, the results showed that altitude, canopy, trails, grazing, moisture index, and invasive aliens regulate understory species distribution in forest ecosystems and that the association of plant species changed in response to environmental gradients.
Variations in species diversity along altitudinal gradient indicate a strong influence of environmental filtering in structuring plant diversity patterns, with canopy and altitude being the key limiting drivers for understory vegetation as expected (H2), while disturbance and moisture status impose additional restraints.
The impact of anthropogenic factors on species distribution is alarming, as disturbances may change the community structure and disrupt ecological processes. Initiatives, viz., regulating increasing disturbances, monitoring forest diversity change, promoting reforestation activities, facilitating awareness campaigns for sustainable resource use, and effective rangeland management should draw considerable attention.
Supplemental Material
Download (21.5 KB)Acknowledgments
Authors thank two anonymous reviewers for their insightful comments and constructive feedback, which greatly improved the quality of this manuscript. AAD thanks Chief Conservator of Forests, Jammu and Kashmir Forest Department, for permission to conduct the fieldwork. First author is indebted to Centre for Biodiversity and Taxonomy, University of Kashmir, for renumerated identification of plant specimens. Thanks to my three field assistants – Mushtaq Ahmad Dar, Bilal Ahmad Dar, and Mudasir Ahmad Wani and forest guard – Aijaz Ahmad Khan, without them, the fieldwork would have been almost impossible.
Disclosure statement
No potential conflict of interest was reported by the author(s).
Supplementary material
Supplemental data for this article can be accessed online at https://doi.org/10.1080/24749508.2023.2216532.
Data availability statement
The data is available with the corresponding author and is not available on any online web platform.
Additional information
Funding
References
- Ahmed, M., Hussain, T., Sheikh, A. H., Hussain, S. S., & Siddiqui, M. F. (2006). Phytosociology and structure of Himalayan forests from different climatic zones of Pakistan. Pakistan Journal of Botany, 38(2), 361–383. http://www.pakbs.org/pjbot/PDFs/38(2)/PJB38(2)361.pdf
- Altaf, A., Haq, S. M., Shabnum, N., & Jan, H. A. (2021). Comparative assessment of Phyto diversity in Tangmarg Forest division in Kashmir Himalaya, India. Acta Ecologica Sinica, 42(6), 609–615. https://doi.org/10.1016/j.chnaes.2021.04.009
- Anderson, P. M. L., & Hoffman, M. T. (2007). The impacts of sustained heavy grazing on plant diversity and composition in lowland and upland habitats across the Kamiesberg mountain range in the Succulent Karoo South Africa. Journal of Arid Environments, 70(4), 686–700. https://doi.org/10.1016/j.jaridenv.2006.05.017
- Augusto, L., Dupouey, J. L., & Ranger, J. (2003). Effects of tree species on understory vegetation and environmental conditions in temperate forests. Annals of Forest Science, 60(8), 823–831. https://doi.org/10.1051/forest:2003077
- Austrheim, G. (2002). Plant diversity patterns in semi-natural grasslands along an elevational gradient in southern Norway. Plant Ecology, 161(2), 193–205. https://doi.org/10.1023/A:1020315718720
- Bano, S., Khan, S. M., Alam, J., Alqarawi, A. A., Abd_allah, E. F., Ahmad, Z., Rahman, I. U., Ahmad, H., Aldubise, A., & Hashem, A. (2018). Eco-floristic studies of native plants of the Beer Hills along the Indus River in the districts Haripur and Abbottabad, Pakistan. Saudi Journal of Biological Sciences, 25(4), 801–810. https://doi.org/10.1016/j.sjbs.2017.02.009
- Bazarragchaa, B., Kim, H. S., Batdelger, G., Batkhuu, M., Lee, S. M., Yang, S., Peak, W. K., & Lee, J. (2022). Forest vegetation structure of the Bogd Khan Mountain: A strictly protected area in Mongolia. Journal of Asia-Pacific Biodiversity, 15(2), 267–279. https://doi.org/10.1016/j.japb.2022.04.001
- Bisht, M., Sekar, K. C., Mukherjee, S., Thapliyal, N., Bahukhandi, A., Singh, D., Bhojak, P., Mehta, P., Upadhyay, S., & Dey, D. (2022). Influence of Anthropogenic Pressure on the Plant Species Richness and Diversity Along the Elevation Gradients of Indian Himalayan High-Altitude Protected Areas. Frontiers in Ecology and Evolution, 10, 751989. https://doi.org/10.3389/fevo.2022.751989
- Brinkmann, K., Patzelt, A., Dickhoefer, U., Schlecht, E., & Buerkert, A. (2009). Vegetation patterns and diversity along an altitudinal and a grazing gradient in the Jabal al Akhdar mountain range of northern Oman. Journal of Arid Environments, 73(11), 1035–1045. https://doi.org/10.1016/j.jaridenv.2009.05.002
- Bueno, M. L., Dexter, K. G., Pennington, R. T., Pontara, V., Neves, D. M., Ratter, J. A., & de Oliveira‐Filho, A. T. (2018). The environmental triangle of the Cerrado Domain: Ecological factors driving shifts in tree species composition between forests and savannas. The Journal of Ecology, 106(5), 2109–2120. https://doi.org/10.1111/1365-2745.12969
- Angiosperm Phylogeny GroupChase, M. W., Christenhusz, M. J., Fay, M. F., Byng, J. W., Judd, W. S., Soltis, D. E., Mabberley, D. J., Sennikov, A. N., Soltis, P. S., & Stevens, P. F. (2016). An update of the Angiosperm Phylogeny Group classification for the orders and families of flowering plants: APG IV. Botanical Journal of the Linnean Society, 181(1), 1–20. https://doi.org/10.1111/boj.12385
- Chávez, V., & Macdonald, S. E. (2010). The influence of canopy patch mosaics on understory plant community composition in boreal mixedwood forest. Forest Ecology and Management, 259(6), 1067–1075. https://doi.org/10.1016/j.foreco.2009.12.013
- Chávez, V., & Macdonald, S. E. (2012). Partitioning vascular understory diversity in mixedwood boreal forests: The importance of mixed canopies for diversity conservation. Forest Ecology and Management, 271, 19–26. https://doi.org/10.1016/j.foreco.2011.12.038
- Chawla, A., Rajkumar, S., Singh, K. N., Lal, B., & Singh, R. D. (2008). Plant species diversity along an altitudinal gradient of Bhabha Valley in Western Himalaya. Journal of Mountain Science, 5(2), 157–177. https://doi.org/10.1007/s11629-008-0079-y
- Clarke, K. R. (1993). Non-parametric multivariate analyses of changes in community structure. Australian Journal of Ecology, 18(1), 117e143. https://doi.org/10.1111/j.1442-9993.1993.tb00438.x
- Cochran, W. (1977). Sampling techniques (3rd ed.). Wiley.
- Connell, J. H. (1978). Diversity in tropical rain forests and coral reefs. Science, 199(4335), 1302–1310. https://doi.org/10.1126/science.199.4335.1302
- Curtis, J. T., & McIntosh, R. P. (1950). The interrelations of certain analytic and synthetic phytosociological characters. Ecology, 31(3), 434–455. https://doi.org/10.2307/1931497
- Dad, J. M., & Khan, A. B. (2011a). Edible wild plants of pastorals at high-altitude grasslands of Gurez Valley, Kashmir, India. Ecology of Food and Nutrition, 50(3), 281–294. https://doi.org/10.1080/03670244.2011.568910
- Dad, J. M., & Khan, A. B. (2011b). Threatened medicinal plants of Gurez valley, Kashmir Himalayas: Distribution pattern and current conservation status. International Journal of Biodiversity Science & Management, 7(1), 20–26. https://doi.org/10.1080/21513732.2011.602646
- Dad, J. M., & Reshi, Z. A. (2015). Floristic composition and diversity patterns of vascular plants in mountain meadow of Gurez valley, Kashmir, India. Taiwania, 60(1), 8–17. https://doi.org/10.6165/tai.2015.60.8
- D’Amato, A. W., Orwig, D. A., & Foster, D. R. (2009). Understory vegetation in old-growth and second-growth Tsuga canadensis forests in western Massachusetts. Forest Ecology and Management, 257(3), 1043–1052. https://doi.org/10.1016/j.foreco.2008.11.003
- Dar, A. A., & Parthasarathy, N. (2022a). Community associations and ecological drivers of understory vegetation across temperate forests of Kashmir Himalayas, India. Trees, Forests and People, 8, 100217. https://doi.org/10.1016/j.tfp.2022.100217
- Dar, A. A., & Parthasarathy, N. (2022b). Understory diversity and floristic differentiation of Kashmir Himalayan coniferous forests: Implications for conservation. Tropical Ecology, 1–16. https://doi.org/10.1007/s42965-022-00252-y
- Dar, A. A., & Parthasarathy, N. (2023). Ecological drivers of soil carbon in Kashmir Himalayan forests: Application of machine learning combined with structural equation modelling. Journal of Environmental Management, 330, 117147. https://doi.org/10.1016/j.jenvman.2022.117147
- Dar, J. A., & Sundarapandian, S. (2015). Patterns of plant diversity in seven temperate forest types of Western Himalaya, India. Journal of Asia-Pacific Biodiversity, 9(3), 280–292. https://doi.org/10.1016/j.japb.2016.03.018
- De Caceres, M., & Legendre, P. (2009). Associations between species and groups of sites: Indices and statistical inference. Ecology, 90(12), 3566–3574. https://doi.org/10.1890/08-1823.1
- Draper, F. C., Coronado, E. N. H., Roucoux, K. H., Lawson, I. T., Pitman, N. C. A., Fine, P. V. A., Phillips, O. L., Montenegro, L. A. T., Sandoval, E. V., Mesones, I., García-Villacorta, R., Arévalo, F. R. R., & Baker, T. R. (2018). Peatland forests are the least diverse tree communities documented in Amazonia, but contribute to high regional beta‐diversity. Ecography, 41(8), 1–14. https://doi.org/10.1111/ecog.03126
- Dray, S., Bauman, D., Blanchet, G., Borcard, D., Clappe, S., Guénard, G., Jombart, T., Larocque, G., Legendre, P., & Madi, N. (2023). adespatial: Multivariate Multiscale Spatial Analysis (R package version 0.3–21). https://CRAN.R-project.org/package=adespatial.
- Dray, S., Dufour, A., Thioulouse, J., Jombart, T., Pavoine, S., Lobry, J. R., Ollier, S., Borcard, D., Legendre, P., & Bougeard, S. (2023). ade4: Analysis of Ecological Data: Exploratory and Euclidean Methods in Environmental Sciences (R package version 1.7–22). https://CRAN.R-project.org/package=ade4.
- Dufrêne, M., & Legendre, P. (1997). Species assemblages and indicator species: The need for a flexible asymmetrical approach. Ecological Monographs, 67(3), 345–366. https://doi.org/10.1890/0012-9615(1997)067[0345:SAAIST]2.0.CO;2
- Dvorský, M., Doležal, J., De Bello, F., Klimešová, J., & Klimeš, L. (2011). Vegetation types of East Ladakh: Species and growth form composition along main environmental gradients. Applied Vegetation Science, 14(1), 132–147. https://doi.org/10.1111/j.1654-109X.2010.01103.x
- Ebrahimi, S. S., Pourbabaei, H., Potheir, D., Omidi, A., & Torkaman, J. (2014). Effect of livestock grazing and human uses on herbaceous species diversity in oriental beech (Fagus orientalis Lipsky) forests, Guilan, Masal, northern Iran. Journal of Forestry Research, 25(2), 455–462. https://doi.org/10.1007/s11676-014-0476-8
- Fabbro, T., & Körner, C. (2004). Altitudinal differences in flower traits and reproductive allocation. Flora, 199(1), 70–81. https://doi.org/10.1078/0367-2530-00128
- Forest Survey of India (FSI). (2021). Indian State of Forest Report 2021. FSI, Dehradun. https://fsi.nic.in/forest-report-2021?pgID=forest-report-2021
- Gauch, H. G. (2010). Multivariate Analysis in Community Ecology. Cambridge University Press.
- Gehrig-Downie, C., Obregon, A., Bendix, J., & Gradstein, S. R. (2011). Epiphyte biomass and canopy microclimate in the tropical lowland cloud forest of French Guiana. Biotropica, 43(5), 591–596. https://doi.org/10.1111/j.1744-7429.2010.00745.x
- Gilliam, F. S. (2007). The ecological significance of the herbaceous layer in temperate forest ecosystems. BioScience, 57(10), 845–858. https://doi.org/10.1641/B571007
- Godefroid, S., Massant, W., Weyembergh, G., & Koedam, N. (2005). Impact of fencing on the recovery of the ground flora on heavily eroded slopes of a deciduous forest. Environmental Management, 32(1), 62–76. https://doi.org/10.1007/s00267-002-2705-8
- Gómez-Díaz, J. A., Krömer, T., Kreft, H., Gerold, G., Carvajal-Hernández, C. I., Heitkamp, F., & Zang, R. (2017). Diversity and composition of herbaceous angiosperms along gradients of elevation and forest-use intensity. PLos One, 12(8), e0182893. https://doi.org/10.1371/journal.pone.0182893
- Haq, F., Ahmad, H., Iqbal, Z., Alam, M., & Aksoy, A. (2017). Multivariate approach to the classification and ordination of the forest ecosystem of Nandiar valley western Himalayas. Ecological Indicators, 80, 232–241. https://doi.org/10.1016/j.ecolind.2017.05.047
- Haq, S. M., Calixto, E. S., Rashid, I., & Khuroo, A. A. (2021). Human-driven disturbances change the vegetation characteristics of temperate forest stands: A case study from Pir Panchal mountain range in Kashmir Himalaya. Trees, Forests and People, 6, 100134. https://doi.org/10.1016/j.tfp.2021.100134
- Hart, S. A., & Chen, H. (2006). Understory vegetation dynamics of North American boreal forests. Critical Reviews in Plant Sciences, 25(4), 381–397. https://doi.org/10.1080/07352680600819286
- Hawkins, B. A., Rodrıguez, M. A., & Weller, S. G. (2011). Global angiosperm family richness revisited: Linking ecology and evolution to climate. Journal of Biogeography, 38(7), 1253–1266. https://doi.org/10.1111/j.1365-2699.2011.02490.x
- Hijmans, R. J. (2021). raster: Geographic Data Analysis and Modeling (R package version 3.5–11). https://CRAN.R-project.org/package=raster
- Hill, M. O. (1979). TWINSPAN: A FORTRAM Program for Arranging Multivariate Data in an Ordered Two-way Table by Classification of the Individuals and Attributes. Cornell University.
- Hill, M. O., & Gauch, H. G. (1980). Detrended correspondence analysis: An improved ordination technique. Vegetatio, 42(1–3), 47–58. https://doi.org/10.1007/978-94-009-9197-2_7
- Hofmeister, J., Hosek, J., Modry, M., & Rolecek, J. (2009). The influence of light and nutrient availability on herb layer species richness in oak-dominated forests in central Bohemia. Plant Ecology, 205(1), 57–75. https://doi.org/10.1007/s11258-009-9598-z
- Hopkins, B., & Skellam, J. G. (1954). A new method for determining the type of distribution of plant individuals. Annals of Botany, 18(70), 213–227. https://doi.org/10.1093/oxfordjournals.aob.a083391
- Hsieh, T. C., Ma, K. H., & Chao, A. (2022). iNEXT: Interpolation and Extrapolation for Species Diversity (R package version 3). https://CRAN.R-project.org/package=iNEXT.
- Huston, M. A. (1994). Biological diversity. The coexistence of species on changing landscapes. Cambridge University Press.
- Ilyas, M., Qureshi, R., Akhtar, N., & Ziaul-Haq Khan, A. M. (2018). Floristic diversity and vegetation structure of the remnant subtropical broad leaved forests from Kabal valley, Swat, Pakistan. Pakistan Journal of Botany, 50(1), 217–230. http://www.pakbs.org/pjbot/papers/1515798615.pdf
- Jablonski, D., Roy, K., & Valentine, J. W. (2006). Out of the tropics: Evolutionary dynamics of the latitudinal diversity gradient. Science, 314(5796), 102–106. https://doi.org/10.1126/science.1130880
- Jamtsho, K., & Sridith, K. (2015). Exploring the patterns of alpine vegetation of Eastern Bhutan: A case study from the Merak Himalaya. Springer Plus, 4(1), 1–11. https://doi.org/10.1186/s40064-015-1066-8
- Joshi, V. C., Bisht, D., Sundriyal, R. C., & Pant, H. (2022). Species richness, diversity, structure, and distribution patterns across dominating forest communities of low and mid-hills in the Central Himalaya. Geology, Ecology, & Landscapes, 1–11. https://doi.org/10.1080/24749508.2021.2022424
- Kala, C. P., & Mathur, V. B. (2002). Patterns of plant species distribution in the Trans-Himalayan region of Ladakh, India. Journal of Vegetation Science, 13(6), 751–754. https://doi.org/10.1111/j.1654-1103.2002.tb02104.x
- Karger, D. N., Kluge, J., Abrahamczyk, S., Salazar, L., Homeier, J., Lehnert, M., Amoroso, V. B., & Kessler, M. (2012). Bryophyte cover of trees as proxy for air humidity in the tropics. Ecological Indicators, 20, 277–281. https://doi.org/10.1016/j.ecolind.2012.02.026
- Khan, S. M., Harper, D. M., Page, S., & Ahmad, H. (2011). Species and community diversity of vascular flora along environmental gradient in Naran Valley: A multivariate approach through Indicator Species Analysis. Pakistan Journal of Botany, 43(3), 2337–2346. http://www.pakbs.org/pjbot/papers/1524568432.pdf
- Khan, W., Khan, S. M., Ahmad, H., Ahmad, Z., & Page, S. (2016). Vegetation mapping and multivariate approach to indicator species of a forest ecosystem: A case study from the Thandiani sub Forests Division (TsFD) in the Western Himalayas. Ecological Informatics, 71, 336–351. https://doi.org/10.1016/j.ecolind.2016.06.059
- Khan, S. M., Page, S., Ahmad, H., & Harper, D. (2013). Identifying plant species and communities across environmental gradients in the Western Himalayas: Method development and conservation use. Ecological Informatics, 14, 99–103. https://doi.org/10.1016/j.ecoinf.2012.11.010
- Khan, A. M., Qureshi, R., Arshad, M., & Mirza, S. N. (2018). Climatic and flowering phenological relationships of western Himalayan flora of Muzaffarabad district, Azad Jammu and Kashmir, Pakistan. Pakistan Journal of Botany, 50(5), 1093–1112. http://www.pakbs.org/pjbot/PDFs/43(5)/PJB43(5)2337.pdf
- Khan, A. M., Qureshi, R., & Saqib, Z. (2019). Multivariate analyses of the vegetation of the western Himalayan forests of Muzaffarabad district, Azad Jammu and Kashmir, Pakistan. Ecological Indicators, 104, 723–736. https://doi.org/10.1016/j.ecolind.2019.05.048
- Kindt, R. (2023). BiodiversityR: Package for Community Ecology and Suitability Analysis (R package version 2.14-4). https://CRAN.R-project.org/package=BiodiversityR
- Klimes, L. (2003). Life-forms and clonality of vascular plants along an altitudinal gradient in E Ladakh (NW Himalayas). Basic & Applied Ecology, 4(4), 317–328. https://doi.org/10.1078/1439-1791-00163
- Körner, C. (2007). The use of ‘altitude’ in ecological research. Trends in Ecology & Evolution, 22(11), 569–574. https://doi.org/10.1016/j.tree.2007.09.006
- Körner, C., Paulsen, J., & Spehn, M. (2011). A definition of mountains and their bioclimatic belts for global comparisons of biodiversity data. Alpine Botany, 121(2), 73. https://doi.org/10.1007/s00035-011-0094-4
- Kreft, H., Jetz, W., Mutke, M., & Barthlott, W. (2010). Contrasting environmental and regional effects on global pteridophyte and seed plant diversity. Ecography, 33(2), 408–419. https://doi.org/10.1111/j.1600-0587.2010.06434.x
- Kumar, M., Verma, A. K., & Garkoti, S. C. (2020). Lantana camara and Ageratina adenophora invasion alter the understory species composition and diversity of chir pine forest in central Himalaya, India. Acta Oecologica, 109, 103642. https://doi.org/10.1016/j.actao.2020.103642
- Landuyt, D., De Lombaerde, E., Perring, M. P., Hertzog, L. R., Ampoorter, E., Maes, S. L., De Frenne, P., Ma, S., Proesmans, W., Blondeel, H., & Sercu, B. K. (2019). The functional role of temperate forest understorey vegetation in a changing world. Global Change Biology, 25(11), 3625–3641. https://doi.org/10.1111/gcb.14756
- Laurance, W. F., Oliveira, A. A., Laurance, S. G., Condit, R., Nascimento, H. E. M., Thorin, A. C. S., Lovejoy, T. E., Andrade, A., Angelo, S. D., Ribeiro, J. E., & Dick, C. W. (2004). Pervasive alteration of tree communities in undisturbed Amazonian forests. Nature, 428(6979), 171–175. https://doi.org/10.1038/nature02383
- Lawson, R. G., & Jurs, P. C. (1990). New index for clustering tendency and its application to chemical problems. The Journal for Chemical Information and Computer Scientists, 30(1), 36–41. https://doi.org/10.1021/ci00065a010
- Leal, I. R., Wirth, R., & Tabarelli, M. (2014). The multiple impacts of leaf-cutting ants and their novel ecological role in human-modified Neotropical forests. Biotropica, 46(5), 516–528. https://doi.org/10.1111/btp.12126
- Le, C., Fukumori, K., Hosaka, T., Numata, S., Hashim, M., & Kosaki, T. (2018). The distribution of an invasive species, Clidemia hirta along roads and trails in Endau Rompin national park, Malaysia. Tropical Conservation Science, 11, 1940082917752818. https://doi.org/10.1177/1940082917752818
- Legendre, P. (2013). Indicator species: Computation. In S. Levin (Ed.), Encyclopedia of Biodiversity (2nd ed., pp. 264–268). Academic Press.
- Lencinas, M. V., Martínez Pastur, G., Solán, R., Gallo, E., & Cellini, J. M. (2008). Forest management with variable retention impact over bryophyte communities of Nothofagus pumilio understory. Forstarchiv, 79, 77–82. https://do.org/10.23760300-4112-79-7
- Lenière, A., & Houle, G. (2006). Response of herbaceous plant diversity to reduced structural diversity in maple-dominated (Acer saccharum Marsh.) forests managed for sap extraction. Forest Ecology and Management, 231(1–3), 94–104. https://doi.org/10.1016/j.foreco.2006.05.024
- Liang, J., Ding, Z., Lie, G., Zhou, Z., Singh, P. B., Zhang, Z., & Hu, H. (2020). Species richness patterns of vascular plants and their drivers along an elevational gradient in the central Himalayas. Global Ecology and Conservation, 24, e01279. https://doi.org/10.1016/j.gecco.2020.e01279
- Liedtke, R., Barros, A., Essl, F., Lembrechts, J. J., Wedegärtner, R. E., Pauchard, A., & Dullinger, S. (2020). Hiking trails as conduits for the spread of non-native species in mountain areas. Biological Invasions, 22(3), 1121–1134. https://doi.org/10.1007/s10530-019-02165-9
- Li, W., Hooper, D. U., Wu, L., Bakker, J. D., Gianuca, A. T., Wu, X. B., Taube, F., Wang, C., & Bai, Y. (2021). Grazing regime alters plant community structure via patch‐scale diversity in semiarid grasslands. Ecosphere, 12(6), e03547. https://doi.org/10.1002/ecs2.3547
- Lima, P. B., Lima, L. F., Santos, B. A., Tabarelli, M., & Zickel, C. S. (2015). Altered herb assemblages in fragments of the Brazilian Atlantic forest. Biological Conservation, 191, 588–595. https://doi.org/10.1016/j.biocon.2015.08.014
- López-Angulo, J., Pescador, D. S., Sánchez, A. M., Mihoč, M. A. K., Cavieres, L. A., Escudero, A., & Zang, R. (2018). Determinants of high mountain plant diversity in the Chilean Andes: From regional to local spatial scales. PLos One, 13(7), e0200216. https://doi.org/10.1371/journal.pone.0200216
- Macdonald, S. E., & Fenniak, T. E. (2007). Understory plant communities of boreal mixedwood forests in western Canada: Natural patterns and response to variable-retention harvesting. Forest Ecology and Management, 242(1), 34–48. https://doi.org/10.1016/j.foreco.2007.01.029
- Magurran, A. E. (2004). Measuring biological diversity. Blackwell Publishing.
- Martins da Silva, P., Aguiar, C. A. S., Niemela, J., Sousa, J. P., & Serrano, A. R. M. (2009). Cork-oak woodlands as key-habitats for biodiversity conservation in Mediterranean landscapes: A case study using rove and ground beetles (Coleoptera: Staphylinidae, Carabidae). Biodiversity and Conservation, 18(3), 605–619. https://doi.org/10.1007/s10531-008-9527-9
- Mayor, J. R., Sanders, N. J., Classen, A. T., Bardgett, R. D., Clément, J. C., Fajardo, A., Lavorel, S., Sundqvist, M. K., Bahn, M., Chisholm, C., Cieraad, E., Gedalof, Z., Grigulis, K., Kudo, G., Oberski, D. L., & Wardle, D. A. (2017). Elevation alters ecosystem properties across temperate treelines globally. Nature, 542(7639), 91–95. https://doi.org/10.1038/nature21027
- Mestre, L., Toro-Manríquez, M., Soler, R., Huertas-Herrera, A., Martínez-Pastur, G., & Lencinas, M. V. (2017). The influence of canopy-layer composition on understory plant diversity in southern temperate forests. Forest Ecosystems, 4(1), 6. https://doi.org/10.1186/s40663-017-0093-z
- Moeslund, J. E., Arge, L., Bøcher, P. K., Dalgaard, T., & Svenning, J. C. (2013). Topography as a driver of local terrestrial vascular plant diversity patterns. Nordic Journal of Botany, 31(2), 129–144. https://doi.org/10.1111/j.1756-1051.2013.00082.x
- Múgica, L., Canals, R. M., San Emeterio, L., & Peralta, J. (2021). Decoupling of traditional burnings and grazing regimes alters plant diversity and dominant species competition in high-mountain grasslands. The Science of the Total Environment, 790, 147917. https://doi.org/10.1016/j.scitotenv.2021.147917
- Oksanen, J., & Hill, M. O. (2019). Twinspan: Two-Way Indicator Species Analysis (R package version 0.9-0). https://github.com/jarioksa/twinspan
- Oksanen, J., Simpson, G. L., Blanchet, F. G., Kindt, R., Legendre, P., Minchin, P. R., O’Hara, R. B., Solymos, P., Stevens, M. H. H., & Szoecs, E. (2022). Vegan: Community Ecology Package (R package version 2.6-4). https://CRAN.R-project.org/package=vegan
- Olsvig-Whittaker, L., Frankenberg, E., Perevolotsky, A., & Ungar, E. D. (2006). Grazing, over-grazing and conservation: Changing concepts and practices in the Negev rangelands. Science et changements planétaires/Sécheresse, 17(1), 195–199. http://www.jle.com/fr/revues/sec/edocs/grazing_overgrazing_and_conservation_changing_concepts_and_practices_in_the_negev_rangelands_270098/article.phtml?tab=download&pj_key=doc_attach_5051
- Oommen, M. A., & Shanker, K. (2005). Elevational species richness patterns emerge from multiple local mechanisms in Himalayan woody plants. Ecology, 86(11), 3039–3047. https://doi.org/10.1890/04-1837
- Polunin, O., & Stainton, A. (1984). Flowers of Himalaya. Oxford University Press.
- Radhamoni, H. V. N., Queenborough, S. A., Arietta, A. Z. A., Suresh, H. S., Dattaraja, H. S., Kumar, S. S., Sukumar, R., & Comita, L. S. (2023). Local‐and landscape‐scale drivers of terrestrial herbaceous plant diversity along a tropical rainfall gradient in Western Ghats, India. The Journal of Ecology, 111(5), 1–16. https://doi.org/10.1111/1365-2745.14075
- Rahman, I. U., Afzal, A., Iqbal, Z., Bussmann, R. W., Alsamadany, H., Calixto, E. S., Shah, G. M., Kausar, R., Shah, M., Ali, N., & Ijaz, F. (2020). Ecological gradients hosting plant communities in Himalayan subalpine pastures: Application of multivariate approaches to identify indicator species. Ecological Informatics, 60, 101162. https://doi.org/10.1016/j.ecoinf.2020.101162
- Rana, D., Kapoor, K. S., Bhatt, A., & Samant, S. S. (2022). Community structure and species diversity of forest vegetation in a protected area of Western Himalayan region of India. Environment, Development and Sustainability, 24(12), 1–22. https://doi.org/10.1007/s10668-021-02020-9
- Rasingam, L., & Parthasarathy, N. (2009). Diversity of understory plants in undisturbed and disturbed tropical lowland forests of Little Andaman Island, India. Biodiversity and Conservation, 18(4), 1045–1065. https://doi.org/10.1007/s10531-008-9496-z
- R Core Team. (2022). R: A language and environment for statistical computing. R Foundation for Statistical Computing. https://www.R-project.org/
- Ricklefs, R. E., & Renner, S. S. (2012). Global correlations in tropical tree species richness and abundance reject neutrality. Science, 335(6067), 464–467. https://doi.org/10.1126/science.1215182
- Sánchez-Jardón, L., Acosta, B., Del Pozo, A., Casado, M. A., Ovalle, C., Elizalde, H. F., Hepp, C., & De Miguel, J. M. (2010). Grassland productivity and diversity on a tree cover gradient in Nothofagus pumilio in NW Patagonia. Agriculture, Ecosystems and Environment, 137(1–2), 213–218. https://doi.org/10.1016/j.agee.2010.02.006
- Shaheen, H., Sarwar, R., Firdous, S. S., Dar, M. E. U. I., Ullah, Z., & Khan, S. M. (2015). Distribution and structure of conifers with special emphasis on Taxus baccata in moist temperate forests of Kashmir Himalayas. Pakistan Journal of Botany, 47(SI), 71–76. https://www.pakbs.org/pjbot/PDFs/47(SI)/08.pdf
- Solefack, M. C., Fedoung, E. F., & Temgoua, L. F. (2018). Factors determining floristic composition and functional diversity of plant communities of Mount Oku forests, Cameroon. Journal of Asia-Pacific Biodiversity, 11(2), 284–293.
- Spehn, E. M., Rudmann-Maurer, K., & Körner, C. (2011). Mountain biodiversity. Plant Ecology & Diversity, 4(4), 301–302. https://doi.org/10.1080/17550874.2012.698660
- Spicer, M. E., Mellor, H., & Carson, W. P. (2020). Seeing beyond the trees: A comparison of tropical and temperate plant growth forms and their vertical distribution. Ecology, 101(4), e02974. https://doi.org/10.1002/ecy.2974
- Sproull, G. J., Quigley, M. F., Sher, A., Gonzalez, E., & Collins, B. (2015). Long-term changes in composition, diversity and distribution patterns in four herbaceous plant communities along an elevational gradient. Journal of Vegetation Science, 26(3), 552–563. https://doi.org/10.1111/jvs.12264
- Tambe, S., & Rawat, G. S. (2010). The alpine vegetation of the Khangchendzonga landscape, Sikkim Himalaya: Community characteristics, diversity, and aspects of ecology. Mountain Research and Development, 30(3), 266–274. https://doi.org/10.1659/MRD-JOURNAL-D-09-00058.1
- Tansley, A. G. (1946). Introduction to plant ecology (2nd ed.). Unwin Bros. Ltd.
- Tansley, A. G., & Chipp, T. F. (1926). Aims and methods in the study of vegetation. White friars Press.
- Ter Braak, C. J. F. (1986). Canonical correspondence analysis: A new eigenvector technique for multivariate direct gradient analysis. Ecology, 67(5), 1167–1179. https://doi.org/10.2307/1938672
- Ter Braak, C. J. F. (1987). The analysis of vegetation–environment relationships by canonical correspondence analysis. Vegetatio, 69(1–3), 69–77. https://doi.org/10.1007/BF00038688
- Ter Braak, C. J. F., & Prentice, I. C. (1988). A theory of gradient analysis. Advances in Ecological Research, 18, 271–317. https://doi.org/10.1016/S0065-2504(08)60183-X
- Thakur, S., Negi, V. S., Dhyani, R., Bhatt, I. D., & Yadava, A. K. (2022). Influence of environmental factors on tree species diversity and composition in the Indian western Himalaya. Forest Ecology and Management, 503, 119746. https://doi.org/10.1016/j.foreco.2021.119746
- Thrippleton, T., Bugmann, H., Kramer-Priewasser, K., & Snell, R. S. (2016). Herbaceous understorey: An overlooked player in forest landscape dynamics? Ecosystems, 19(7), 1240–1254. https://doi.org/10.1007/s10021-016-9999-5
- Tilman, D., Knops, J., Wedin, D., Reich, P., Ritchie, M., & Siemann, E. (1997). The influence of functional diversity and composition on ecosystem processes. Science, 277(5330), 1300–1302. https://doi.org/10.1126/science.277.5330.130
- Tinya, F., Marialigeti, S., Kiraly, I., Nemeth, B., & Odor, P. (2009). The effect of light conditions on herbs, bryophytes and seedlings of temperate mixed forests in Őrség, Western Hungary. Plant Ecology, 204(1), 69–81. https://doi.org/10.1007/s11258-008-9566-z
- Titshall, L. W., O’Connor, T. G., & Morris, C. D. (2000). Effect of long-term exclusion of fire and herbivory on the soils and vegetation of sour grassland. African Journal of Range & Forage Science, 17(1–3), 70–80. https://doi.org/10.2989/10220110009485742
- Tiwari, O. P., Sharma, C. M., & Rana, Y. S. (2020). Influence of altitude and slope-aspect on diversity, regeneration and structure of some moist temperate forests of Garhwal Himalaya. Tropical Ecology, 61(2), 278–289. https://doi.org/10.1007/s42965-020-00088-4
- Treydte, A. C., Heitkonig, I. M. A., Prins, H. H. T., & Ludwig, F. (2007). Trees improve grass quality for herbivores in African savannas. Perspectives in Plant Ecology, Evolution and Systematics, 8(4), 197e205. https://doi.org/10.1016/j.ppees.2007.03.001
- Tserendulam, T., Bayarsaikhan, U., Oyuntsetseg, B., & Wesche, K. (2018). The vascular plant flora of Hustai National Park, Mongolia: Composition, life forms, ecological groups and geographical elements. Feddes Repertorium, 129(2), 137–160. https://doi.org/10.1002/fedr.201700006
- Ullah, H., Khan, S. M., Ullah, S., Jahangir, Z., Ahmad, I., Ali, Z., & Badshah, H. (2022). Vegetation assessments under the influence of environmental variables from the Yakhtangay Hill of the Hindu-Himalayan range, North Western Pakistan. Scientific Reports, 12(1), 20973. https://doi.org/10.1038/s41598-022-21097-4
- Vera, F. W. M. (2000). Grazing ecology and forest history. CABI Publishing.
- Vilches, B., De Cáceres, M., Sánchez-Mata, D., & Gavián, R. G. (2013). Indicator species of broad-leaved oak forests in the eastern Iberian Peninsula. Ecological Indicators, 26, 44–48. https://doi.org/10.1016/j.ecolind.2012.10.022
- Wambulwa, M. C., Milne, R., Wu, Z. Y., Spicer, R. A., Provan, J., Luo, Y. H., Zhu, G. F., Wang, W. T., Wang, H., Gao, L. M., & Li, D. Z. (2021). Spatiotemporal maintenance of flora in the Himalaya biodiversity hotspot: Current knowledge and future perspectives. Ecological and Evolution, 11(16), 10794–10812. https://doi.org/10.1002/ece3.7906
- Wangchuk, K., Darabant, A., Rai, P. B., Wurzinger, M., Zollitsch, W., & Gratzer, G. (2014). Species richness, diversity and density of understory vegetation along disturbance gradients in the Himalayan conifer forest. Journal of Mountain Science, 11(5), 1182–1191. https://doi.org/10.1007/s11629-013-2942-8
- Wang, H., Zhang, M., & Nan, H. (2019). Abiotic and biotic drivers of species diversity in understory layers of cold temperate coniferous forests in North China. Journal of Forestry Research, 30(6), 2213–2225. https://doi.org/10.1007/s11676-018-0795-2
- Wedegärtner, R. E., Lembrechts, J. J., Van Der Wal, R., Barros, A., Chauvin, A., Janssens, I., & Graae, B. J. (2022). Hiking trails shift plant species’ realized climatic niches and locally increase species richness. Diversity and Distribution, 28(7), 1416–1429. https://doi.org/10.1111/ddi.13552
- Whigham, D. F. Ecology of woodland herbs in temperate deciduous forests. (2004). Annual Review of Ecology, Evolution, and Systematics, 35(1), 583–621. 105708. https://doi.org/10.1146/annurev.ecolsys.35.021103
- Zhang, X., Li, X., Ji, X., Zhang, Z., Zhang, H., Zha, T., & Jiang, L. (2021). Elevation and total nitrogen are the critical factors that control the spatial distribution of soil organic carbon content in the shrubland on the Bashang Plateau, China. Catena, 204, 105415. https://doi.org/10.1016/j.catena.2021.105415
- Zhang, J. -T., Zhang, M., & Mian, R. (2016). Effects of elevation and disturbance gradients on forest diversity in the Wulingshan Nature Reserve, North China. Environmental Earth Sciences, 75(10), 1–10. https://doi.org/10.1007/s12665-016-5734-y
- Zhang, J. -T., Zhang, B., & Qian, Z. Y. (2015). Functional diversity of Cercidiphyllum japonicum, communities in the Shennongjia Reserve, central China. Journal of Forestry Research, 26(1), 171–177. https://doi.org/10.1007/s11676-014-0010-z