
 ?Mathematical formulae have been encoded as MathML and are displayed in this HTML version using MathJax in order to improve their display. Uncheck the box to turn MathJax off. This feature requires Javascript. Click on a formula to zoom.
ABSTRACT
Soil erosion is a global problem that threatens sustainability and food security by washing away fertile soil, nutrients, and organic matter. Land use changes, land degradation, and soil erosion are increasing, resulting in annual losses of fertile soil and declining crop yields. The objective of this study was to examine how changes in land use and land cover affected soil erosion dynamics and determine which areas should receive priority for soil and water conservation interventions. The study employs remote sensing and Geographic information system techniques to assess the impact of land use and land cover change on soil erosion between 2004 and 2020. The RUSLE model estimates soil erosion rates. Mean annual rainfall, soil data, 2 m DEM, and satellite images are used to input data into the model to determine soil erosion. The study identifies six land use and cover types and shows that significant changes have occurred in bare land and shrubland, decreasing by 25.48% and 6.17%, respectively, from 2004–2020. On the other hand, forest land increased by 20.19%, and cultivated land increased by 3.52%. Additionally, the study evaluated the response of soil erosion to land use and land cover changes, showed that bare land, cultivated land, and grazing land have the highest annual loss. In contrast, forest land, shrubland, and water bodies have the lowest. The analysis of soil erosion risk indicated a decline in the mean annual soil loss rate at the watershed scale, with rates decreasing from 12.8t ha−1 yr-1 in 2004 to 3.21t ha-1 yr-1 in 2020. The watershed is classified into five severity classes, and the study area was divided into five priority categories based on their average annual soil losses. The study emphasized that prioritizing interventions for watershed types with high erosion risks is crucial for reducing on-site soil loss and off-site effects together with conserving water resources. The findings support the importance of long-term watershed management in reducing soil erosion. To effectively reduce soil erosion and improve environmental quality, it is recommended to encourage afforestation and reforestation, develop sustainable land use policies, strengthen soil conservation measures, and improve monitoring and evaluation of land use changes.
1. Introduction
Land and land cover dynamics are critical factors influencing soil erosion rates globally, including Ethiopia, a country with diverse landscapes and a fragile ecosystem. Soil erosion in Ethiopia leads to the loss of fertile soil, decreased agricultural productivity, and degraded land quality (Alemayehu et al. Citation2021a). Land use and land cover change (LULC) are primary drivers of soil erosion worldwide, particularly in Ethiopia, with its complex topography and diverse ecosystems (Moges et al. Citation2021c). LULC refers to alterations on the earth’s surface caused by natural or human factors, such as replacing natural vegetation with cultivated land, significantly impacting the environment (Tolessa et al. Citation2019).
The expansion of cultivated land contributes to land degradation and poses risks to soil fertility. Numerous scholars in Ethiopia have examined the effects of land use and land cover changes on soil resources globally (Haregeweyn et al. Citation2017, Ebabu et al. Citation2019; Zerihun et al. Citation2018). Assessing and managing soil loss, especially regarding spatiotemporal variation, remains a global challenge (Waltner et al. Citation2020b). Soil erosion is widespread, with millions of hectares of fertile land lost annually due to water erosion and other factors. It hampers sustainable agriculture and economic development, particularly in developing nations (Arekhi Citation2008). Sub-Saharan African countries, including Ethiopia, face high soil runoff rates and crop nutrient depletion, threatening agricultural production and environmental-friendly farming methods (Menale et al. Citation2007b). Severe soil degradation in Ethiopia has led to topsoil loss, declining soil functions, and reduced agricultural productivity (Addis and Klik Citation2015). Soil degradation strips essential nutrients from the fertile topsoil, affecting agrarian productivity (Haregeweyn et al. Citation2017). Understanding the spatiotemporal dynamics of soil erosion in response to land use and cover change is crucial for effective soil conservation and management strategies. This knowledge helps identify areas more susceptible to soil erosion and prioritize interventions for soil and water conservation (LULC). Developing effective soil conservation measures can reduce erosion rates, improve soil fertility, and enhance agricultural productivity in Ethiopia.
Therefore, understanding the spatiotemporal dynamics of soil erosion in response to land use land cover is essential for promoting sustainable land management practices and ensuring food security in the country. This study investigated the impact of land use and land cover change (LULC) between 2004 and 2020 on soil erosion. The Revised Universal Soil Loss Equation (RUSLE) erosion model was used to examine trends of soil loss at the sub-watershed level to determine the mean and total soil loss for different periods. Furthermore, the study examined the spatial distribution of erosion severity to evaluate the overall trends of soil erosion. This study analyzed the spatiotemporal dynamics of soil erosion response to land use, land cover change and climate variability. The specific objectives of the study were to: (1) analyse the trend of LULC changes in the study area over the past 24 years (2004–2020), (2) assess the soil erosion rate in the years 2004, 2012, and 2020 in light of LULC changes and (3) Finally to estimate the soil erosion with different LULC types and assess the potential risk of soil erosion in various sub-watershed and to find the best Soil and Water Conservation (SWC) interventions.
2. Materials and methods
2.1. Description of the study area
Maybar watershed is in the Dessie Zuria district of the South Wollo Zone in the Amhara National Regional State in Ethiopia. It is about 20 km southeast of Dessie and approximately 422 km north of Addis Ababa. The basin covers an area of roughly 113.41 ha and has been a site for research conducted by the Soil Conservation Research Project (SCRP) since 1981. The digital elevation model (DEM) used for the watershed delineation was at a 2 m resolution, and the process was carried out in ArcSWAT. The watershed’s coordinates range from 59’45“N to
30’ 45” N, and
39’15“E to
39’ 45” E (). The catchment area features a highly uneven topography, with an elevation range between 2530 and 2858 a.m.s.l. The Kori Sheleko sub-catchment feeds Lake Maybar, which ultimately flows into the Borkenna and Awash rivers.
Figure 1. Location map of Maybar watershed.
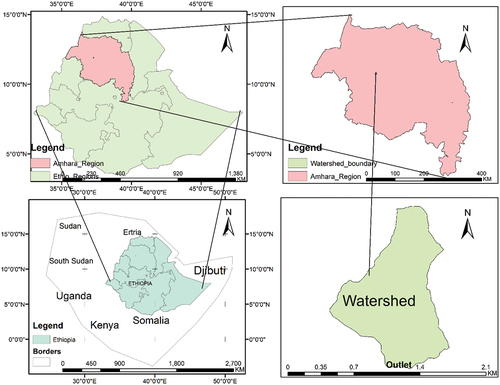
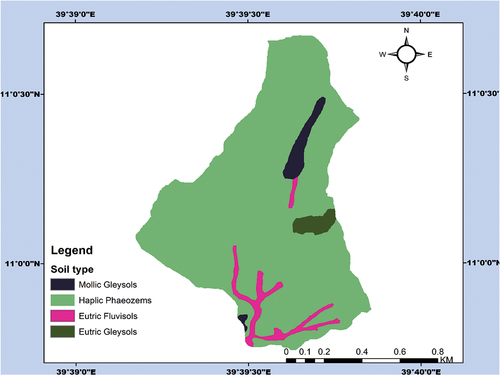
Figure 2. Soil types of the Maybar watershed.
2.1.1. Geology and soil
Shallow phaeozems, usually associated with lithosols, are the predominant soil type in the Maybar watershed. These soils are dark brown and stony, with a clay loam texture, and are generally well structured, although they can be excessively drained. The depth of the soil ranges from 0 to 50 cm, with an average depth of approximately 15 cm. Due to their low moisture and nutrient retention capacity, most of the soils in the area are unsuitable for permanent crop cultivation. In addition to these soils, there are also hydromorphic soils known as mollic gleysols. Due to a high water table, these soils are regularly saturated with water and muddy. The primary soil texture classes in the catchment are sandy clay loam, comprising 80% of the watershed, while the remaining 20% is clay loam (SCRP Citation2000).
According to the Geological Map of Ethiopia (Ministry of Mines Citation1972), Weigel (Citation1986) identified that the Maybar area consists of Alkaline Olivine basalts and tuffs of the Ashangi Groups (Paleocene-Oligocene-Miocene), which are part of the Volcanic Trape series. The site is part of the Afar margin, and the tectonics are dominated by graben faulting. According to the same authors, Colluvial or Aluvial deposits derived from these basalts form the soil’s parent material. Weigel (Citation1986) indicated that the distribution of dirt in the Maybar area is primarily controlled by geomorphic forms (relief) and the history of land use and soil erosion, with climate and geological parent materials having no recognizable impact on soil distribution.
2.1.2. Climate
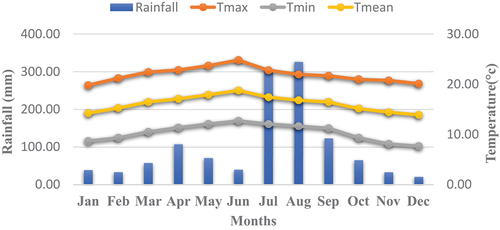
The study watershed typically receives an average annual precipitation of 1275.4 mm. The study area experiences a range of temperatures throughout the year, with annual mean, minimum, and maximum 16.2,10.4, and 21.9°C respectively (). The precipitation in the Maybar Area follows a bimodal pattern with an unpredictable distribution (Hurni et al. (Citation2016). The first rainy season, Belg, is typically observed from March to May from 2004 to 2020. The primary rainy season, Kiremt, occurs from June to September, with a dry season from October to February from 2004 to 2020. The Moist Woina Dega agroecological zone classification is used to characterize the climate in the area, according to Hurni etal. (Citation2016).
Figure 3. Mean annual rainfall and maximum/minimum/mean temperatures for the study area.
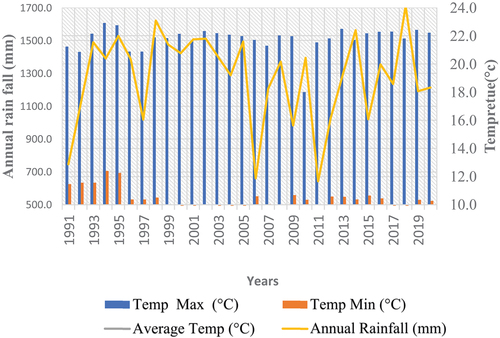
Figure 4. Mean monthly rainfall and maximum/minimum/mean temperatures for the study.
2.1.3. Agricultural activities watershed
The study area is situated on the northeastern side of the Ethiopian highlands and is known as a cereal belt with extensive cultivation. However, the site has a low potential, is prone to erosion, and is ploughed by oxen (SCRP Citation1982 and Bosshart Citation1997b). Approximately 60% of the Maybar catchment is used for cultivation, with cereals and maize being the primary crops, covering around 30% of the total catchment area (Tilahun et al. Citation2021). Maybar has two distinct cropping seasons: Belg, the short spring season, and Kremt, the primary rainy season. Due to lower precipitation levels, cereals are primarily planted during the Belg season, whereas the Kremt season is dominated by pulses that require more water (Tilahun et al. Citation2021).
2.2. Model description (RUSLE)
RUSLE is a technique used to estimate the yearly average amount of soil eroded by water runoff on various agricultural terrains while accounting for particular agricultural and management practices. It is constructed upon empirical data and was initially inspired by the USLE model, which was first proposed by Wischmeier and Smith in 1978; it has more extensive capabilities and incorporates a database that was not available when USLE was initially developed (Renard Citation1997c). RUSLE stands for Revised Universal Soil Loss Equation. It is a widely used mathematical model for estimating soil erosion rates caused by water. The United States Department of Agriculture (USDA) developed the equation in the late 1960s, and has since been revised and modified to improve its accuracy.
The RUSLE equation considers several factors contributing to soil erosion, including rainfall intensity, soil erodibility, slope length and steepness, vegetation cover, and erosion control practices. By considering these variables, the equation provides an estimate of the average annual soil loss in tons per acre or tons per hectare.
The RUSLE model is a versatile computer program continuously being enhanced and adjusted based on feedback from users worldwide. The RUSLE can be used in any land use type where the soil material is subjected to raindrop impact and overland flow caused by rainfall intensity greater than infiltration rate. Generally, the RUSLE model is an empirical model that calculates soil erosion within each pixel, considering all six parameters of the previous USLE model (Renard Citation1997c). This model can be represented as a function of six factors,
A= Rx K x LS x C x P
The six factors in the RUSLE model are denoted as follows: A is used to determine the average soil loss per year over the study period (ton ha-1y-1); R represents the erosivity factor driven by rainfall (MJ mm ha-1 h-1 y-1); K denotes the soil erodibility factor (Mg ha ha-1 MJ-1 mm-1); LS is the topographic factor; C represents the cover factor, and P refers to the support practices (SWC) factor.
R (Rainfall Erosivity Factor): This factor represents the erosive power of rainfall, considering its intensity and duration.
K (Soil Erodibility Factor): The K factor reflects the susceptibility of the soil to erosion, taking into account its properties such as texture, organic matter content, and structure.
LS (Slope Length and Steepness Factor): This factor considers the topographic characteristics of the land, including slope length and steepness, which influence the erosion rate.
C (Cover Management Factor): The C factor represents the impact of vegetation cover and land management practices on reducing erosion. It considers crop residue cover, canopy structure, and conservation practices.
P (Support Practices Factor): This factor accounts for the effectiveness of support practices in controlling erosion, such as terracing, contour farming, and other soil and water conservation measures.
An (Average Annual Soil Loss): The A factor represents the estimated average annual soil loss over the study period and is calculated by multiplying the values of the R, K, LS, C, and P factors.
2.3. Data collection method and source
During the study, a range of data was collected from the national metrological agency, water and land resource center, literature, google earth, and soil survey to accomplish the research aims. Both primary (field) and secondary data sources were used, including satellite images from different years (2004, 2012, and 2020) obtained from Google Earth, a soil sample from the study area, rainfall data from meteorological stations (specifically from the Sirinka Agricultural Research Center), and a 2 m DEM from SCRP and WLRC. The process involved several steps to develop a land use land cover map of the watershed. Firstly, the boundary map of the watershed was exported to facilitate the digitization of the area of interest. This digitization was done using Google Earth, and the resulting data was exported as a KML file. Next, the KML file was imported into the ArcGIS environment, where it was converted into features, enabling further analysis.
In parallel, soil data were collected from representative areas within the watershed. These soil samples were analyzed in a laboratory to determine essential soil properties. The values for the C-factor, which represents the soil erodibility, were assigned based on existing literature that focused on similar agroecological settings and the specific land use types found in the watershed during a particular year. Similarly, the P-factor values, which account for the impact of land use and slope on erosion, were assigned by integrating information from the literature concerning land use types and slope classes.
To calculate the rainfall erosivity factor, precipitation data were collected from a station within the watershed. This data was crucial for evaluating the erosive power of rainfall in the area. By following these steps and integrating various datasets and factors, developing a comprehensive land use land cover map and analyzing the erosion potential of the watershed was facilitated.
2.2.1. Data type and collection methods
To determine the soil erodibility factor (K) and fulfil the research objectives, soil samples were collected using augers in the study catchment area. Their geographic coordinates were recorded with GPS. A gridding technique was employed to collect the soil samples, where sample plots were identified at 250-meter intervals along the longitudinal and latitudinal axes (). Seventeen soil samples were collected at each field at a 0–20 cm depth and later tested in the laboratory.
2.2.2. Data type and collecting methods
Data from various sources were utilized in this study to achieve the research objectives. Rainfall, temperature, and agricultural system data were obtained from secondary sources, specifically from the Sirinka Agricultural Research Center. The study area’s watershed was identified, and slope maps were created using the Water and Land Center Digital Elevation Model. In addition, three periods of land cover maps were used to determine Cand P variables in the RUSLE model. These maps were obtained from https://www.google.com/earth/versions/ provided by the USGS. The images were chosen based on the need to minimize the impact of seasonal variations on vegetation patterns and distribution. The collection of soil samples was done using an auger, and the position of the samples was recorded using GPS technology. The soil samples were tested in the laboratory. The gridding method collected soil samples at 250 m intervals along the longitudinal and latitudinal axis (). Soil samples were collected at 0–20 cm depth at each plot. The soil erodibility factor (K) was then calculated using the collected soil samples.
2.2.3. Materials and tools
The study used various equipment and materials, including a computer with image processing software, augers for collecting soil samples, GPS for tracking locations, and geographic information systems and remote sensing for analyzing land degradation. In addition, RUSLE models and Google Earth were employed for data analysis, with the latter utilized for evaluating land use and cover before conducting fieldwork. The data required for RUSLE input parameters were sourced from diverse sources detailed ().
Table 1. Data used and source.
2.3. Data analysis methods
2.3.1. Land use and land cover change (LULC) analysis
LULC maps were created using ArcGIS 10.8 software to digitize images from Google Earth. The Google Earth image was from the same year as the simulation periods to ensure a more accurate system representation. Shalaby (Citation2012) suggested that pixel-based classification on Google Earth imagery to identify land use and land cover may decrease accuracy due to its high level of detail and acceptable spatial resolution. To address this issue, on-screen digitization was utilized instead of pixel-based classification. On-screen digitization has been found to provide an accurate representation of land use mapping, albeit a more time-consuming process for larger areas (Myint et al. Citation2011, Shalaby Citation2012).
ArcGIS software was used to create a 20-meter buffer around the watershed boundary. That data was then imported into Google Earth Pro as a shapefile for the study’s image digitization. Small land cover areas were also delimited and overlaid on the ArcGIS environment once the primary land use/land cover types were determined. The catchment’s land features and covers were mapped on Google Earth and imported into a geographic information system. We engaged a senior hydrologic observer with over a decade of experience in the watershed while digitizing to guarantee precision. The land use of the study area is described in . While “land cover” referred to the ground’s covering, “land usage” referred to the land’s intended function.
Table 2. Land use Description of the study area (Tesfaye et al. Citation2017).
2.3.2. Soil erosion estimation
The RUSLE model (2004, 2012, and 2020) analyzed three different periods of soil erosion in the watershed. The model considers various factors such as climate, soil type, topography, land cover and management, and soil conservation practices, mapped using GIS software. Data sources for these parameters were gathered from various sources, including DEM, soil samples, and remotely sensed data (), each with different formats, projections, quality, and resolution. ArcGIS software was used to manage and analyse the data, allowing for the creation of detailed maps and accurate analysis. The mathematical equation for RUSLE is:
A = R × K × LS × C × P(1)
where: A = average annual soil loss (in tons per acre or tons per hectare per year) R = rainfall erosivity factor K = soil erodibility factor LS = slope length and steepness factor C = cover management factor P = support practice factor
The RUSLE method was employed to simulate soil erosion at three different time intervals, specifically in 2004, 2012, and 2020, with dynamic parameters being assigned correspondingly. While the LS-factor, K-factor, and erosion control remained constant, the R-factor, P-factor, and C-factor were treated as varying parameters across the years.
2.3.2.1. Rainfall erosivity (R) factor
The index, known as the R-factor, measures precipitation’s capacity to remove and transport soil particles. To calculate this factor, the intensity and maximum rainfall duration in a specific region are examined based on experimental data obtained from prior studies. The R-factor is a gauge of the relationship between rainfall and the potential for erosion, as determined by the quantity and rate of runoff. The computation of the R-factor involves multiplying the kinetic energy of each rainfall event with the maximum 30-minute rainfall intensity. By summing up the erosivity factor of multiple rainfall events recorded over a given period, the cumulative rainfall erosivity factor can be determined. When dealing with an unmeasured watershed, the R-factor can be approximated by employing average annual rainfall data from nearby weather stations. For this investigation, the R-factor was computed using precipitation information from a weather station inside the watershed between 1991 and 2020, overseen by the National Meteorology Agency (NMA) of Ethiopia. The calculation of the R-factor in this study was executed via equation 2, developed by Wischmeier and Smith (Citation1978a). For Ethiopia, modified by and utilized by Hellden (Citation1987a), Ayele et al. (Citation2018) and Legesse et al. (Citation2022b):
-8.12 (2)
R implies erosivity (MJ mm ha−1 h−1y−1), and P = mean annual precipitation (mm/year).
2.3.2.2. Soil erodibility (K) factor
Soil erodibility refers to the degree to which the soil or surface material is prone to erosion (Morgan, Citation2005). It is strongly associated with the physical characteristics of the soil (Lal and Stewart, Citation1990b), such as the percentage of sand, silt, clay, and soil organic matter (Millward, A and Mersey J Citation1999). Additionally, it describes the soil’s resistance to detachment and transport. The topographic position, slope gradient, and degree of tillage disturbance can influence soil erosion resistance, but the primary factors are the soil properties themselves.
The erodibility of a particular soil is determined by its texture, structure, permeability, and organic matter content (Wischmeier and Smith, Citation1978). Organic matter reduces soil erodibility and susceptibility to detachment but increases infiltration. The area’s primary soil classification is haplic phaeozems, with K-factor values varying from less than 0.1 for the soil least prone to erosion to nearly 1.0 for the most susceptible soil.
Where each fraction of soil has its formula:
The variables in the equation are defined as follows: Ms represents the percentage of sand content (0.05–2.00 mm diameter particles), Msilt represents the percentage of silt content (0.002–0.05 mm diameter particles), Mc represents the percentage of clay content (<0.002 mm diameter particles), and organic represents the percentage of organic carbon content in the layer.
2.3.2.3. Estimating slope (S) and gradient length (L) factors
The LS factors are commonly used to quantify the impact of slope gradient on soil erosion. Kaltenrieder (Citation2007a) computed the soil loss rate using a standard slope length of 22 meters and a slope steepness of 9%, adjusted according to the site-specific conditions. It has been observed that soil erosion rises as the slope gradient increases and the slope length becomes longer.
The LS factor was derived from a 3-arc-second SRTM DEM with a 2-meter resolution. The origin of this data is the (SCRP Citation2000), located in the (WLRC) in Addis Ababa, Ethiopia. It has a resolution of 2 meters by 2 meters.
The study watershed shapefile was used to extract the DEM, which underwent raster calculation to determine the L and S factors. Before the computation of LS factors, the slope angle and flow accumulation had to be pre-processed. The DEM was utilized as an input to process the slope angle and flow accumulation in ArcGIS Spatial Analyst with the arc hydro tools extension. The L factor was calculated using equation 10 based on the improved RUSLE equations described by Wischmeier and Smith (Citation1978a).
2.3.2.4. Cover management factor (C)
Determining crop management factors (C) is essential in evaluating the effectiveness of support strategies. The C value approximates the soil loss ratio using support techniques to conventional up and down-slope farming (Ganasri and Ramesh Citation2016). C values range from 0 to 1, where a value closer to 0 indicates good conservation practices, and a value approaching 1 suggests poor conservation practices. The C factor in the RUSLE formula ranges from 0.001 for dense forests to 1.0 for bare land (Arekhi Citation2008; Wischmeier and Smith Citation1978a), reflecting the level of soil protection under specific land cover management. As (LULC) type changes, so does the C factor, calculated after determining the LULC type of the specified area. The C factor was computed from the LULC map, and values were assigned to all the LULC classes based on related literature on C-factors in the tropics (). A field was added in the attribute table, and the ArcGIS raster calculator was used to convert these values to a raster, producing C-factor maps for successive years. These maps were then used as inputs in the RUSLE model.
Table 3. C-factor value based on Hurni (Citation1985) and Nigussie et al. (Citation2017).
2.3.2.5. Conservation or supportive practices(p)
The conservation management factor (P) determines the soil loss ratio using a particular support technique, unlike tillage practices that are either upslope or downslope (Renard et al. Citation1997c). The P factor modifies the RUSLE for soil conservation tillage methods. The P value ranges from 0 to 1, with 0 indicating excellent mechanical erosion resistance practices and 1 indicating no natural erosion resistance practices (). The P factor represents the soil loss ratio with a specific erosion control practice to the soil loss without any erosion control measures (Wischmeier and Smith Citation1978a). In the absence of erosion control, the P value is 1, which is close to zero when practical erosion control measures are implemented. Erosion control techniques such as contour strip-cropping, tillage on the contour, terrace systems, and grassed waterways act as barriers for runoff velocity, reduce soil erosion, and tend to decrease the P factor (Arekhi et al. Citation2008).
Figure 5. Slope class of the study area.
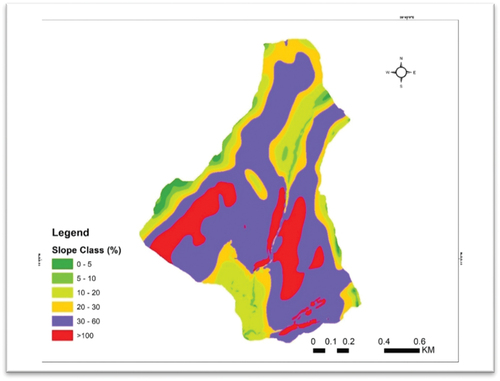
Figure 6. Flow chart of the analysis.
3. Result and discussion
3.1. Trend of (LULC)
This study identified six different land use and land cover types in the study area: forest, shrub, grazing, cultivated, bare, and settlement lands. However, an additional land use type, water body land use, existed between 2012 and 2020, resulting in seven land use types. Accurately classifying these categories was vital to analyse the effects of land use changes on the environment and could help establish sustainable land management practices. The results of this study could have significant implications for land-use planning and management, natural resource conservation, and biodiversity preservation in the study area.
() displays the classification results for Google Earth images from 2004, 2012, and 2020 and provides comprehensive statistical information for each land use class (LULC) map for the study duration. The primary land use types in the study area were bare land (33.6%), forest land (36.1%), and cultivated land (49.8%) in 2004, 2012, and 2020, respectively.
Table 4. Land use type in Maybar watershed for 2004, 2012, and 2020.
Accurately classifying these categories was vital to analyse the effects of land use changes on the environment and could help establish sustainable land management practices. The results of this study could have significant implications for land-use planning and management, natural resource conservation, and biodiversity preservation in the study area.
3.1.1. Lulc 2004
The findings from the land use and land cover (LULC) classification analysis conducted for 2004 reveal a comprehensive picture of the study area. The research shows that the study area was predominantly characterised by bare and cultivated land, accounting for 33.6% and 31.9% of the area, respectively. Forest land and shrubland followed closely, with 15.9% and 11.5% coverage, respectively. Additionally, grazing land and water body land use constituted only 3.5% of the study area each. () visually presents these outcomes, highlighting the dominant LULC types in the watershed for 2004.
Figure 7. Land use and land cover of the study area (2004).
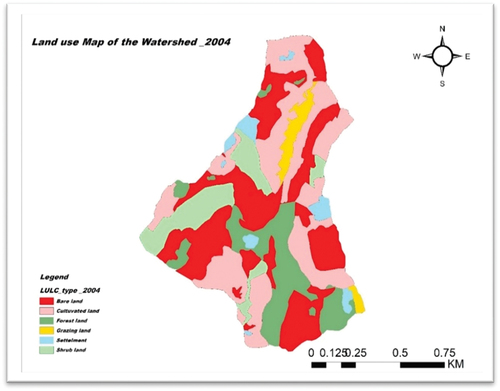
Barren lands were also prevalent in the watershed, although not as dominant as bare and cultivated lands. In contrast, grazing and settlement land had the least coverage among all LULC types, indicating their limited impact on the study area.
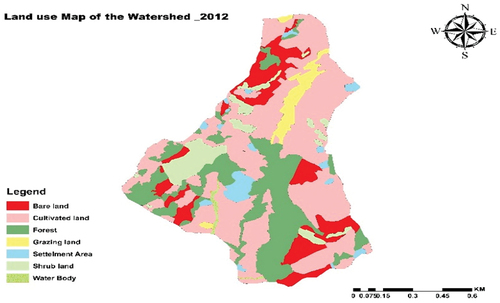
3.1.2. (Lulc) 2012
The examination of the image classification conducted in 2012 showed that the dominant land use type in the study region was cultivated land, which covered about 49.8% of the total area, while forest was the second-largest land use type, accounting for 22.9%. The remaining land use/land cover types, including shrubland, forest, and barren lands, collectively occupied 27.3% of the total area. Water bodies had the least coverage area among all other classes, making up only 0.5% of the site ().
Figure 8. Land use and land cover of the study area (2012).
3.1.3. (Lulc) 2020
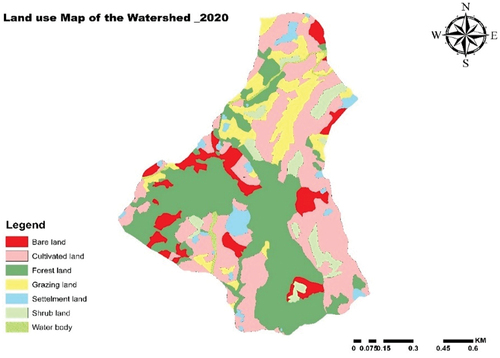
After conducting (the LULC) classification of the 2020 image, the results showed that forest land and cultivated land were the most dominant categories, covering 71.4% of the study area. Specifically, forest land covered 36.1% of the site, while cultivated land occupied 35.3%, indicating equal prevalence. The remaining land use/land cover types, including grazing land (10.2%), barren lands (6.5%), water bodies (1.1%), shrubland (0.5%), and settlement (0.3%), collectively accounted for 28.6% of the total area ().
Figure 9. Land use and land cover of the study area (2020).
3.2. Land use land cover change (LULC)
This research investigated LULC changes in the study area from 2004 to 2020. The study analyzed 2004, 2012, and 2020 satellite images to assess LULC changes over different periods. The analysis indicated that the study area’s most dominant land use and cover types were cultivated land, bare land, and forest land. At the same time, water bodies were less prominent and only appeared in 2012 and 2020. From 2004 to 2020, cultivated land and forest land areas increased by 49.8% (56.4 ha) and 36.9% (40.9 ha), respectively. Conversely, the bare land and shrubland area decreased by 25.5% (28.9 ha) and 6.2% (7 ha), respectively. During 2004–2012, the reduction in shrubland and bare land was more significant, while the decrease in settlement land was lower ().
Table 5. Trend of LULC 2004 – 2020.
Over the 24 years from 2004 to 2020, there were significant changes in the land use and land cover of the study area. The forest land area increased from 18 ha in 2004 to 26 ha in 2012, reaching 40.9 ha in 2020. The increase in the cultivated land area resulted in the reduction of forest, shrubland, and grazing land. Bare land and shrubland experienced the most significant size reduction, declining by 28.9 ha (25.5%) and 7 ha (6.2%) between 2004 and 2020. This decrease in bare land may have led to a reduction in surface runoff in the study area. Additionally, a new land use class, water bodies, emerged after 2012, which could be accredited to the impact of watershed management practices.
3.3. RUSLE parameter for soil loss estimation
3.3.1. Rainfall erosivity(R)
The study area had an average annual rainfall of 1402 mm, 1097.4 mm, and 1322.8 mm for 2004, 2012, and 2020, respectively. Using the Hans Hurni method and the regression equation developed by Hurni (Citation1985) for Ethiopian conditions, the R-factor values were computed for the respective years and found to be 776.99, 606.42, and 732.6 MJ mm ha−1 h−1 year−1. The calculated values of rainfall erosivity are presented in a which indicates that the R-factor values varied between 606.42 and 776.99 MJ mm ha−1 h−1 year−1, with an average value of 705.348 MJ mm ha−1 h−1 year−1 (). This implies that the mean annual precipitation impacts the value of the R-factor since changes in the mean yearly precipitation result in changes in the R-factor value.
Table 6. Mean annual rainfall and erosivity factor of the study area.
3.3.2. Soil erodibility (K) factor
A research study was conducted in the watershed area to analyse the physical and chemical properties of soil samples collected from various points. The study showed that the K-factor values in the area ranged from 0.053 to 0.11, with an average value of 0.099 (). This value falls within the range of K-values for Ethiopian soils reported by FAO in 1984, which is between 0.05 and 0.6. These findings suggest that the ground in the study area is prone to erosion, and appropriate soil conservation measures should be taken to prevent soil loss. However, soil erosion is decreasing because of the soil and water conservation measures implemented there. The coefficient of variation is 0.1,0.2,0.14 and 0.29 for organic matter, percentage of clay, percentage of silt and sand respectively ().
Figure 10. Soil sample distribution (left) and soil erodibility (K) factor map (right).
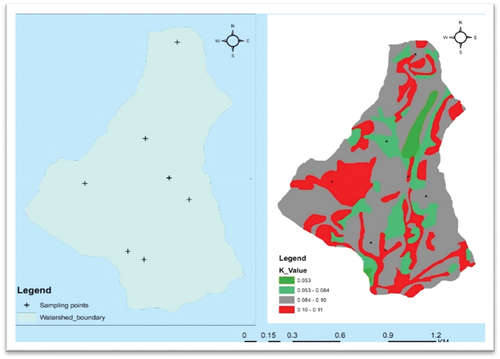
Table 7. Statistically summary of soil parameters in the watershed.
() provides the distribution of soil types and their erodibility values in the Maybar watershed. The soil types were identified using a soil map of the Maybar watershed created by Weigel (Citation1986). Seven distinct soil types were identified, including mollic gleysols, haplic phloeozems, eutric fluvisols, and eutric regosols, commonly used in categorizing environmental soil types. Shallow phaeozems were found to be the most common soil type in the watershed, covering 91.6% of the catchment area with a depth of approximately 15 cm. gleysols, eutric eluvisols, and eutric regosols covered the remaining 8.4% of the watershed’s land area. The erodibility values of these soil types fall within the range of what is typically reported for Ethiopian soil K values, with a mean value of 0.099.
Table 8. Soil type and corresponding erodibility factor of the watershed.
3.3.3. Slope and gradient length (LS) estimation
In studying erosion’s impact on topography, slope length is a significant factor that interacts with slope gradient (S). Slope length (L) accounts for the proportionality of erosion with slope length and its increase as the slope becomes steeper. The flow length factor was the horizontal distance separating the origin of overland flow from the point where the slope gradient decreases, allowing for deposition or runoff to become concentrated in a channel. Meanwhile, the slope gradient factor (S) assessed the impact of slope gradient on erosion. The LS factor is an essential component of the Revised Universal Soil Loss Equation (RUSLE), which determines the topography’s impact on soil erosion. To generate the LS factor, digital elevation models (DEM) with a 2 m resolution were created from contour maps obtained from the Water and Land Resource Center Project. The slope and flow accumulation maps were also produced using ArcGIS with the DEM.
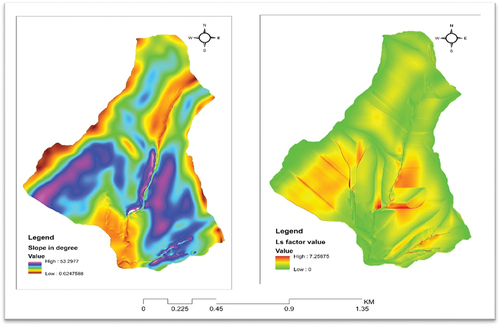
The interplay between slope angle and slope length significantly impacts the extent of erosion, and therefore, both should be considered jointly (Edward Citation1987b). Our study area showed that the LS factors ranged from 0 in flat regions to 7.25 in the watershed’s steeper and longer slope areas. The incremental increase in LS factors from 0 to 7.25 indicates potential erosion as slope steepness increases. Approximately 34.8% of the study area comprises slopes with a gradient ranging from 30–50% (steep slope) ().
Figure 11. Slope in degree (left) and ls _factor value (right).
According to the data presented in , soil loss rates varied depending on the slope gradient. An increase in slope gradient corresponded with an increase in soil erosion rates. For slopes less than 5 degrees, the rate of soil loss was the lowest, with values of 0.04 t ha-1 yr-1 in 2004, 0.03 t ha-1 yr-1 in 2012, and 0.1 t ha-1 yr-1 in 2020. Soil loss rates for 5–10 degrees slopes were 1.5 t ha-1 yr-1 in 2004, 0.38 t ha-1 yr-1 in 2012, and 0.4 t ha-1 yr-1 in 2020. The soil loss rates for 10–20 degrees slopes were 2.5 t ha-1 yr-1 in 2004, 0.79 t ha-1 yr-1 in 2012, and 0.8 t ha-1 yr-1 in 2020. Similarly, soil loss rates for 20–30 degrees slopes were 8.09 t ha-1 yr-1in 2004, 1.7 t ha-1 yr-1 in 2012, and 3.0 t ha-1 yr-1 in 2020. For 30–50 degrees slopes, soil erosion rates were 15.7 t ha-1 yr-1 in 2004, 6.0 t ha-1 yr-1 in 2012, and 3.1 t ha-1 yr-1 in 2020. The rate of soil loss for slopes of 50–100 degrees was 21.9 t ha-1 yr-1in 2004, 8.25 t ha-1 yr-1 in 2012, and it is expected to be 6.0 t ha-1 yr-1in 2020. Lastly, the soil erosion rates for slopes greater than 100% were 1.4 t ha-1 yr-1 in 2004, 0.079 t ha-1 yr-1 in 2012, and 0.1 t ha-1 yr-1 in 2020. These findings suggest the slope gradient strongly influences soil loss within the watershed. Soil erosion rates increase as the slope angle increases.
Table 9. Estimated soil loss with slope gradient in 2004 and 2020.
3.3.4. Land cover/management(C) factor
The impact of land management practices on soil erosion can be evaluated by utilizing the C-factor, a numerical value ranging from 0 to 1. A lower value of the C-factor represents lower soil erodibility, while a higher value indicates higher erosion potential. The spatial distribution and magnitude of the C-factor throughout the watershed can be visualized ().
Figure 12. Cover management factor (C-Value) for the three study years.
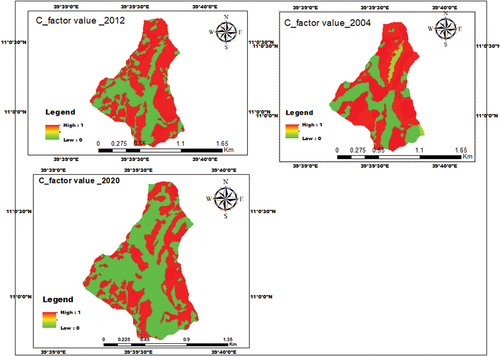
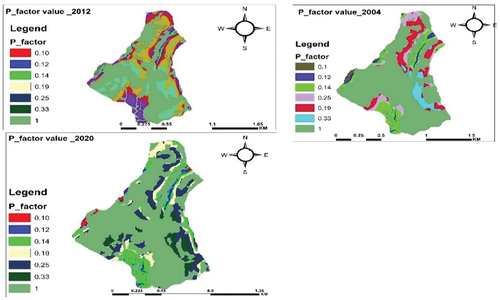
Figure 13. P _factor map for Maybar watershed for the years 2004,2012 and 2020.
In 2004, the land cover of the watershed consisted of forests (15.9%), grassland (3.5%), cropland (31.85%), shrubland (11.5%), and settlements (3.5%), as revealed by supervised classification. By 2012, the percentages had changed to bare land (12.7%), shrubland (6.9%), cultivated land (49.55%), forest land (22.95%), grazing land (3.6%), water body (0.5%), and settlements (3.5%). By 2020, the distribution of land use had further altered to bare land (48.05%), shrubland (5.26%), cultivated land (35.36%), forest (36.11%), grazing land (10.42%), water body (1.10%), and settlements (1.10%). After analysing the land use classifications, specific C-factors were assigned to each land use type in the watershed. The C-factor is a metric that measures the impact of land cover management practices on soil erosion. It is expressed as a numerical value that ranges from 0 to 1, with lower values indicating less erodible soil and higher values indicating a tremendous potential for erosion. A C-factor closer to 0 indicates a lower tendency for soil erodibility, while a value closer to 1 indicates a higher tendency for erosion. Vegetative cover, habitation, grassland, and arable land were assigned C-values of 0.015, 0.03, 0.04, and 0.16, respectively. Additionally, protected land was given a value of 0, and unprotected land was given a value of 1 according to the C-factor categorization system (Hurni et al. Citation1998b).
The suitability of the northern highlands for human settlement led to the widespread removal of vegetation cover for agricultural lands. This practice and intensive farming practices exacerbated soil erosion, resulting in the loss of fertile topsoil and essential nutrients. This left shallow and infertile soils with poor water retention capacity (Hurni Citation1998, Hurni et al. Citation2010). Croplands were particularly vulnerable to erosion since they were frequently tilled, vegetation was removed before planting, and the land remained bare between two seasons (Pimentel Citation2006).
The distribution of the C-factor, which characterized the degree of land cover management and its impact on soil erosion, varies significantly across land use types and periods. Forest and shrubland exhibit the lowest C-values, while bare land and cultivated fields (associated with poor land cover management) show the highest values, implying that increased C-factors correspond to more severe soil erosion in the study region. The representation of the C-factor in () displays how it varies over time and space. The data indicate a decrease in soil erosion over time and space, suggesting that the measures taken to reduce erosion have been effective.
3.3.5. Conservation practice factor (P)
The P-factor represents the conservation measures implemented to control surface runoff velocity and minimize soil loss (Wischmeier and Smith Citation1978a). In this study, data were utilised as inputs to compute and generate the P-factor map due to the lack of comprehensive information on the different protection measures employed in the research area, land use, and slope gradient. Based on the RUSLE analysis, agricultural lands had P-factors ranging from 0.1 to 0.33, while other land uses were assigned a P-value of 1, as presented in .
Table 10. Support practices (P) factor based on (Wischmeier and Smith Citation1978a).
3.4. Soil loss estimation
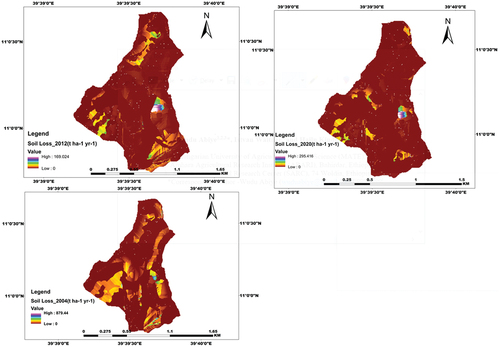
Using GIS software, the annual soil loss in a study watershed was calculated based on five input parameters of the RUSLE model. These parameters were organized in a grid format with a cell size of 2 m × 2 m, and some parameters varied spatially and temporally. The resulting map layers of soil erosion controlling factors were used to generate a raster map of soil erosion risk for 2004, 2012, and 2020. A potential annual soil loss map for the watershed was developed in the study, and the findings indicate that the mean annual soil loss for the entire watershed was roughly 12.8 t ha −1 yr−1 in 2004. During the study period in 2004, a cumulative soil loss of 99,728.4 tons was observed across the entire watershed
The study found that in 2012, the mean annual soil loss for the entire watershed was approximately 4.8 t ha-1 yr-1. Furthermore, the total yearly soil loss for the whole of the watershed during the study period in 2012 was about 19,167.3 tons. The average soil erosion rate in 2012 decreased by 8.0 t ha-1 yr-1 compared to 2004, primarily due to land use and land cover changes, such as the conversion from bare land to forest and shrubland. The study analyzed the annual soil loss in the watershed for 2020 using the RUSLE model. The results showed that the yearly soil loss varied from 0 to 295.4 t ha−1 yr-1 in areas with high erosion vulnerability. The average annual soil loss for the entire watershed was estimated to be 3.21 t ha-1 yr-1. Compared to the average rate in 2012, the average rate of soil erosion decreased by 1.59 t ha-1 yr−1, which can be attributed to the long-term management of the watershed and the implementation of physical and biological soil and water conservation measures(). These efforts led to an increase in forest land use in 2020 and a decrease in the general trend of soil erosion.
Figure 14. Annual soil loss map in 2004, 2012 and 2020 of the watersheds.
The loss of soil annually in a particular watershed was calculated to be between 3.21–12.8 t ha-1 yr-1, which falls within the tolerable soil loss level of 2–16 t ha-1 yr-1 (Hurni Citation1983). This finding aligns with earlier research in Ethiopia’s upper Blue Nile basin and other areas.
Habtamu et al. (Citation2020) reported that the average annual soil loss in the Huluka area of Central Ethiopia’s Oromia region ranged from 14.4 to 27 t ha−1 year−1 between 1998 and 2018. Similarly, Ajanaw (Citation2021) found that the mean annual soil loss was between 6.2 to 25.07 t ha-1 yr-1 in the Chereti watershed of North Eastern Ethiopia. However, other studies have reported higher soil erosion rates than the present study. For instance, Meseret and Habtamu (Citation2021) observed 76.5 t ha-1 yr -1 in the Fincha Catchment of Ethiopia, Tadele B et al. (Citation2022) observed 62.5 t ha-1 yr -1 in the Coka watershed of Southern Ethiopia, and Zerihun et al. (Citation2018) found 49 t ha-1 yr-1 in the Dembecha district of North-western Ethiopia. The implementation of soil and water conservation measures in the study watershed since 1990 and proper watershed management may have contributed to the relatively low average annual soil loss observed in the area (Tena etal. Citation2018). Furthermore, the dominant soil type in the Watershed is Phaeozems, which contain iron oxides that act as a binding agent, resulting in increased aggregate stability and resistance to erosion.
3.4.1. Impacts of land use land cover dynamics on soil erosion
The contribution of land use and land cover to soil erosion hazards is well-known (Rozos et al Citation2013). Physical factors are crucial for land-use planners to consider when engaging in spatial planning (Bathrellos et al Citation2013). Therefore, integrating spatial and temporal variations in land use, land cover, and soil erosion hazard maps is essential for effective land-use planning (Tsegaye et al., Citation2010). In Ethiopia, soil erosion hazard rates have significantly increased due to land use and land cover changes such as the expansion of cultivated land and deforestation (Mariye et al. Citation2019; Tsegaye et al. Citation2010; Weldu and Haraka Citation2020). Thus, managing land use and cover effectively to mitigate soil erosion hazards and ensure sustainable land resource utilization in Ethiopia is crucial.
Tsegaye et al. (Citation2010) estimated that soil loss in the highlands of Ethiopia ranged between 1,248 and 23,400 million tons per year across 78 million hectares. This represents a range of 16 to 300 tha−1 yr−1 for pasture, degrees, and cultivated fields across the country.. Soil erosion rates are higher on steep slopes with minimal vegetation cover, where soil loss can exceed 300 tons ha-1 yr-1. However, the study found that the mean annual soil loss decreased gradually over the study period, with rates of 12.8, 4.8-, and 3.21 tha−1 yr−1 in 2004, 2012, and 2020, respectively (). This decrease in soil erosion is due to long-term watershed management practices. The study also observed a decline in bare land use and an increase in forest land use, contributing to the decreasing trend of soil erosion. Changes in land use dynamics are among the factors that contribute to soil erosion hazards, and physical factors play a critical role for land-use planners in spatial planning. Thus, it is essential to integrate spatial and temporal variations in land use, land cover, and soil erosion hazards into hazard maps for effective land-use planning. These findings are consistent with previous studies and suggest that soil erosion rates can vary over time.
Table 11. Temporal variation of soil erosion with land use dynamics.
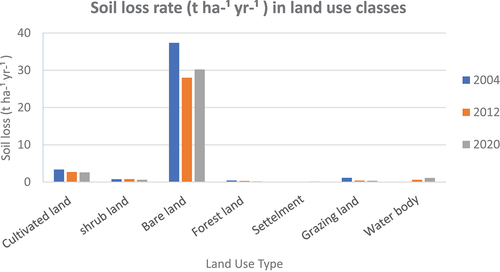
Using zonal statistics analysis in ArcGIS, we examined the effects of land use and land cover on soil erosion. Our findings indicate significant variation in mean annual soil loss rate values across land use and cover classes. Specifically, bare lands had the highest mean value of soil loss (ranging from 28.0 to 37.34 that-1 yr-1) followed by cultivated land (ranging from 2.6 to 3.34 t ha-1 yr−1) and grazing land (ranging from 0.33 to 1.12 t ha−1 yr−1) ( and ).
Table 12. Distribution of annual and mean soil loss between different types of land use during (2004, 2012, and 2020).
In contrast, forest land had the lowest value, followed by shrubland (ranging from 0.17 to 0.42 t ha−1 yr−1) and (from 0.6 to 0.755 t ha−1 yr-1), respectively.
These results indicate that land use and land cover dynamics significantly impact soil erosion rates, with bare and cultivated land more susceptible to soil erosion. Additionally, we observed that as the trend of bare land decreases and forest coverage increases, watershed soil erosion decreases from 2004 to 2020.
As illustrated on () the soil loss rate is vary based on the land use type and year to year.
Figure 15. Variation in mean soil loss in different land use classes and years.
The study area covered four different soil types, with Haplic Phaeozems being the most dominant, covering more than 91% of the site (). Analysis of soil loss rates across these soil types revealed varying erosion rates (). Particularly, the highest risk of soil erosion was observed in Eutric Gleysols, Eutric Fluvisols, and Haplic Phaeozems. Erosion rates in Eutric Gleysols (2.1 ha or 2.6%) were 37.3 t ha −1 yr−1 in 2004, 51.0 t ha −1 yr−1 in 2012, and 41.0 t ha −1 yr−1 in 2020. Similarly, erosion rates in Fluvisols (4.4 ha or 3.9%) were 26.3 t ha −1 yr−1 in 2004, 3.4 t ha −1 yr−1 in 2012, and 3.1 t ha −1 yr−1 in 2020. In contrast, erosion rates in Phaeozems (103.9 ha or 91.6%) were lower, at 13.3 t ha −1 yr−1 in 2004, 4.4 t ha −1 yr−1 in 2012, and 6.1 t ha −1 yr−1 in 2020.
Table 13. Soil erosion across different soil types during 2004, 2012, and 2020.
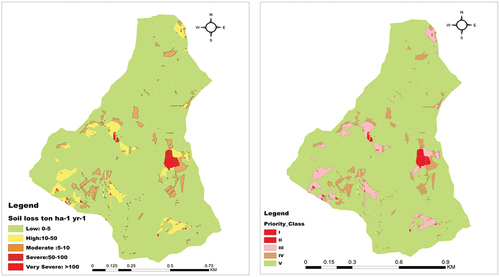
The severity class was adjusted based on the average erosion rate in each sub-watershed and the specific characteristics of the watershed. This study created six severity classes to generate the severity map for the sub-watersheds, ranging from highly severe (I) to low erosion class (VI). These categories were defined as follows: low erosion severity (<5 tons ha-1yr-1), moderate erosion (5–10 t ha -1 yr−1), high erosion category (10–50 t ha -1 yr-1), severe (50–100 t ha -1 yr-1), very severe (100–500 t ha -1 yr-1), and extremely severe (>500 t ha −1 yr−1).
Based on the severity class categories, 62.2%, 82.6%, and 88.5% of the watershed were classified as low severity class, 6.2%, 5.3%, and 3.9% of the watershed as moderate severity class, 22.3%, 9.4%, and 5.4% of the watershed as high severity class, 7.0%, 0.9%, and 0.6% of the water as severe class, 0.7%, 0.6%, and 0.4% of the watershed as very severe class, and 0.1%, 0%, and 0% of the watershed as a highly severe class in the years 2004, 2012, and 2020, respectively ().
Table 14. Soil erosion classification based on Morgan (Citation2005a).
The findings in () indicate that there has been no extreme soil erosion class since 2004, most likely due to the long-term watershed management strategies employed in the study area. The results show that 88.5% of the Maybar watershed is now classified as low-risk for soil erosion. However, it is essential to note that this does not mean conservation measures are no longer necessary in this area. Immediate soil and water conservation measures are still required for the remaining parts of the watershed at higher risk of erosion. Additionally, it is essential to ensure that even the low-risk areas continue to improve their conservation measures to prevent future erosion.
3.5. Prioritization of the watersheds for conservation planning
The RUSLE model is an essential tool for conservation planning that enables a comparison of soil erosion risk across a study area. This information is critical for identifying areas within a watershed that are at high erosion risk and require prioritization for intervention. In this study, the watershed was divided into five classes based on soil erosion severity, with the area coverage ranging from 0.5 ha (SW5) to 100.3 ha (SW2). The severity classification was based on the extent of soil erosion, as it is determined by the rate of soil loss per hectare. When the soil erosion rate increases, it indicates a higher severity level, meaning that more soil is being lost per hectare per year. The soil loss class for each part of the watershed was determined based on the information provided in ( and ). Based on this, it can be inferred that the number and extent of hotspot areas in the watershed have decreased. The observed changes range from a reduction in severity class (e.g., very severe to medium) to a shift from low to medium severity class. These findings suggest that some highly degraded areas have been improved due to soil and water conservation measures implemented by the community in the watershed with the assistance of various non-governmental organisations.
Figure 16. Soil erosion severity map.
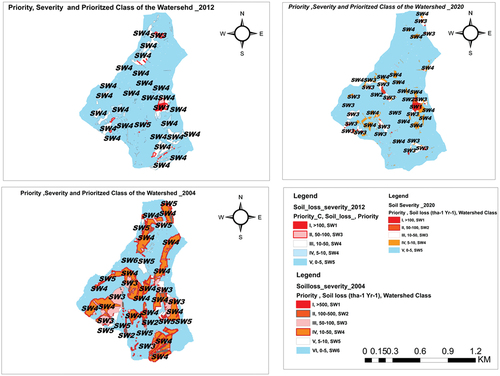
Table 15. Prioritized part of watersheds for conservation planning purposes.
According to the data presented (), there has been a decreasing trend in the severity of soil erosion from 2004 to 2020. This suggests that changes in land use and land cover have had a positive significant impact on reducing soil erosion. Additionally, there has been a reduction in soil loss per hectare of land over the same period, and the area requiring immediate soil and water conservation measures also shows a decreasing trend. According to () the percentage of the severe soil erosion class has decreased over time. Specifically, the rate of the severe class was 7.8% in 2004, 1.5% in 2012, and further reduced to 1% in 2020. 2004 the catastrophic severity class was identified, but this class was not observed in the 2012 and 2020 classifications. This suggests that efforts to reduce soil erosion, such as changes in land use and conservation measures, have positively impacted the severity of soil erosion over time. The soil severity class is vary from place to place and also year to year().
Figure 17. Annual soil loss and severity class map of the Maybar watershed.
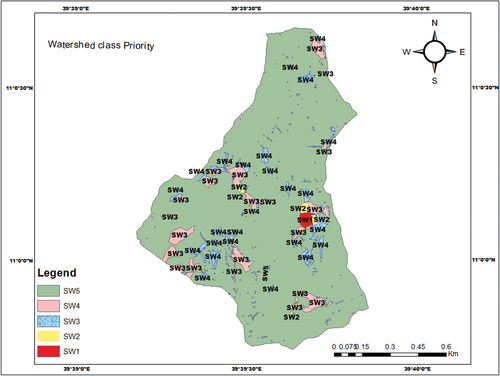
The identification of priority areas for conservation planning in the watershed was determined by evaluating the mean annual soil loss rates during the study period 2020 and also by considering the average annual soil loss for each of the respective watershed categories. The classification of soil erosion severity classes was based on the yearly average soil erosion rates, which were divided into five priority classes according to Morgan (Citation2005a) Low (0–5), Moderate (5–10), High (10–50), Severe (50–100), and Very Severe (>100) t ha-1 yr-1. The watersheds were grouped into five severity classes based on their mean soil loss rates. Out of the 52 watersheds courses, one was classified as having low soil loss severity, 24 as having moderate soil loss severity, 26 ranged from high to severe soil loss severity class, and one as extremely powerful soil loss severity. Effective implementation of soil and water conservation strategies is crucial to ensure sustainable land use practices in the entire watershed, as demonstrated by the mean annual soil loss rates of all the watershed classes in . Prioritizing conservation efforts is crucial for successful outcomes and identifying areas that require immediate attention for appropriate remedies. Severity classifications based on soil loss amounts can help identify vulnerable watershed areas. The more sensitive a watershed is to erosion, its higher priority is developing management strategies to prevent soil and nutrient losses. Watershed classes have been ranked based on average soil loss per hectare per year. As described, the largest watershed class (SW5) covering 100.3 ha (88.5% of the watershed) was classified as having low soil loss rates, likely due to high C and P factors and land cover types resulting from watershed management efforts ( and ). In the middle of the watershed, there were three classes of watersheds (SW1, SW2, and SW3), accounting for 6.4% of the research area and ranging from high soil erosion to extremely severe erosion classes. 3.9% moderate erosion, 0.4% highly severe erosion in Watershed (SW4).
Figure 18. Current priority class of the watershed for soil and water conservation.
5. Conclusions
The findings of this study highlight the escalating threat posed by soil erosion to the land and water resources in the highlands of Ethiopia, primarily attributed to changes in land use and land cover dynamics. To comprehensively assess the extent of soil erosion risk and estimate the rate of soil loss, advanced techniques such as Geographic Information Systems (GIS) and remote sensing, combined with the Revised Universal Soil Loss Equation (RUSLE) model, were employed. The study’s outcomes underscore the substantial impact of land use and land cover changes on soil erosion, with areas characterised by bare land, cultivated land, and grazing land experiencing the highest annual soil loss rates. In contrast, forests, shrubs, and water bodies exhibit the lowest rates.
Over the period from 2004 to 2020, the study reveals a notable decreasing trend in soil erosion rates, as evidenced by the decrease from 12.8 to 3.2 tha-1yr-1. This decline underscores the effectiveness of erosion control measures implemented during this timeframe. The study further identifies priority areas warranting immediate soil and water conservation interventions, with the SW1 watershed class being the most severely affected and requiring urgent conservation measures to mitigate the erosion threat.
In order to generate the RUSLE model, several critical datasets were utilized, including rainfall data, soil data, Digital Elevation Model (DEM) data, and satellite images. These datasets played a crucial role in estimating the essential RUSLE parameters, namely rainfall erosivity, soil erodibility, topographic factor, land use land cover factor, and supportive conservation practice factor. Through the combination of the RUSLE model’s five factors for three distinct study periods, a comprehensive soil erosion risk map expressed in tons per hectare per year was created.
It is worth noting that while all parameters required for the model remained constant between 2004, 2012, and 2020, with the exception of land cover distribution and rainfall erosivity, the observed decrease in erosion rates can be solely attributed to changes in these two factors. The annual soil loss within the watershed varied across the study periods, ranging from 0 to 879.44 tha-1 yr-1 in 2004, 0 to 169.02 tha-1 yr-1 in 2012, and 0 to 295.4 tha-1 yr-1 in 2020. This study not only quantifies the mean annual soil loss value under current conditions within the watershed but also employs the RUSLE model to map the spatial distribution of soil erosion risk, a methodology that aligns with the findings of various scholars.
Furthermore, the study indicates a significant reduction in the mean soil erosion rate within the study watershed, decreasing from 12.8 tha-1yr-1 in 2004 to 3.21 tha-1yr-1 in 2020. This decrease is particularly evident in areas with low erosion risk, predominantly located in the central region of the watershed. The overall changes in land use and land cover over the three study periods have positively impacted the watershed by mitigating soil erosion risks.
Disclosure statement
No potential conflict of interest was reported by the author(s).
References
- Addis, H. K., & Klik, A. (2015). Predicting the spatial distribution of soil erodibility factor using USLE nomograph in Ethiopia’s agricultural watershed. International Soil & Water Conservation Research, 3(4), 282–290. https://doi.org/10.1016/j.iswcr.2015.11.002
- Ajanaw, N. (2021). Impacts of land use and land cover change on soil erosion and hydrological responses in Ethiopia. Applied & Environmental Soil Science, 2021, 1–10. https://doi.org/10.1155/2021/6669438
- Alemayehu, A., Bekele, T., Gebremichael, Y., & Tadege, A. (2021a). Impacts of land use/land cover dynamics on soil erosion rate: A hare watershed, Ethiopia case study. Environmental Systems Research, 10(1), 1–19. https://doi.org/10.1186/s40068-021-00212-4
- Arekhi, S. (2008). Evaluating long-term annual sediment yield estimating potential of GIS interfaced MUSLE model on two micro-watersheds. Pakistan J. Biol. Sci, 11, 270–274.
- Arekhi, S. (2008). Evaluating long-term annual sediment yield estimating the potential of GIS interfaced MUSLE model on two micro-watersheds. Pakistan Journal of Biological Sciences, 11(2), 270–274. https://doi.org/10.3923/pjbs.2008.270.274
- Atoma, H., Suryabhagavan, K. V., & Balakrishnan, M. (2020). Soil erosion assessment using RUSLE model and GIS in Huluka watershed, Central Ethiopia. Sustainable Water Resources Management, 6, 1–17.
- Ayele, D., Abraham, T., & Fikrey, T. (2018). Developing GIS-Based soil erosion map using RUSLE of Andit Tid watershed, central highlands of Ethiopia. Journal of Scientific Research and Reports, 19(1), 1–13. https://doi.org/10.9734/JSRR/2018/40841
- Bathrellos, G. D., Gaki-Papanastassiou, K., Skilodimou, H. D., Skianis, G. A., & Chousianitis, K. G. (2013). Stoch. Environmental Research and Risk Assessment, 27, 273. https://doi.org/10.1007/s00477-012-0602-0
- Bosshart, U. P. (1997b). Measurement of river discharge for the SCRP research catchments: Gauging station profiles. University.
- Buraka, T., et al (2022). Assessment of soil erosion risks in response to land-use and land-cover changes in Coka watershed, Southern Ethiopia. Geology, Ecology & Landscapes, 1–14.
- Ebabu, K., Tsunekawa, A., Haregeweyn, N., Adgo, E., Meshesha, D. T., Aklog, D., Masunaga, T., Tsubo, M., Sultan, D., Fenta, A. A., & Yibeltal, M. (2019). Effects of land use and sustainable land management practices on runoff and soil loss in the upper Blue Nile basin, Ethiopia. Science of the Total Environment, 648, 1462–1475. https://doi.org/10.1016/j.scitotenv.2018.08.273
- Edwards, K. (1987b). Runoff and soil loss studies in New South Wales. Soil Conservation Service of New South Wales Tech. Handbook No.10.
- Ganasri, B. P., & Ramesh, H. (2016). Assessment of soil erosion by RUSLE model using remote sensing and GIS-A case study of Nethravathi basin. Geoscience Frontiers, 7(6), 953–961. https://doi.org/10.1016/j.gsf.2015.10.007
- Haregeweyn, N., Tsunekawa, A., Poesen, J., Tsubo, M., Meshesha, D. T., Fenta, A. A., & Adgo, E. (2017). Comprehensive assessment of soil erosion risk for better land use planning in river basins: Case study of the Upper Blue Nile River. Science of the Total Environment, 574, 95–108.
- Hellden. (1987a). An Assessment of Woody Biomass, community forests, land-use, and soil erosion in Ethiopia. LUND UNIVERSITY PRESS, 14.
- Hurni, H. (1985). Erosion-productivity-conservation systems in Ethiopia.
- Hurni, H., Berhe, W. A., Chadhokar, P., Daniel, D., Gete, Z., Grunder, M., & Kassaye, G. (2016). Soil and water conservation in Ethiopia: Guidelines for development agents.
- Hurni, H., & Hellden, U. (1998b). Watershed management, soil conservation and slope stability in high mountains: A case study from the Ethiopian highlands. Mountain Research and Development, 18(2), 135–148.
- Hurni, H., Solomon, A., Amare, B., Berhanu, D., Ludi, E., Brigitte, P. … & Gete, Z. (2010). Hurni, H., Wiesmann, U.Global Change and Sustainable Development : A Synthesis of Regional Experiences from Research Partnerships. Perspectives of the Swiss National Centre of Competence in Research (NCCR) North-South, University of Bern, 5, 187–207. Geographica Bernesia.
- Kaltenrieder, J. (2007a). Adaptation and Validation of the Universal Soil Loss Equation (USLE) for the Ethiopian-Eritrean Highlands. MSc Thesis, University of Berne, Centre for Development and Environment Geographies Institute
- Lal, R., & Stewart, B. A. (1990b). Soil degradation: A global threat. Advances in Soil Science, 11, 129–172. https://doi.org/10.1007/978-4612-3322-0
- Legesse, A., Atila, N., & Hailu, K. (2022b). Soil loss estimation and severity mapping using the RUSLE model and GIS in megech watershed, Ethiopia. Environmental Challenges, 8, 100560. https://doi.org/10.1016/j.envc.2022.100560
- Mariye, M., Maryo, M., Dinke, T., Changming, Y., & Weldegebrial, B. (2019). Land cover, land use changes and agroforestry practices at pawe resettlement district Ethiopia. International Journal of Scientific & Research Publications (IJSRP), 9(2), 369–385. https://doi.org/10.29322/IJSRP.9.02.2019.p8649
- Menale, K., Pender, J., Yesuf, M., Kohlin, G., Bluffstone, R., & Mulugeta, E.: (2007b). Impact of soil conservation on crop production in the Northern Ethiopian highlands. IFPRI Discussion Paper, (December), 44.
- Millward, A. A., & Mersey, J. E. (1999). Adapting the RUSLE to model soil erosion potential in a mountainous tropical watershed. Catena, 38(2), 109–129. https://doi.org/10.1016/S0341-8162(99)00067-3
- Ministry of Mines. (1973). Geological map of Ethiopia. Geological Survey of Ethiopia.
- Moges, M. A., Dagnew, D. C., & Tilahun, S. A. (2021c). Spatiotemporal dynamics of soil erosion response to land use and land cover change in Ethiopian highland: A review. Environmental Systems Research, 10(1), 1–17. https://doi.org/10.1186/s40068-021-00216-0
- Morgan, R. P. C. (2005a). Soil erosion and conservation (3rd ed.). Blackwell Publishing company.
- Myint, S. W., Gober, P., Brazel, A., Grossman-Clarke, S., & Weng, Q. (2011). Per-pixel vs. object-based classification of urban land cover extraction using high spatial resolution imagery. Remote Sensing of Environment, 115(5), 1145–1161. https://doi.org/10.1016/j.rse.2010.12.017
- Nigussie, Z., Tsunekawa, A., Haregeweyn, N., Adgo, E., Nohmi, M., Tsubo, M., Aklog, D., Meshesha, D. T., & Abele, S. (2017). Farmers’ perception about soil erosion in Ethiopia. Land Degradation & Development, 28(2), 401–411. https://doi.org/10.1002/ldr.2647
- Pimentel, D. (2006). Soil erosion: A food and environmental threat. Environment Development and Sustainability, 8(1), 119–137. https://doi.org/10.1007/s10668-005-1262-8
- Renard, K. G. (1997c). Predicting soil erosion by water: A guide to conservation planning with the Revised Universal soil loss equation (RUSLE). United States Government Printing.
- Rozos, D., et al (2013). Application of the revised universal soil loss equation model on landslide prevention. An example from N. Euboea (Evia) Island, Greece. Environmental Earth Sciences, 70, 3255–3266.
- SCRP. (2000). Area of Maybar, wello, Ethiopia: Long‐term monitoring of the agricultural environment.
- Shalaby, A. (2012). Assessment of urban sprawl impact on the agricultural land in the Nile Delta of Egypt using remote sensing and digital soil map. International Journal of Environment and Sciences, 1(4), 253–262.
- Tena, A., Berhanu, D., Hurni, H., & Zeleke, G. 2018. ‘Longterm agro-climatic and hydro-sediment observatory report: The case of Maybar micro-watershed, Awash river basin, Northeastern Ethiopia’. WLRC Research Report II., Addis Ababa University
- Tesfaye, G., Assefa, A., & Kidane, D. (2017). Runoff, sediment load and land use/cover change relationship: The case of Maybar sub-watershed, South Wollo, Ethiopia. International Journal of River Basin Management, 15(1), 89–101. https://doi.org/10.1080/15715124.2016.1239625
- Tilahun, T., Awedenegest, M., Alemayehu, M., Muluken, L., & Wudu, A. (2021). Implication of long-term terracing watershed Development on soil macronutrients and crop production in Maybar Subwatershed, South Wello zone, Ethiopia. Air, Soil and Water Research, 14, 11786221211004220. https://doi.org/10.1177/11786221211004220
- Tolessa, T., Kidane, M., Bezie, A., & Kesete, N. (2019). The impact of land use and land cover (LULC) dynamics on Ethiopia’s soil erosion and sediment yield. Heliyon, 5(12), e02981. https://doi.org/10.1016/j.heliyon.2019.e02981
- Tsegaye, D., Moe, S. R., Vedeld, P., & Aynekulu, E. (2010). Land-use/cover dynamics in northern afar rangelands, Ethiopia. Agriculture, Ecosystems & Environment, 139(1–2), 174. https://doi.org/10.1016/j.agee.2010.07.017
- Wagari, M., & Tamiru, H. (2021). RUSLE model based annual soil loss quantification for soil erosion protection: A case of fincha catchment, Ethiopia. Air, Soil and Water Research, 14, 11786221211046234.
- Waltner, I., Saeidi, S., Grósz, J., Centeri, C., Laborczi, A., & Pásztor, L. (2020b). Spatial assessment of the effects of land cover change on soil erosion in Hungary from 1990 to 2018. ISPRS International Journal of Geo-Information, 9(11), 667. https://doi.org/10.3390/ijgi9110667
- Weigel, G. (1986). The soils of the Maybar/Wello area and Their potential and constraints for agricultural development : a case study in the Ethiopian highlands. University of Berne, Institute of Geography: Geographica Bernensia. African studies series.
- Weldu Woldemariam, G., & Edo Harka, A. (2020a). Effect of land use and land cover change on soil erosion in erer sub-basin, Northeast Wabi Shebelle basin, Ethiopia. Land, 9(4), 111. https://doi.org/10.3390/land9040111
- Wischmeier, W., & Smith, D. (1978a). Predicting rainfall erosion losses: a guide to conservation planning Beltsville, Maryland. U.S. Department of Agriculture, Agriculture Handbook No. 537.
- Zerihun, M., Mohammedyasin, M., Sewnet, D., Adem, A., & Lakew, M. (2018). Assessment of soil erosion using RUSLE, GIS and remote sensing in North Wollo Ethiopia. Geoderma Regional, 12, 83–90. https://doi.org/10.1016/j.geodrs.2018.01.002