
 ?Mathematical formulae have been encoded as MathML and are displayed in this HTML version using MathJax in order to improve their display. Uncheck the box to turn MathJax off. This feature requires Javascript. Click on a formula to zoom.
ABSTRACT
The Zuru Schist Belt in Northwest Nigeria is one of the auriferous schist belts occurring in the western half of Nigeria. The gold mineralization largely hosted within Neoproterozoic metasedimentary rocks is considered orogenic. In an attempt to understand the pattern of occurrence of gold mineralization, their spatial distribution and association with regional structures, spatial analysis including point pattern, fractal, Fry, and distance distribution analyses were carried out to determine and quantify spatial pattern, spatial association, and regional structural control. Point pattern analysis reveals that the gold occurrences in the Zuru Schist Belt have a clustered pattern. Fractal analysis shows that the structures that controlled the distribution of gold occurrences can be divided into two categories: those that operated at a spatial scale of below 8 km, and those that operated at around 8 km and more. Fry analysis shows that the gold occurrences in the Zuru Schist Belt are aligned in a NNE-NE direction. This is parallel with the NNE-NE striking faults, establishing these faults as the main controlling structures. Fry plot of orientations of translated pairs within an 8 km distance shows that in addition to NNE-NE striking faults, folds with ESE trending axial trace and NW striking faults also exert some control on these known gold occurrences. The influence of these structures on the gold occurrences is further established by the result of distance distribution analysis. The results of spatial analysis using point pattern, fractal, Fry, and distance distribution analyses established the NNE-NE striking faults as the major structures that controlled the distribution of gold occurrences in the belt, and NW striking faults as important structures at a local scale. In addition to NW striking faults, this study further identified folds with axial trace oriented in ESE as additional secondary control structures for gold mineralization in the Zuru Schist Belt.
Graphical abstract

1. Introduction
Spatial analysis of mineralizations within a mineralized terrane provide important insights about the medium of transport and other geological mechanism involved during the ore forming process (Deng et al., Citation2024). Spatial analytical methods such as Fry analysis (Fry, Citation1979; J. Vearncombe & Vearncombe, Citation1999), point pattern analysis (Boots & Getis, Citation1988; Lisitsin, Citation2015), fractal/multi-fractal modelling (Blenkinsop, Citation1994, Citation1995; Blenkinsop & Sanderson, Citation1999; Carranza, Citation2009; Cheng et al., Citation1994; Gonçalves et al., Citation2001; Hobbs et al., Citation2022; Khalajmasoumi et al., Citation2017; Mandelbrot, Citation1983; Ord, Citation1994; Zuo, Cheng, et al., Citation2009), and distance distribution analysis (Bonham-Carter, Citation1985) have been employed in several studies for discerning the spatial distribution of mineral deposits. Although the recent study by Hobbs et al. (Citation2022) showed that spatial distribution of mineralizations are better explained by generalized extreme value (GEV) distributions as compared to fractal (power-law) distribution. Nevertheless, it was indicated that the implementation fractal analysis using the box counting technique in a two-dimensional domain is analogous to nearest neighbour analysis, which tend to exhibit a kind of GEV distribution known as Weibull distribution that can be interpreted as fractal or bifractal distribution (Hobbs et al., Citation2022 and other references therein). In addition to the methods listed above, the evaluation of spatial association of mineral deposits with specific geologic structures as a means of identifying relevant controlling features have also been implement in number of studies (e.g., Adib et al., Citation2017; Ahmadfaraj et al., Citation2019; Bierlein et al., Citation2006; Carranza, Citation2009; Carranza & Sadeghi, Citation2010; Carranza et al., Citation2008, Citation2009; Haddad Martim et al., Citation2016; Niiranen et al., Citation2019; Parsa et al., Citation2017; Sun et al., Citation2019; Yin et al., Citation2018).
Initially, spatial analysis for deduction of the geological processes and features associated with mineralization were largely implemented in the 2D Cartesian space. However, a lot of progress have been made with respect to numerical analysis of geoscience data, which has led to the extension of spatial analysis to the three dimensional (3D) space (Deng et al., Citation2024; Mao et al., Citation2019). Theoretically, spatial analysis in the 3D space has the potential to overcome most of the intrinsic limitations of spatial controls in the 2D space, the introduction of the third dimension also introduces other forms of complexity such as data acquisition (drill core/assay), software and modelling methods (Liu et al., Citation2016; Mao et al., Citation2019).
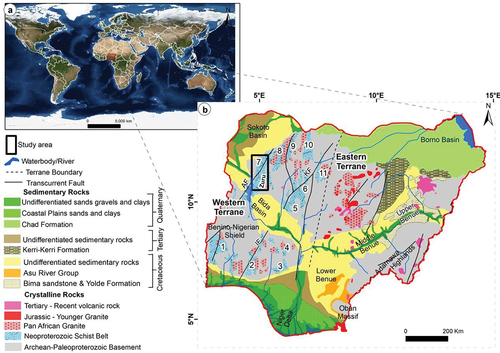
The Trans-Sahara Belt () extending from Algeria in North Africa through Chad, Niger, and Mali, down to the West African coast in western Cameroon, Nigeria, Benin, Togo and eastern Ghana (Castaing et al., Citation1993), host a number of gold occurrences (Aissa & Marignac, Citation2017; Fagbohun et al., Citation2020b; Garba, Citation2003). Although the Trans-Sahara Belt contains fewer gold deposits when compared to the neighbouring West African Craton, a number of gold occurrences are known to exist across the belt (Adjo et al., Citation2019; Aissa & Marignac, Citation2017; Fagbohun et al., Citation2020b; Garba, Citation2003). Notable gold occurrences in the Trans-Sahara belt are found in the northern Tuareg shield (Aissa & Marignac, Citation2017) and southern Benino-Nigerian shield (Adjo et al., Citation2019; Fagbohun et al., Citation2020b; Garba, Citation2003). These gold occurrences are considered orogenic in nature and structurally controlled (Aissa & Marignac, Citation2017; Garba, Citation1996; Goldfarb et al., Citation2001). The gold occurrences in the Benino-Nigerian Shield are hosted in metasedimentary rocks found in Paleo-Neoproterozoic schist belts restricted to the western part of Nigeria and eastern part of Benin republic. The schist belts in the Nigeria () are generally thought to be poorly mineralized. However, the recent discovery of an estimated 14 tons of gold hosted in north-trending quartzo-feldspathic veins within schistose and gneissic rock of the Ilesha schist belt () (Thor Explorations Ltd, Citation2018), suggest occurrence of larger resources than previously thought.
Figure 1. Cratons and Pan African mobile belts in Africa (Modified after Powell et al., Citation1990; Unrug, Citation1997). DM – Damara, GP – Gariep, LF – Lufillian Fold Belt, MA – Mauretanides, NS – Nubian Shield, MB – Mozambique Belt, RB – Rokelides Belt, SD – Saldania, WC – West Congo Belt, ZB – Zambezi Belt.
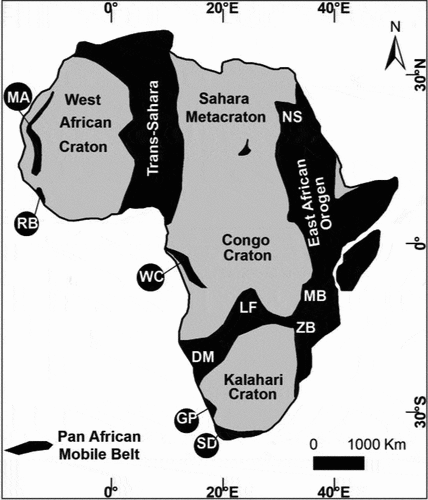
Figure 2. (a) Index map showing the location of Nigeria (bound by a red polygon) and neighbouring countries (b) Generalized geological map of Nigeria (modified after Adelana et al., Citation2008; Wright, Citation1985) showing the major lithostructural units including the Neoproterozoic Schist Belts. 1 – Iseyin-Oyan; 2 – Ilesha; 3 – Igarra; 4 – Egbe Isanlu; 5 – Zungeru - Birnin Gwari; 6 – Kushaka; 7 – Zuru; 8 – Anka; 9 –Maru; 10 – Wonaka; 11– Karaukarau. IF – Ifewara Fault, AF – Anka, Fault, KF – Kalangai Fault. The study is area bounded by a black rectangle.
The Zuru Schist Belt in northwestern Nigeria () is one of the mineralized schist belts where gold has been exploited since the 1920s (Adekoya et al., Citation2011; Fagbohun et al., Citation2020b; Turner, Citation1983; Woakes & Bafor, Citation1984; Woakes et al., Citation1987; Wright, Citation1985). Similar to most of the mineralized schist belts, gold in the Zuru Schist Belt is commonly hosted in veins of quartz, quartz-tourmaline or quartz-feldspar occurring within the metasedimentary and occasionally gneissic basement rocks. The veins exhibit a lenticular or boudinage structure and have thicknesses varying between few centimetres to about two meters (Garba, Citation2003; Wright, Citation1985). The gold occurrences are considered to be associated with the Anka-Yauri transcurrent fault. The gold occurrences in the Yauri area, which were extensively worked between 1920s and 1940s, are the most widely known within the belt (Garba, Citation2000). However, few occurrences such as the ones in around Mahuta, Kamtu and Angu villages have also been discovered within the schist belt by artisanal miners in recent times. Although mining activities has been on for decades, scarcity of data persist (Greentree et al., Citation2016).
Orogenic gold occurrences such as those present in the Zuru Schist Belt typically exhibit spatial relationship with geological structures such as faults, shears, and folds (Adib et al., Citation2017; Ahmadfaraj et al., Citation2019; Bierlein et al., Citation2006; Carranza & Hale, Citation2002; Goldfarb et al., Citation2001, Citation2005; Groves et al., Citation1998, Citation1998, Citation2000, Citation2018; Pirajno, Citation1992). Numerical quantification of spatial relationship amongst known gold occurrences, as well as spatial association between known occurrences and certain structural features through GIS-based spatial analysis, are useful in defining factors that influenced localization of gold occurrences. Additionally, it provides pertinent insights for aiming potential targets that are suitable for further exploration with the goal of identifying undiscovered occurrences (Agterberg et al., Citation1990; Bierlein et al., Citation2006; Bonham-Carter, Citation1985; Carranza & Hale, Citation2002; Groves et al., Citation2000).
Located in the northern part of Nigeria with a semi-arid climate, the Zuru Schist Belt () is an ideal terrain to evaluate the link between structures and gold mineralization as gold is mined primarily from quartz veins. Based on field studies of known gold occurrences in the Yauri gold field in the southern part of the Zuru schist, the formation of gold occurrences belt were interpreted to have been controlled by NE-SW faults and its NW-SE subsidiaries (Garba, Citation2000, Citation2003b). Quantitative evaluation of the relationship between gold occurrences and structural features in the Zuru Schist Belt using spatial analysis is however yet to be evaluated. This study is therefore focused on belt-wide assessment of the pattern of occurrence and spatial relationship between structural features and gold occurrences in the Zuru Schist Belt using geospatial methods such as point pattern, Fry, fractal, and distance distribution analyses. This study adopts spatial analysis to examine the structural control of gold occurrence in the whole belt, while also attempting to identify other possible controls on gold occurrences that are yet to be identified to enhance prioritization of areas for detailed exploration.
2. Regional geology and gold mineralization
The Nigerian terrane is part of the Trans-Sahara Belt (), a Pan-African mobile belt formed by collision between the converging West African Craton, Congo Craton, and Saharan metacraton between 750 and 550 Ma (Caby Citation1987; Cahen et al. Citation1984; Green Citation1993).
The Trans-Sahara Belt extends from Algeria in North Africa through Chad, Niger and Mali, down to the West African coast in western Cameroon, Nigeria, Benin, Togo and eastern Ghana (Castaing et al., Citation1993; Fagbohun et al., Citation2020b).
The Nigerian basement complex, which is a segment of the Benino-Nigerian shield is subdivided into western and eastern terranes () on the basis of lithological and structural differences (Ajibade & Wright, Citation1989; Ajibade et al., Citation1987; Dada, Citation1998; Ferré et al., Citation2002; Fitches et al., Citation1985). The western terrane in which the Zuru Schist Belt is located, consists of three categories of rocks ():
Archean-Paleoproterozoic polycyclic basement rocks of migmatite-gneiss with the grade of metamorphism varying from granulite to amphibolite facies (Odeyemi, Citation1981; Okonkwo & Valentin, Citation2015; Wright, Citation1985). While ages ranging from 3.5 to 0.6 Ga have been obtained from these basement rocks (Dada, Citation1998), they are largely considered to be Paleoproterozoic and/or Archean. The younger ages are thought to be an imprint of the Pan African orogeny (Affaton et al., Citation2000; Attoh et al., Citation1997; Bernard-Griffiths et al., Citation1991; Bruguier et al., Citation1992; Caby, Citation1989; Castaing et al., Citation1993; Fitches et al., Citation1985; Grant, Citation1969; Odeyemi, Citation1981; Onyeagocha & Ekwueme, Citation1990; Rahaman & Ocan, Citation1978; Rahaman et al., Citation1983; Rahaman, Citation1988; Turner, Citation1983).
The Paleo-Neoproterozoic schist belts consisting of metasedimentary rocks such as pelitic schist, semi-pelitic schist, quartzite, marble and stratified lenticular amphibolites that are the metamorphosed products of tholeiitic intrusives (Caby & Boesse, Citation2001; Elueze, Citation1992; Hubbard, Citation1975; Klemm et al., Citation1984; Olade & Elueze, Citation1979; Omitogun et al., Citation1990; Turner, Citation1983). The isotopic age of c. 1100 Ma obtained from rocks in Maru and Kushaka schist belts (Grant, Citation1969; Holt et al., Citation1978) suggest that some of the schist belts are Paleoproterozoic. Whereas, c. 700-600 Ma age obtained from other schist belts such as Birnin Gwari schist belt is indicative of evolution during the Neoproterozoic (Ferré et al., Citation1996; Grant, Citation1969). The schist belts are restricted to the western terrane of the Nigerian shield (), based on the division of the shield into western and eastern terranes (Ferré et al., Citation1996; Ferré et al., Citation2002).
Syntectonic to late-tectonic Pan-African granite suites, which are largely granitic with local occurrences of dioritic, syenitic and charnockitic units (Dada et al., Citation1989; Elueze, Citation1992; Fitches et al., Citation1985; Holt et al., Citation1978; Klemm et al., Citation1984; Odeyemi, Citation1981; Rahaman et al., Citation1991; Rahaman, Citation1988; Tubosun et al., Citation1984).
The gold occurrences in the Nigerian schist belts are considered to have been formed during the late stages of the Pan African orogeny (Garba, Citation1996; Goldfarb et al., Citation2001; Woakes & Bafor, Citation1984). The occurrence of mineralization in metasedimentary rock of greenschist facies, their association with crustal scale fault and proximity to granitic intrusions support their classification as orogenic (Robert et al., Citation2007). Additionally, studies of large ion lithophile elements, stable isotopes and fluid inclusions associated with some of the mineralization suggest precipitation of gold bearing veins from metamorphically derived hydrothermal fluids (Garba, Citation2000, Citation2002, Garba, Citation2003; Garba & Akande, Citation1992).
2.1. Zuru Schist Belt
The Zuru Schist Belt is the biggest of the schist belts located in the northwestern part of Nigeria with the length of 280 km and width extending up to 40 km in some places (Turner, Citation1983). The Zuru Schist Belt is underlain by Archean-Paleoproterozoic basement consisting of migmatite-gneisses, biotite gneiss and granite gneiss (), on which sedimentary cover was deposited during the Proterozoic Eon. The Pan African orogeny led to the reworking of the basement and metamorphism of the sedimentary cover to green-schist and amphibolite facies (Danbatta, Citation2008; Turner, Citation1983). The metasedimentary rocks consist of quartzites, phyllite, quartz-mica schist and amphibolite schist. The late stages of the Pan African orogeny were characterized by the intrusion of the basement and metasedimentary cover by syn-tectonic biotite or biotite-hornblende granites (Fitches et al., Citation1985; Goodenough et al., Citation2014; Holt et al., Citation1978). The texture of the granites range from medium, to coarse and porphyritic in nature.
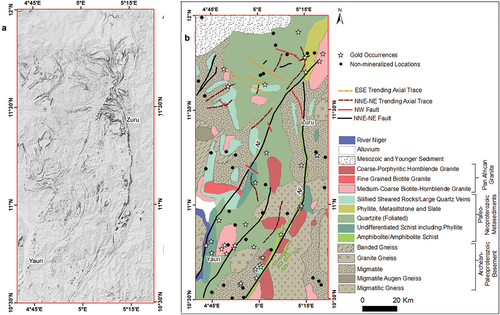
Figure 3. (a) Shaded relief model of the Zuru Schist Belt (b) Geological map of the study area modified after Nigerian Geological Survey Agency (NGSA) (2006). AF – Anka Fault. Non-mineralized locations are randomly generated points used for comparative analysis with known gold occurrences in point pattern and distance distribution analysis. Major structures are derived from interpretation of a shaded relief model generated from SRTM data (Fagbohun et al., Citation2020b).
2.1.1. Deformation history
Situated in a high strain zone, the rocks of the Zuru Schist Belt have been affected by intense deformation. Previous studies indicated that the evidence of four deformational events are noticeable in the Zuru Schist Belt (Fagbohun et al., Citation2020a; Wright, Citation1985). The first deformation episode is a ductile deformation that produced folds with EW-ESE trending axial trace (Fagbohun et al., Citation2020a). These folds are restricted to the northern part of the belt close the boundary of Sokoto Basin (). The second deformation event resulted in the development of open to tight and tight to isoclinal folds with N-S to NE-SW trending axial traces. Some of the earlier formed folds with EW-ESE trending axial traces were refolded during the second deformation event, resulting in the superposition of N-S to NE-SW trending axial trace folds on these earlier structures. The two folding events are succeeded by two brittle deformation events that resulted in the formation of strike-slip NE-SW striking faults and dip-slip NW striking faults, which are conjugate pair developed during the Pan African orogeny (Garba, Citation2000; Wright, Citation1985). The NE-SW striking faults are evident as a transcurrent fault, notably the Anka-Yauri transcurrent fault and its subsidiaries (Ajibade & Wright, Citation1989; Fagbohun et al., Citation2020a; Ramadan & Fattah, Citation2011). The Anka-Yauri transcurrent fault zone, which cut across the belt creates a fault contact between the schist and amphibolites (Wright, Citation1985) (). Considering that the rocks in the Zuru Schist Belt were extensively affected by the Pan African orogeny, the structural trend of the belt is N-S to NNE-SSW, which is the imprint of the Pan African event (Turner, Citation1983). Apart from the folds with E-W trending axial traces found in the northwestern part of the belt, which are interpreted as structures predating the Pan African event (Fagbohun et al., Citation2020a; Wright, Citation1985), the other three structures (i.e., NNE-NE strike-slip faults, NW dip-slip striking faults and folds with NNE-NE trending axial trace) are all considered as structures formed during the Pan-African event.
2.1.2. Gold occurrences
The gold occurrences in the Yauri area, with more than 12 major sites of vein-gold mineralization (Woakes & Bafor, Citation1984) localized within a brittle fault zone cutting across hornfelsic rocks (Garba & Akande, Citation1992), are the most widely known within the Zuru Schist Belt. The hornfels hosting some of the auriferous veins resulted from contact metamorphism developed by granodiorite intruding the metasediments (phyllite and schist). Although some of the gold occurrences at Yauri occur close to granitoid intrusions, studies of fluid inclusions, rare earth elements, tourmaline chemistry, large ion lithophile and stables isotopes from these gold mineralization (Garba, Citation1996, Citation2000; Garba & Akande, Citation1992) ruled out possible contribution of magmatic hydrothermal fluid in the formation of these gold mineralization. The precipitation of gold mineralization from CO2-rich mineralizing fluid is considered to have been induced by phase separation of H2O and CO2 fluids (Garba, Citation1996, Citation2000; Garba & Akande, Citation1992). The presence of CO2 and oxidation observed in the auriferous veins and wallrocks in Yauri suggest that the fluid source was most likely in equilibrium with oxidizing conditions or intrinsically oxidized within the metasedimentary host rocks (Garba & Akande, Citation1992).
3. Data and methods
3.1. Data
The data used in this study include 34 known locations of gold occurrences ( in Appendix). These known gold occurrences include locations presented in mineral resources map produced by Nigerian Geological Survey Agency (NGSA, Citation2005), locations presented in the works of Greentree et al. (Citation2016) and Ramadan and Fattah (Citation2011), and three locations not previously reported near Mahuta, Kamtu and Angu villages, where artisanal miners were found to be actively working auriferous quartz veins during field visitation (). Prior to field visit, a map of known occurrences was generated, this serves as a guide to locations to be visited. However, only 19 out of the 34 known gold occurrence were accessible. In sites where mining is active, artisanal miners were found working in several pits and trenches, while shallow pits and trenches, and piles of waste rock, which are evidence of past mining activities, characterize few abandoned mines. These known gold occurrences data therefore include locations where artisanal mining is either currently active or has been carried out in the past. Point pattern and distance distribution analyses are spatial analysis methods that require the same number of randomly distributed points and known gold occurrences within a study space for comparison and confirmation of non-random nature of gold occurrences. Therefore, 34 randomly distributed were generated within the study area using Poisson process (Diggle, Citation2003; Parsa et al., Citation2017). This was implemented using the Create Random Points tool in ArcGIS 10.5. These randomly distributed points are considered as non-mineralized points suitable for comparative analysis with known gold occurrences ().
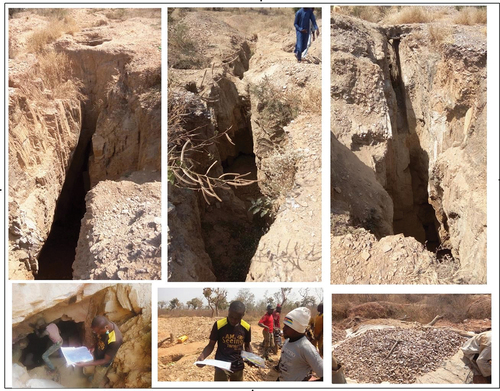
Figure 4. Pictures showing trenches and pits within foliated hosted rock and pile of fragments of mineralized quartz veins extracted from these trenches and pits at a location where mining is active.
3.2. Methods
Spatial analysis involves evaluation of the spatial pattern of mineralized zones, and the spatial relationship between mineralized zones and structural features. To establish the nature of structural control on gold occurrences in the Zuru Schist Belt, spatial analysis of the distribution of known gold occurrences and quantitative estimation of spatial associations between known gold occurrences and possible controlling features is required. This was achieved through point pattern, Fry, fractal and distance distribution analyses. These are spatial analysis methods useful in the development of a conceptual model aimed at recognizing controls on the gold occurrences.
3.3. Point pattern analysis
Points in two-dimensional space display some form of spatial association, which can either be clustered, random or regular (Boots & Getis, Citation1988; Diggle, Citation1983). In a situation where the association can be described as random, points are haphazardly distributed in space and there is a lack of interaction between points. Thus, such points can be considered to have resulted from independent processes. In a clustered pattern, points are closer to each other compared to random patterns. Such points are considered to have resulted from related processes, which resulted in the localization of groups of objects in specific locations. For regular patterns, the points are more distant than they are in random patterns. This is indicative of an interplay of processes resulting in the dispersion of objects towards certain localities.
Mineral deposits are generally characterized by non-randomness as they are usually a product of inherent geological processes (Carranza, Citation2009). Thus, they are generally considered to be localized by mineralization-related geological events, which can either be centralising or dispersing (Carranza et al., Citation2008). Point pattern analysis involves comparison of the spatial distribution of known mineral occurrences in the area under investigation to the same number of randomly distributed points within the same area (Lisitsin, Citation2015). Comparison of the distance between the known mineral occurrences and the distance between randomly distributed non-mineralized points enable determination of the pattern of occurrence of known mineral occurrences. In this study, point pattern analysis was carried out using 34 known gold occurrences and 34 randomly distributed non-mineralized points as input (). For n points, the distance from each of the points to other points is measured. These distances are denoted as 1st-order, 2nd-order, 3rd-order or (n-1)th-order neighbour distances. The 1st-order is the distance between each point and its nearest neighbour point. Thus, n points will have n-1 means of ordered neighbour distances, with the 1st-order mean being the mean of nearest neighbour distances among points (Carranza, Citation2009; Parsa et al., Citation2017). Known mineral occurrences are interpreted as having a clustered pattern when the means of ordered neighbour distances of the known mineral occurrences are consistently lower than those of the randomly distributed points. By contrast, the known mineral occurrences are interpreted as having a regular pattern of distribution when the means of ordered neighbor distances of the known mineral occurrences are higher than those of the randomly distributed points. Similarity in the means of ordered neighbour distances of known mineral occurrences and those of randomly distributed points results in the spatial distribution of known mineral occurrences to be considered as a random distribution, eliminating influences by any geological control (Carranza, Citation2009).
3.4. Fractal analysis
Fractal analysis of the spatial distribution of a cloud of point objects can be determined using the box-counting method (Mandelbrot, Citation1983). This enables identification of the number of fractal dimensions associated with point objects. The use of box-counting analysis for determining the fractal dimension of mineral deposits has been adopted by several researchers (Blenkinsop, Citation1994, Citation1995; Blenkinsop & Sanderson, Citation1999; Carranza, Citation2009; Carranza et al., Citation2008; Kreuzer et al., Citation2007; Parsa et al., Citation2017). Implementation of this analytical method enables determination of the number of fractal dimensions, which are indications of different scales at which controlling factors operated during the mineralization process. In this study, the 34 known gold occurrences serves as input data for fractal analysis (). The implementation of box counting entails superimposing a square shaped raster or grid of a particular cell size (δ) on the map of the known mineral occurrences, followed by determination of the number of pixels n(δ) where there are one or more known mineral occurrences. Repeating the procedure using varying cell sizes (δ) will result in changes in the number of pixels n(δ) containing one or more known mineral occurrences. The pixel size (δ) and number of pixels n(δ), where there are one or more known mineral occurrences, exhibit a power-law relationship, which is given by the equation 1 (Carranza, Citation2009; Mandelbrot, Citation1983):
where the represent the box-counting fractal dimension and C is a constant.
The relationship in the above equation is represented as linear equation 2 on a log-log plot:
Thus, is the slope of the straight lines fitted to the plot of (δ) against n (δ) on a log-log graph. For a set of non-random points, the fractal dimension varies between [−2, 0], while it is equal to −2 for a set of random points. The spatial trend and probable control on the pattern of occurrence of the known mineral occurrences is determined from the number of straight lines fitted to the plot of (δ) against n(δ) on a log-log graph.
The radial-density fractal dimension can likewise be examined. In order to achieve this, the density (d), which is the ratio of the number of pixels containing known mineral occurrences to the total number pixels within a circle of radius r from known mineral occurrences must be calculated. Repeating the procedure for circles of different radii (r), will result in varying density (d) values. The relationship between d and r is a radial – density power-law relation, which is expressed in equation 3 (Mandelbrot, Citation1983):
where Dr is the radial-density fractal dimension and C is a constant. Therefore, Dr can be estimated from the slope of straight lines fitted to the plot of d versus r on a log-log graph, and is expressed as:
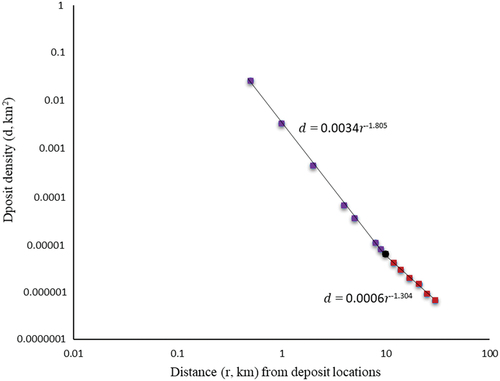
The radial-density fractal dimension of the 34 gold occurrences in the Zuru Schist Belt was estimated by converting the known gold occurrences into raster with 100 × 100 m cell size. This raster resolution was selected to ensure that each known mineral occurrence occupies a single cell. Different radial-densities (d) were computed using circles of different radii (r) centred around known gold occurrences. The log-log plot of (d) versus (r), reveal the radial-density fractal dimensions.
3.5. Fry analysis
Fry analysis (Fry, Citation1979) is a geometrical technique used to analyse spatial autocorrelation of point objects of a kind. Fry analysis was originally developed for evaluation of strain in rocks expressed as patterns of objects that appear to be randomly distributed (Fry, Citation1979; Hanna and Fry, Citation1979). Over time, it has been extended to evaluation of the spatial distribution of mineral deposits to determine structural control (Carranza, Citation2009; Haddad Martim et al., Citation2016; Parsa et al., Citation2017; Vearncombe & Vearncombe, Citation1999; Vearncombe & Vearncombe, Citation2002). Based on this method, where there are n known mineral occurrences represented as points, implementation will result in the generation of n2-n translated points called “Fry plots” (Vearncombe & Vearncombe, Citation1999). The orientation and distances between the resulting pairs of translated points can be measured. Insight about the trends of geological features at a regional scale can be deduced by plotting orientations and frequency of orientations on a rose diagram for all pairs of translated points. Further insight about trends of geological features that operated at a local scale can be obtained by plotting a rose diagram for orientations and frequency of translated pairs whose distance apart is within a specific range (Carranza, Citation2009; Haddad Martim et al., Citation2016). Consequently, subtle pattern in the spatial distribution of known mineral occurrences and structural control can be evaluated by comparing the directions and alignments derived from a Fry plot to structures with similar orientations (Kreuzer et al., Citation2007). Fry analysis was implemented using the locations of the 34 known of gold occurrences in as input data.
3.6. Distance distribution analysis
The distance distribution analysis developed by Berman (Citation1977) involves numerical evaluation of spatial relationships between a particular collection of point features and another set of spatial features of known geometry (Bonham-Carter, Citation1985; Carranza, Citation2009). The analysis entails computation of distances from mineralized locations and non-mineralized locations represented as points, to a collection of specific geologic features. The computed distances are then used to derive cumulative relative frequency curve, for both mineralized locations {represented as D(M)} and non-mineralized locations {represented as D(N)}, to the same set of geologic features. The D(M) signifies a non-random probability density distribution of mineral occurrences, whereas D(N) signifies a random probability density distribution of non-mineralized locations (Carranza, Citation2009). Comparison of the cumulative relative frequency distribution of distances from location of mineral occurrences to specific geologic features {D(M)} and the cumulative relative frequency distribution of distances from non-mineralized locations to the same set of geologic features {D(N)}, provides a means to ascertain non-randomness of mineral occurrences and establish spatial association between mineral occurrences and specific geologic features under consideration. Comparison of the plots for D(M) and D(N) enable determination of spatial association or independence of known occurrences and geologic feature type under consideration. This is given as:
where D≅0 is indicative of no spatial association. If the plot of D(M) lies above D(N) representing positive D, it is indicative of positive spatial association, whereas negative D where the plot of D(M) lies beneath D(N) is indicative of negative spatial relationship between the mineral occurrences and a particular set of geologic feature. The distance at which positive D is maximum is indicative of the distance that signifies the most reliable spatial relationship between a particular geologic feature type and the mineral occurrences (Carranza, Citation2009). The distance distribution analysis was computed for the 34 known gold occurrences and the 34 randomly distributed non-mineralized points in relation to the four major structural trends in study area ().
4. Results
4.1. Point pattern analysis
In this study, 34 locations of known gold occurrences were considered, thus 33 means of ordered neighbour distances were derived from the computation of distances between the 34 known occurrences. Similarly, the distances between the 34 random (non-mineralized) points within the study area was also computed. The mean of the 1st-order neighbour distances up to the 7th-order mean of neighbour distances for known gold occurrences, and randomly distributed points are presented in . From , it can be observed that for known gold occurrences, the mean of the 1st-order neighbour distances is 7 km while the mean of the 7th-order neighbour distances is 29 km. Although there is no pre-determined hard and fast rule on the number of means of ordered neighbour distances that must be examined, the number chosen should be sufficient to determine consistency (Boots & Getis, Citation1988; Carranza, Citation2009). Evaluation of the result of the analysis up to the 7th-order mean of neighbour distances show that the means of ordered neighbour distances of the known gold occurrences is consistently lower than the means of ordered neighbour distances of the randomly distributed points ().
Table 1. Table showing the means of 1st to 7th order neighbour distances of known gold occurrences and random non-mineralized locations in Zuru Schist Belt.
4.2. Fractal analysis
The results obtained by applying box-counting and radial density fractal analyses on known gold occurrences are fitted with two straight lines, which reveal the bifractal nature of the gold occurrences. For box-counting fractal analysis, the plot of n(δ) against δ is fitted with two straight lines (). The first line on the left is fitted through the plot when δ values are <8 km with a Db value of − 0.089. The second line is shown on the right fitted across the plots where δ values are >8 km with the Db value of − 0.726. Likewise, the result of the radial-density fractal analysis () displays two radial-density fractal dimensions that are defined along two straight lines. The separation of the two fitted lines at ~8 km is consistent in both box-counting and radial-density fractal dimension plots.
Figure 5. Log-log plot of n(δ) versus δ, the two fitted lines indicates two distinct spatial patterns.
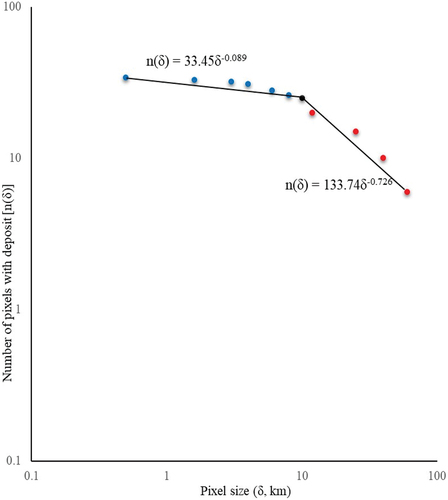
Figure 6. Log-log plots of distances from location known gold occurrence against the densities of known occurrences.
4.3. Fry analysis
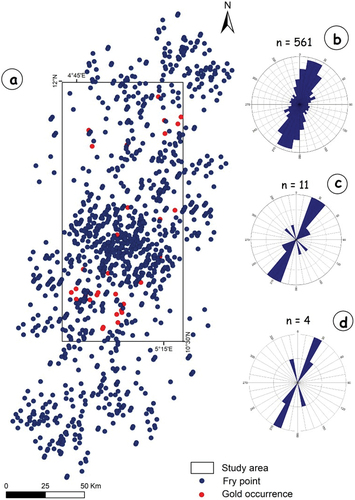
Application of Fry analysis using the 34 known gold occurrences within the Zuru Schist Belt resulted in 1122 translated fry points. The resulting translated pairs were centred on the known occurrences (). By plotting a rose diagram for the orientations of all paired translated points, the dominant trend is 0−40º (NNE-NE) (). In addition to this dominant trend, two secondary trends 60−90º and 120−150º can also be observed in the rose diagram. For the rose diagram of translated pairs that are less than 8 km apart (), two secondary orientations 130−140º and 160−170º can be observed along with the dominant NNE-NE trend (20−50º). Additionally, NNE-NE (20−40º) and NW (160−700º) trends are persistent in the orientations of translated pairs within 3 km distance.
Figure 7. (a) Fry plot of gold occurrences in the study area. (b) Rose diagram of orientations of all pairs of translated points (c) Rose diagram of orientations of pairs of translated points within 8 km distance to each other (d) Rose diagram of orientations of pairs of translated points within 3 km distance to each other.
4.4. Distance distribution analysis
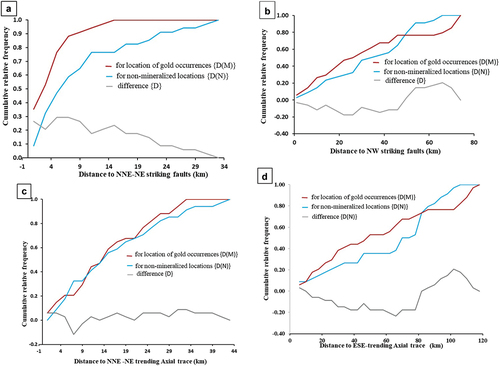
The distance distribution analysis was computed in relation to different orientations of structural features namely NNE-NE striking faults, NW striking faults, ESE trending axial trace and NNE-NE trending axial trace of folds (). For NNE-NE faults, the difference between D(M) and D(N) is significant across the entire plot above (). This is indicative of a strong positive spatial association between NNE-NE striking faults and known gold occurrences up to 30 km apart. Likewise, for NW striking faults, D(M) lies above D(N) in most parts of the plot (). While the difference between D(M) and D(N) for NW striking faults is less significant when compared with NNE-NE striking fault, nonetheless, the difference between D(M) and D(N) is indicative of an association between gold occurrences and NW striking faults. With respect to folds with NNE-NE trending axial trace, D(M) and D(N) curves overlap and follow similar patterns in the entire plot, which implies poor or no spatial association between gold occurrences and these particular fold sets (). By contrast, for folds with ESE trending axial traces, D(M) increasingly plots above D(N) from around 8 km to about 55 km (), indicative of moderate spatial association between known gold occurrences and these fold sets.
Figure 8. Plots showing cumulative distances from known gold occurrences, as well as from non-mineralized locations to: (a) NE-striking faults (b) NW-striking fault, (c) N-S trending axial trace and (d) ESE trending axial trace.
5. Discussion
Identification of the patterns of spatial distribution of gold occurrences in the Zuru Schist Belt, northwest Nigeria, was achieved through systematic spatial analysis of known gold occurrences. Various spatial analysis were used to characterize aspects of the spatial distributions of known gold occurrences. Point pattern analysis establishes the non-random nature of known gold occurrences with the average means of ordered distances between known gold occurrences consistently lower than that of the randomly distributed points. On this basis, the gold occurrences in the Zuru Schist Belt can be considered to have a clustered pattern. The mineralization process can thus be linked to an interplay of geological processes that controlled the flow of hydrothermal fluids resulting in the clustering of gold bearing veins within the Zuru Schist Belt. The bifractal dimension exhibited by gold occurrences in the Zuru Schist Belt is similar in nature to the fractal dimensions observed in orogenic gold mineralization in several places (Carranza, Citation2009; Cheng & Agterberg, Citation1995; Cheng et al., Citation1996; Parsa & Maghsoudi, Citation2018; Parsa et al., Citation2017; Raines, Citation2008; Zhao et al., Citation2019; Zuo, Agterberg, et al., Citation2009). The separation of the two fractals at ~8 km in the results of both box-counting and radial density fractal analyses implies that the processes that controlled the distribution of gold bearing veins in the Zuru Schist Belt can be divided into local and regional processes (Zhao et al., Citation2019). The local processes operated at a scale below 8 km, while regional processes operated at a scale of 8 km and more.
The trends observed in the rose diagrams resulting from Fry analysis represent orientations of important structures that exert controls on the distribution of gold occurrences in the area. The dominant NNE-NE trend evident in all the rose diagrams represent the control exerted by a NNE-NE strike slip faults (Garba, Citation2000, Citation2003; Wright, Citation1985). The NNE-NE trend observed in the gold occurrences of the Zuru Schist Belt is also similar to the orientation of veins found in the Amesmessa, and Tirek in the Tuareg shield (Aissa & Marignac, Citation2017; Marignac et al., Citation1996; Saad et al., Citation2018), as well as in the Seridó Belt of northeastern Brazil, which is considered as extension of Trans-Sahara belt (Araújo et al., Citation2002). The NW trend is noticeable in the rose diagrams constructed for orientations of translated pairs within 8 km and 3 km of each other (), whereas the ESE trend is evident in the rose diagram constructed for orientations of translated pairs within 8 km distance apart. The secondary trend of 160−170º (NW-SE) probably indicates the influence of NW striking faults, while the 130−140º (ESE) trend is probably related to folds with axial trace trending in this direction.
Figure 9. Graphical representation of the relationship between structures of different orientations and known gold occurrences based on distance distribution analysis in .
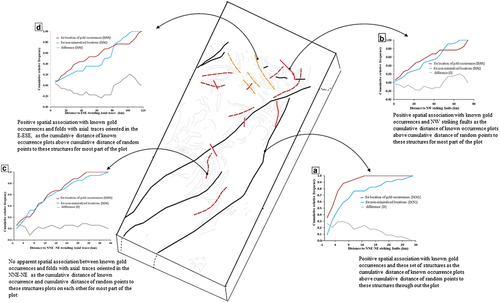
The evaluation of the relationships between gold occurrences and these structures through distance distribution analysis reveals that gold occurrences in the Zuru Schist Belt have a strong spatial association with the NNE-NE striking faults, while NW striking faults, and folds with ESE trending axial trace have a moderate spatial association with the known gold occurrences. NW striking faults, and folds with ESE trending axial trace can therefore be consider as secondary controlling structures. Although the ESE trend can be observed in the rose diagram of orientations of translated pairs within 8 km of one another, positive spatial association between gold occurrences and these axial trace is found at around 8 km and above in the result of distance distribution analysis. Nonetheless, it is apparent from both Fry and distance distribution analyses that spatial association exist between ESE structures and known gold occurrences.
Based on an integrated interpretation of the results of fractal analysis, Fry analysis and distance distribution analysis, the NNE-NE striking faults are identified as the principal control structures in the formation of gold occurrences at a regional (≥8 km) scale. The NNE-NE striking strike-slip faults operational at regional scale is most likely the major pathway through which ore bearing fluids were channelled into the belt, while the lower order structures acted as favourable sites actual for precipitation of gold ore (Garba, Citation2000, Citation2002; Garba & Akande, Citation1992). At a local (<8 km) scale, NNE-NE striking faults likely acted in along with NW striking faults and folds with ESE trending axial trace to facilitate the localization of gold bearing veins in favourable locations.
The relationship established between gold occurrences and NNE-NE and NW striking faults give credence to previous models by Garba (Citation2000, Citation2003), who interpreted the NE striking faults as the principal controlling structures, and subsidiary NW striking faults as secondary control structures. Although, folds with axial trace trending ESE are interpreted as structures that predate the NNE-NE striking faults (Fagbohun et al., Citation2020b; Wright, Citation1985), the likely influence of these structures on gold formation is not particularly unexpected. The association of orogenic gold with structures that predate the main mineralization event is common in many orogenic terranes (Groves et al., Citation2018) and the hinges of folds, for example are favourable sites for ore deposition (Groves et al., Citation2018; Price & Cosgrove, Citation1990; Ramsay, Citation1967; Ramsay & Huber, Citation1987; Robertson & Peters, Citation2016). The formation and flow of ore bearing fluid through regional control structures during transpressional or compressional deformation regimes (Garba, Citation2000), most likely coincides with the reactivation of older structures (i.e., folds with ESE trending axial trace) as well as formation of new ones such as NW striking faults, all of which represent suitable sites for ore deposition. This may explain the reasonable spatial relationship between gold occurrences NW striking faults and folds with ESE trending axial trace.
Aside the NNE-NE striking faults with spatial association with gold occurrences across the entire belt, the spatial association of gold occurrences with secondary structures appear to be localized. The association between folds with EW-ESE trending axial trace and gold occurrences is noticeable in the northwestern part of the Zuru Schist Belt in this study, even though similar observation between gold occurrences, and E-W structures identified using aeromagnetic data was recently reported in the southern part of the belt by Salawu et al. (Citation2023). Likewise, the association between gold occurrences and NW striking faults also appear to be dominant to the northern part of the belt. While previous studies based on conventional geological and structural mapping identified NNE-NE and NW striking faults as the control structures in the Zuru Schist Belt (Garba, Citation2000, Citation2003b), spatial analysis adopted in this study further identify folds with ESE trending axial trace as additional control structures. This finding is also supported by recent by observation by Salawu et al. (Citation2023) who reported the spatial association between these ESE structures and gold occurrences based on similarity in the orientations of gold occurrences and structures derived from aeromagnetic data in the southern part of the belt. This indicates the advantage of spatial analysis over conventional geological and structural mapping in the determination of structural control particularly at regional and district scale.
Considering that this study successfully establish spatial relationship between known gold occurrences and structural features in the Zuru Schist Belt, it is important to highlight the likely uncertainties associated with this study as a consequence of data used. The gold occurrences used in this study are unevenly distributed and do not represent the total number of occurrences in the area. Some undiscovered or unreported gold occurrences might exist within the area that may improve insights on structural control if included in spatial analysis. Furthermore, there is no information about the reserve of these gold occurrences. Nonetheless, since the primary aim of this study is to evaluate the spatial distribution and structural control on known gold occurrences, size and grade are not considered crucial to this study. The inclusion of three gold occurrences identified through field visit in the data used for spatial analysis does not introduce bias, rather it further enrich the data and improves the spatial analysis since the form of occurrence of these identified gold occurrences is consistent with the previously known occurrences. Finally, the major structures considered in this study were extracted from remotely sensed data. Structures interpreted from remotely sensed data are subject to uncertainty in terms of accuracy of location due to minor geometric errors inherent in remotely sensed data. Nonetheless, these errors are likely to be insignificant for large-scale structures that are few kilometres in length. Additionally, future studies involving spatial analysis will benefit from the introduction of structures mapped through geophysical methods, which are undetectable through remote sensing.
6. Conclusion
A number of gold occurrences are present in the Zuru schist belt. The mineralization, which is orogenic in nature, is believed to have been formed during the Pan African Orogeny. Orogenic gold occurrences are generally structural controlled, and understanding the geologic controls can guide exploration for new deposits/occurrences. In this study, regional scale spatial analysis of gold occurrences in the Zuru Schist Belt were evaluated to discern structural controls. The implementation of spatial analysis enabled identification of the spatial association and structural control of gold mineralization at a regional scale. Fractal analysis enabled categorization of structures that controlled mineralization into regional and local scale structures. Fry analysis revealed that the major trend of the gold occurrences is NNE-NE. This corresponds to the orientation of a NNE-NE strike-slip transcurrent fault traversing the belt. Secondary orientations of NW and ESE were also be observed in the spatial orientation of the gold occurrences. Distance distribution analysis substantiates strong spatial associations between the gold occurrences and NNE-NE striking faults. Moderate spatial association was also identified between gold occurrences and NW striking faults, and folds with an ESE trending axial trace. The areas proximal to these structures represent the area that is likely to be most prospective, and the established structural control can be further translated into mappable spatial proxies and integrated with other geoscience data for the development predictive mineral prospectivity map for the belt. Finally, while this study studies establishes the role of folds with axial trace oriented in ESE as supplementary control structure to be considered in exploration for gold in the study area, the role of structures oriented in this direction need to be evaluated in other neighbouring schist belts such as Anka, Maru, Wonaka.
Author contributions
Conceptualization: Babatunde Joseph Fagbohun, Ayotunde Allen Omitogun, Femi Joshua Ayoola, Oluseyi Adunola Bamisaiye.
Data curation: Babatunde Joseph Fagbohun.
Formal analysis: Babatunde Joseph Fagbohun;
Writing – review and editing: Babatunde Joseph Fagbohun, Ayotunde Allen Omitogun, Femi Joshua Ayoola, Oluseyi Adunola Bamisaiye.
Visualization: Babatunde Joseph Fagbohun.
Acknowledgements
This research is funded by the African Union under the Pan African University Scholarship, which the first author is a beneficiary. We sincerely thank Dr. Mohammad Parsa of Faculty of Mining and Metallurgical Engineering, Amirkabir University of Technology, Tehran, Iran for providing the template used for implementation of Fry analysis. The authors would also like to thank Mr. Lawali Abubakar (Federal University of Technology Birnin Kebbi), Mr. Sa’adu Salisu and Mr. Lukuman Abubakar for providing support during fieldwork.
Disclosure statement
No potential conflict of interest was reported by the author(s).
Additional information
Funding
References
- Adekoya, J. A., Kehinde Phillips, O. O., & Odukoya, A. M. (2011). Geological distribution of mineral resources in southwestern Nigeria.
- Adelana, S. M. A., Olasehinde, P. I., Bale, R. B., Vrbka, P., Goni, I. B., & Edet, A. E. (2008). 628 an overview of the geology and hydrogeology of Nigeria. In S. M. A. Adelana & A. M. MacDonald (Eds.), Applied groundwater studies in Africa. IAH selected papers on hydrogeology (Vol. 13, pp. 171–197). CRC Press Balkema.
- Adib, A., Afzal, P., Mirzaei, S., & Aliyari, F. (2017). Determination of the relationship between major fault and zinc mineralization using fractal modeling in the Behabad fault zone, central Iran. Journal of African Earth Sciences, 134, 308–319. https://doi.org/10.1016/j.jafrearsci.2017.06.025
- Adjo, F. B., Bolarinwa, A. T., Adissin Glodji, L., Dongmo, F. W. N., & Olajide Kayode, J. O. (2019). A review of the current state of knowledge on gold mineralisation in Benin Republic, West Africa. Applied Earth Science: Transactions of the Institute of Mining and Metallurgy, 128(1), 2–14). Taylor and Francis Ltd. https://doi.org/10.1080/25726838.2018.1556503
- Affaton, P., Kröner, A., & Seddoh, K. F. (2000). Pan-African granulite formation in the Kabye Massif of northern Togo (West Africa): Pb−Pb zircon ages. International Journal of Earth Sciences, 88(4), 778–790. https://doi.org/10.1007/s005310050305
- Agterberg, F. P., Bonham-Carter, G. F., & Wright, D. F. (1990). Statistical pattern integration for mineral exploration *. In G. Gaal & D. F. Merriam (Eds.), Computer applications in resource estimation prediction and assessment for metals and petroleum (pp. 1–21). Pergamon Press.
- Ahmadfaraj, M., Mirmohammadi, M., Afzal, P., Yasrebi, A. B., & Carranza, E. J. (2019). Fractal modeling and fry analysis of the relationship between structures and Cu mineralization in Saveh region, Central Iran. Ore Geology Reviews, 107, 172–185. https://doi.org/10.1016/j.oregeorev.2019.01.026
- Aissa, D. E., & Marignac, C. (2017). Controls on gold deposits in Hoggar, Tuareg shield (southern Algeria). Journal of African Earth Sciences, 127, 136–145. https://doi.org/10.1016/j.jafrearsci.2016.09.002
- Ajibade, A. C., Woakes, M., & Rahaman, M. A. (1987). Proterozoic crustal development in the Pan-African regime of Nigeria. American Geophysical Union, 259–271.
- Ajibade, A. C., & Wright, J. B. (1989). The Togo-Benin-Nigeria shield: Evidence of crustal aggregation in the pan- African belt. Tectonophysics, 165(1–4), 125–129. https://doi.org/10.1016/0040-1951(89)90041-3
- Araújo, M. N. C., Alves da Silva, F. C., Jardim de Sa, E. F., & Holcombe, R. J. (2002). Geometry and structural control of gold vein mineralizations in the Seridó Belt, northeastern Brazil. Journal of South American Earth Sciences, 15(3), 337–348. https://doi.org/10.1016/S0895-9811(02)00040-8
- Attoh, K., Dallmeyer, R. D., & Affaton, P. (1997). Chronology of nappe assembly in the Pan-African Dahomeyide orogen, West Africa evidence from 40Ar39Ar Mineral ages.663. Precambrian Research, 82(1–2), 153–171. https://doi.org/10.1016/s0301-9268(96)00031-9
- Berman, M. (1977). Distance distributions associated with Poisson processes of geometric figures. Journal of Applied Probability, 14(1), 195–199. https://doi.org/10.2307/3213273
- Bernard-Griftiths, J., Peucat, J.-J., & M6not, R.-P. (1991). Isotopic (Rb-Sr, U-Pb and Sm-Nd) and trace element geochemistry of eclogites from the pan-African Belt: A case study of REE fractionation during high-grade metamorphism. Lithos, 27(1), 43–57. https://doi.org/10.1016/0024-4937(91)90019-H
- Bierlein, F. P., Murphy, F. C., Weinberg, R. F., & Lees, T. (2006). Distribution of orogenic gold deposits in relation to fault zones and gravity gradients: Targeting tools applied to the eastern goldfields, Yilgarn Craton, Western Australia. Mineralium Deposita, 41(2), 107–126. https://doi.org/10.1007/s00126-005-0044-4
- Blenkinsop, T. G. (1994). The fractal distribution of gold deposits. In J. E. Kruhl (Ed.), Fractals and dynamic systems in geoscience (pp. 247–258). Springer.
- Blenkinsop, T. G. (1995). Fractal measures for size and spatial distributions of gold mines: Economic applications. In T. G. Blenkinsop & P. L. Tromp (Eds.), Sub-Saharan economic geology (Vol. 3, pp. 177–186). Geological Society of Zimbabwe Special Publication.
- Blenkinsop, T. G., & Sanderson, D. (1999). Are gold deposits in the crust fractals? A study of gold mines in the Zimbabwe Craton. Geological Society, London, Special Publications, 155(1), 141–151. https://doi.org/10.1144/GSL.SP.1999.155.01.11
- Bonham-Carter, G. F. (1985). Statistical association of gold occurrences with Landsat-derived lineaments, Timmins-Kirkland lake area Ontario. Canadian Journal of Remote Sensing, 11(2), 195–210. https://doi.org/10.1080/07038992.1985.10855089
- Boots, B. N., & Getis, A. (1988). Point pattern analysis. In Sage university scientific geography series No. 8 (p. 93). Sage Publications, Beverly Hills.
- Bruguier, O., Dada, S., & Lancelot, J. R. (1992). Découverte d’Archéen ancien au Nord Nigéria: application du chronomètre U-Pb sur monocristaux de zircons abrasés. In 14e Reunion Des Sciences de La Terre. Soc. Géol. Fr. Paris.
- Caby, R. (1987). The Pan-African belt of West Africa from the Sahara desert to the Gulf of Benin. In J. P. Schaer & J. E. Rodgers (Eds.), The Anatomy of Mountain Ranges (pp. 129–170). New Jersey, USA: Princeton University Press.
- Caby, R. (1989). Precambrian terranes of Benin-Nigeria and north-east Brazil and the late-Proterozoic South Atlantic fit. Geological Society of America Special Papers, 230, 145–158. https://doi.org/10.1130/SPE230-p145
- Caby, R., & Boesse, J. M. (2001). Pan-African nappe system in southwest the Ife-llesha schist belt Nigeria. Journal of African Earth Sciences, 33(2), 211–225.
- Cahen, L., Snelling, N. J., Delhal, J., & Vail, J. R. (1984). The geochronology and evolution of Africa. Clarendon Press.
- Carranza, E. J. M. (2009). Controls on mineral deposit occurrence inferred from analysis of their spatial pattern and spatial association with geological features. Ore Geology Reviews, 35(3–4), 383–400. https://doi.org/10.1016/j.oregeorev.2009.01.001
- Carranza, E. J. M., & Hale, M. (2002). Spatial association of mineral occurrences and curvilinear geological features. Mathematical Geology, 34(2), 203–221. https://doi.org/10.1023/A:1014416319335
- Carranza, E. J. M., Hale, M., & Faassen, C. (2008). Selection of coherent deposit-type locations and their application in data-driven mineral prospectivity mapping. Ore Geology Reviews, 33(3–4), 536–558. https://doi.org/10.1016/j.oregeorev.2007.07.001
- Carranza, E. J. M., Owusu, E. A., & Hale, M. (2009). Mapping of prospectivity and estimation of number of undiscovered prospects for lode gold, southwestern ashanti belt, Ghana. Mineralium Deposita, 44(8), 915–938. https://doi.org/10.1007/s00126-009-0250-6
- Carranza, E. J. M., & Sadeghi, M. (2010). Predictive mapping of prospectivity and quantitative estimation of undiscovered VMS deposits in Skellefte district (Sweden). Ore Geology Reviews, 38(3), 219–241. https://doi.org/10.1016/j.oregeorev.2010.02.003
- Castaing, C., Triboulet, C., Feybesse, J. L., & Chèvremont, P. (1993). Tectonometamorphic evolution of Ghana, Togo and Benin in the light of the Pan-African Brasiliano orogeny. Tectonophysics, 218(4), 323–342. https://doi.org/10.1016/0040-1951(93)90322-B
- Cheng, Q., & Agterberg, F. P. (1995). Multifractal modeling and spatial point processes. Mathematical Geology, 27(7), 831–845. https://doi.org/10.1007/BF02087098
- Cheng, Q., Agterberg, F. P., & Ballantyne, S. B. (1994). The separation of geochemical anomalies from background by fractal methods. Journal of Geochemical Exploration, 51(2), 109–130. https://doi.org/10.1016/0375-6742(94)90013-2
- Cheng, Q., Agterberg, F. P., & Bonham-Carter, G. F. (1996). Fractal pattern integration for mineral potential estimation. Nonrenewable Resources, 5(2), 117–130. https://doi.org/10.1007/BF02257585
- Dada, S. S. (1998). Crust-forming ages and proterozoic crustal evolution in Nigeria: a reappraisal of current interpretations. Precambrian Research, 87(1–2), 65–74. https://doi.org/10.1016/S0301-9268(97)00054-5
- Dada, S. S., Lancelot, J. R., & Briqueu, L. (1989). Age and origin of the annular charnockitic complex at Toro, Northern Nigeria: U Pb and Sr evidence. Journal of African Earth Sciences, 9(2), 227–234. https://doi.org/10.1016/0899-5362(89)90066-3
- Danbatta, U. A. (2008). Precambrian crustal development in the north western part of Zuru schist belt, northwestern Nigeria. Journal of Mining and Geology, 44(1), 45–56. https://doi.org/10.4314/jmg.v44i1.18883
- Deng, H., Huang, J., Liu, Z., Li, L., Liu, X., Wang, X., Chen, J., Wu, Z., & Mao, X. (2024). Hidden Markov model for spatial analysis of three-dimensional mineralization distribution: Insights into magma flow and mineral exploration target in the Jinchuan Ni-Ci-(PGE) sulfide deposit, China. Applied Geochemistry, 162, 105911. https://doi.org/10.1016/j.apgeochem.2024.105911
- Diggle, P. J. (1983). Statistical analysis of spatial point patterns. Academic Press.
- Diggle, P. J. (2003). Statistical analysis of spatial point patterns. Arnold Publishers.
- Elueze, A. A. (1992). Rift system for proterozoic schist belts in Nigeria. Tectonophysics, 209(1–4), 167–169. https://doi.org/10.1016/0040-1951(92)90019-3
- Fagbohun, B. J., Omitogun, A. A., Bamisaiye, O. A., & Ayoola, F. J. (2020a). Gold potential of the Pan African Trans-Sahara belt and prospect for further exploration. In Ore geology reviews (Vol. 116). Elsevier B.V. https://doi.org/10.1016/j.oregeorev.2019.103260
- Fagbohun, B. J., Omitogun, A. A., Bamisaiye, O. A., & Ayoola, F. J. (2020b). Remote detection and interpretation of structural style of the Zuru Schist Belt, Northwest Nigeria. Geocarto International, 37(4), 978–998. https://doi.org/10.1080/10106049.2020.1753822
- Ferré, E., Déléris, J., Bouchez, J. L., Lar, A. U., & Peucat, J. J. (1996). The pan-African reactivation of Eburnean and Archaean provinces in Nigeria: Structural and isotopic data. Journal of the Geological Society, London, 153(5), 719–728. https://doi.org/10.1144/gsjgs.153.5.0719
- Ferré, E., Gleizes, G., & Caby, R. (2002). Obliquely convergent tectonics and granite emplacement in the Trans-Saharan belt of Eastern Nigeria: A synthesis. Precambrian Research, 114(3–4), 199–219. https://doi.org/10.1016/S0301-9268(01)00226-1
- Fitches, W. R., Ajibade, A. C., Egbuniwe, I. G., Holts, R. W., & Wrights, J. B. (1985). Late proterozoic schist belts and plutonism in NW Nigeria. Journal of the Geological Society of London, 142(2), 319–337. https://doi.org/10.1144/gsjgs.142.2.0319
- Fry, N. (1979). Random point distributions and strain measurement in rocks. Tectonophysics, 60(1–2), 89–105. https://doi.org/10.1016/0040-1951(79)90135-5
- Garba, I. (1996). Tourmalinization related to late proterozoic-early palaeozoic lode gold mineralization in the Bin Yauri area, Nigeria. Mineral Deposita, 209(3), 201–209. https://doi.org/10.1007/BF00204027
- Garba, I. (2000). Origin of pan-African mesothermal gold mineralisation at Bin Yauri, Nigeria. Journal of African Earth Sciences, 31(2), 433–449. https://doi.org/10.1016/S0899-5362(00)00098-1
- Garba, I. (2002). Geochemical characteristics of the gold mineralization near Tsohon Birnin Gwari, Northwestern Nigeria. In Chemie der Erde Geochemistry (Vol. 62). Urban & Fischer Verlag. http://www.urbanfischer.de/journals/chemerd
- Garba, I. (2003). Geochemical characteristics of mesothermal gold mineralisation in the Pan-African (600 ± 150 Ma) basement of Nigeria. Transactions of the Institution of Mining and Metallurgy, Section B: Applied Earth Science, 112(3), 319–325. https://doi.org/10.1179/037174503225003143
- Garba, I., & Akande, S. O. (1992). The origin and significance of non-aqueous CO2 fluid inclusions in the auriferous veins of Bin Yauri, northwestern Nigeria. Mineral Deposita, 255(3), 249–255. https://doi.org/10.1007/BF00202550
- Goldfarb, R. J., Baker, T., Dube, B., Groves, D. I., Hart, C. J. R., & Gosselin, P. (2005). Distribution, character, and genesis of gold deposits in metamorphic terranes. Economic Geology’s 100th Anniversary, 407–450.
- Goldfarb, R. J., Groves, D. I., & Gardoll, S. (2001). Orogenic gold and geologic time: A global synthesis. Ore Geology Reviews, 18(1–2), 1–75. https://doi.org/10.1016/S0169-1368(01)00016-6
- Gonçalves, M. A., Mateus, A., & Oliveira, V. (2001). Geochemical anomaly separation by multifractal modelling. Journal of Geochemical Exploration, 72(2), 91–114. https://doi.org/10.1016/S0375-6742(01)00156-X
- Goodenough, K. M., Lusty, P. A. J., Roberts, N. M. W., Key, R. M., & Garba, A. (2014). Post-collisional Pan-African granitoids and rare metal pegmatites in western Nigeria: Age, petrogenesis, and the ‘pegmatite conundrum’. Lithos, 200-201(1), 22–34. https://doi.org/10.1016/j.lithos.2014.04.006
- Grant, N. K. (1969). The late precambrian to early Paleozoic Pan-African orogeny in Ghana, Togo, Dahomey, and Nigeria. Geological Society of America Bulletin, 80(1), 45–56. https://doi.org/10.1130/0016-7606(1969)80[45:TLPTEP]2.0.CO;2
- Green, J. C. (1993). Proterozoic Rifts. In K. C. Condie (Ed.), Proterozoic Crustal Evolution (p. 536). Elsevier Science.
- Greentree, M., Larcode, M., & De Waele, B. (2016). Regional GIS exploration targeting in data poor environments: A case study of gold prospectivity mapping in Nigeria. International Geological Congress.
- Groves, D. I., Goldfarb, R. J., Gebre-Mariam, M., Hagemann, S. G., & Robert, F. (1998). Orogenic gold deposits: A proposed classification in the context of their crustal distribution and relationship to other gold deposit types. Ore Geology Reviews, 13(1–5), 7–27. https://doi.org/10.1016/S0169-1368(97)00012-7
- Groves, D. I., Goldfarb, R. J., Knox-Robinson, C. M., Ojala, J., Gardoll, S., Yun, G. Y., & Holyland, P. (2000). Late-kinematic timing of orogenic gold deposits and significance for computer-based exploration techniques with emphasis on the Yilgarn Block, Western Australia. Ore Geology Reviews, 17(1–2), 1–38. https://doi.org/10.1016/s0169-1368(00)00002-0
- Groves, D. I., Santosh, M., Goldfarb, R. J., & Zhang, L. (2018). Structural geometry of orogenic gold deposits: Implications for exploration of world-class and giant deposits. Geoscience Frontiers, 9(4), 1163–1177. https://doi.org/10.1016/j.gsf.2018.01.006
- Haddad Martim, P. M., de Souza Filho, C. R., & Carranza, E. J. M. (2016). Spatial analysis of mineral deposit distribution: A review of methods and implications for structural controls on iron oxide-copper-gold mineralization in Carajás, Brazil. Ore Geology Reviews, 81, 230–244. https://doi.org/10.1016/j.oregeorev.2016.09.038
- Hanna, S. S., & Fry, N. (1979). A comparison of methods of strain determination in rocks from southwest Dyfed (Pembrokeshire) and adjacent areas. Journal of Structural Geology, 1(2), 155–162. https://doi.org/10.1016/0191-8141(79)90052-X
- Hobbs, B. E., Ord, A., & Blenkinsop, T. (2022). The spatial distributions of mineralization. Journal of Structural Geology, 156, 104529. https://doi.org/10.1016/j.jsg.2022.104529
- Holt, R. W., Egbuniwe, I. G., Wright, W. R., & Fitches, J. B. (1978). The relationships between low-grade metasedimentary belts, calc-alkaline volcanism and the Pan-African orogeny in N.W. Nigeria. Geologische Rundschau, 67(2), 631–646. https://doi.org/10.1007/BF01802808
- Hubbard, F. H. (1975). Precambrian crustal development in western Nigeria: Indications from the lwo region. Geological Society of America Bulletin, 86, 548–554.
- Khalajmasoumi, M., Sadeghi, B., Carranza, E. J. M., & Sadeghi, M. (2017). Geochemical anomaly recognition of rare earth elements using multi-fractal modeling correlated with geological features, Central Iran. Journal of Geochemical Exploration, 181, 318–332. https://doi.org/10.1016/j.gexplo.2016.12.011
- Klemm, D. D., Schneider, W., & Wagner, B. (1984). The precambrian metavolcano- sedimentary sequence east of Ife and Ilesha/SW Nigeria. A Nigerian ‘greenstone belt’? Journal of African Earth Sciences (1983), 2(2), 161–176. https://doi.org/10.1016/S0731-7247(84)80011-7
- Kreuzer, O. P., Blenkinsop, T. G., Morrison, R. J., & Peters, S. G. (2007). Ore controls in the charters towers goldfield, NE Australia: Constraints from geological, geophysical and numerical analyses. Ore Geology Reviews, 32(1–2), 37–80. https://doi.org/10.1016/j.oregeorev.2006.12.001
- Lisitsin, V. (2015). Spatial data analysis of mineral deposit point patterns: Applications to exploration targeting. Ore Geology Reviews, 71, 861–881. https://doi.org/10.1016/j.oregeorev.2015.05.019
- Liu, L., Li, J., Zhou, R., & Sun, T. (2016). 3D modeling of the porphyry-related dawangding gold deposit in South China: Implications for ore genesis and resources evaluation. Journal of Geochemical Exploration, 164, 164–185. https://doi.org/10.1016/j.gexplo.2015.11.002
- Mandelbrot, B. B. (1983). The fractal geometry of nature (updated and augmented edition). Freeman. Nigerian Geological Survey Agency. (2006). Geological Map of Nigeria. Nigerian Geological Survey Agency (NGSA). (2005). Mineral Resources Map of Nigeria.
- Mao, X., Ren, J., Liu, Z., Chen, J., Tang, L., Deng, H., Bayless, R. C., Yang, B., Wang, M., & Liu, C. (2019). Three dimensional prospectivity modeling of the Jiaojia-type gold deposit, Jiaodong Peninsula, Eastern China: A case study of the Dayingezhuang deposit. Journal of Geochemical Exploration, 3, 27–44. https://doi.org/10.1016/j.gexplo.2019.04.002
- Marignac, C. H., Semiani, A. S. F., Boiron, M. C., Joron, J. L., Kienast, J. R., & Peucat, J. J. (1996). Metallogenesis of the late pan-african gold-bearing east ouzzal shear zone (hoggar, Algeria). Journal of Metamorphic Geology, 14, 783–801.
- Nigerian Geological Survey Agency (NGSA). (2005). Mineral resources map of Nigeria.
- Niiranen, T., Nykänen, V., & Lahti, I. (2019). Scalability of the mineral prospectivity modelling – an orogenic gold case study from northern Finland. Ore Geology Reviews, 109, 11–25. https://doi.org/10.1016/j.oregeorev.2019.04.002
- Odeyemi, I. (1981). A review of the orogenic events in the precambrian basement of Nigeria, West Africa. Geologische Rundschau, 70(3), 897–909. https://doi.org/10.1007/BF01820170
- Okonkwo, C. T., & Valentin, Y. G. (2015). Geochemistry and geochronology of orthogneisses in Bode Saadu Area, Southwestern Nigeria and their implications for the palaeoproterozoic evolution of the area. Journal of African Earth Sciences, 109, 131–142. https://doi.org/10.1016/j.jafrearsci.2015.05.012
- Olade, M. A., & Elueze, A. A. (1979). Petrochemistry of the ilesha amphibolites and precambrian crustal evolution in the Pan-African Domain of SW Nigeria. Precambrian Research, 8, 303–318.
- Omitogun, A. A., Caby, R., Debat, P., & Mercier, A. (1990). Characteristics of Pan African Metamorphism in the Igarra Schist Belt and the associated basement rocks (Nigeria). Procedings 15th Colloquim on African Geology 10-13 September, Nancy, France (pp. 280–282).
- Onyeagocha, A. C., & Ekwueme, B. N. (1990). Temperature-pressure distribution patterns in metamorphosed rocks of the Nigerian basement complex – a preliminary analysis. Journal of African Earth Sciences, 11(1–2), 83–93. https://doi.org/10.1016/0899-5362(90)90079-T
- Ord, A. (1994). The fractal geometry of patterned structures in numerical models of rock deformation. In J. H. Kruhl (Ed.), Frractals and dynamic systems in geoscience (pp. 131–155). Springer.
- Parsa, M., & Maghsoudi, A. (2018). Controls on Mississippi Valley-type Zn-pb mineralization in Behabad district, Central Iran: Constraints from spatial and numerical analyses. Journal of African Earth Sciences, 140, 189–198. https://doi.org/10.1016/j.jafrearsci.2018.01.012
- Parsa, M., Maghsoudi, A., & Yousefi, M. (2017). Spatial analyses of exploration evidence data to model skarn-type copper prospectivity in the Varzaghan district, NW Iran. Ore Geology Reviews, 92, 97–112. https://doi.org/10.1016/j.oregeorev.2017.11.013
- Pirajno, F. (1992). Hyrothermal mineral deposit. Springer Berlin Heidelberg. https://doi.org/10.1007/978-3-642-75671-9
- Powell, C. M., Li, Z. X., Thrupp, G. A., & Schmidt, P. W. (1990). Australian Palaeozoic palaeomagnetism and tectonics—1: Tectonostratigraphic terrane constraints from the tasman fold belt. Journal of Structural Geology, 12, 553–656.
- Price, N. J., & Cosgrove, J. W. (1990). Analysis of geological structures. Cambridge University Press.
- Rahaman, M. A. (1988). Recent advances in the study of the basement complex of Nigeria precambrian geology of Nigeria.
- Rahaman, M. A., Emofurieta, W. O., & Caen-Vachette, M. (1983). The potassic-granites of the Igbeti area: Further evidence of the polycyclic evolution of the pan-African belt in southwestern Nigeria. Precambrian Research, 22(1–2), 75–92. https://doi.org/10.1016/0301-9268(83)90059-1
- Rahaman, M. A., & Ocan, O. (1978). On relationships in the precambrian migmatitic gneisses of Nigeria. Journal of Mineral Geology, 15, 23–32.
- Rahaman, M. A., Tubosun, I. A., & Lancelot, J. R. (1991). U Pb geochronology of potassic syenites from SW Nigeria and the timing of deformational events during the Pan-African orogeny. Journal of African Earth Sciences, 13(3–4), 387–395. https://doi.org/10.1016/0899-5362(91)90102-5
- Raines, G. L. (2008). Are fractal dimensions of the spatial distribution of mineral deposits meaningful? Natural Resources Research, 17(2), 87–97. https://doi.org/10.1007/s11053-008-9067-8
- Ramadan, T. M., & Fattah, M. F. A. (2011). Characterization of gold mineralization in Garin Hawal area, Kebbi State, NW Nigeria, using remote sensing. The Egyptian Journal of Remote Sensing and Space Sciences, 13(2), 153–163. https://doi.org/10.1016/j.ejrs.2009.08.001
- Ramsay, J. G. (1967). Folding and fracturing of rocks. MacGraw-Hill.
- Ramsay, J. G., & Huber, M. I. (1987). The techniques of modern structural geology. In Folds and fractures (Vol. 2). Academic Press. https://www.google.co.uk/books/edition/_/q0cUMA5dEBEC?hl=en&gbpv=1&pg=PA309
- Robert, F., Brommecker, R., Bourne, B. T., Dobak, P. J., McEwan, C. J., Rowe, R. R., & Zhou, X. (2007). Models and exploration methods for major gold deposit types. In B. Milkereit (Ed.).Proceedings of Exploration 07: Fifth Decennial International Conference on Mineral Exploration, Toronto, Canada (pp. 691–711).
- Robertson, M., & Peters, L. (2016). West African goldfields. Episodes, 39(2), 155–176. https://doi.org/10.18814/epiiugs/2016/v39i2/95773
- Saad, W., Aissa, D. E., Watanabe, K., & Taguchi, S. (2018). Gold deposits associated with the gabbroic rocks at Tirek area, western Hoggar, Algeria: Fluid inclusion study. Arabian Journal Geosciences, 11(26).
- Salawu, N. B., Omosanya, K. O. I., Eluwole, A. B., Saleh, A., & Adebiyi, L. S. (2023). Structurally-controlled gold mineralization in the Southern Zuru Schist Belt NW Nigeria: Application of remote sensing and geophysical methods. Journal of Applied Geophysics, 211, 104969. https://doi.org/10.1016/j.jappgeo.2023.104969
- Sun, T., Chen, F., Zhong, L., Liu, W., & Wang, Y. (2019). GIS-based mineral prospectivity mapping using machine learning methods: A case study from Tongling ore district, eastern China. Ore Geology Reviews, 109(March), 26–49. https://doi.org/10.1016/j.oregeorev.2019.04.003
- Thor Explorations Ltd. (2018). Excellent preliminary metallurgical test work results for Thor’s Segilola gold project. https://www.thorexpl.com/news/2018/excellent-preliminary-metallurgical-test-work-results-for-thors-segilola-gold-project/
- Tubosun, I. A., Lancelot, J. R., Rahaman, M. A., & Ocan, O. O. (1984). U-Pb Pan-African ages of two chamockite-granite associations from SW Nigeria. Contributions to Mineralogy and Petrology, 88(1–2), 188–195. https://doi.org/10.1007/BF00371422
- Turner, D. C. (1983). Upper proterozoic schist belts in the Nigerian sector of the pan-African province of West Africa. Precambrian Research, 21(1–2), 55–79. https://doi.org/10.1016/0301-9268(83)90005-0
- Unrug, R. (1997). Rodinia to Gondwana: The geodynamic map of Gondwana supercontinent assembly. GSA Today : A Publication of the Geological Society of America, 7(1), 1–6.
- Vearncombe, J., & Vearncombe, S. (1999). The spatial distribution of mineralization: Applications of Fry Analysis. Economic Geology, 94(4), 475–486. https://doi.org/10.2113/gsecongeo.94.4.475
- Vearncombe, S., & Vearncombe, J. R. (2002). Tectonic controls on kimberlite location, southern Africa. Journal of Structural Geology, 24(10), 1619–1625. https://doi.org/10.1016/S0191-8141(01)00152-3
- Woakes, M., & Bafor, B. E. (1984). Primary gold mineralization in Nigeria. In R. P. Foster (Ed.), GOLD ’82: The geology, geochemistry and genesis of gold deposits (1st ed. pp. 661–671). Geological Society of Zimbabwe, Special Publication No. 1.
- Woakes, M., Rahamant, A., & Ajibade, A. C. (1987). Some metallogenetic features of the Nigerian Basement. Journal of African Earth Sciences, 6(5), 655–664. https://doi.org/10.1016/0899-5362(87)90004-2
- Wright, J. B. (1985).Geology and mineral resources of West Africa. J. B. Wright (Ed.). George Allen & Unwin (Publishers) Ltd.
- Yin, J., Lindsay, M., & Teng, S. (2018). Mineral prospectivity analysis for BIF iron deposits: A case study in the Anshan-Benxi area, Liaoning province, North-East China. Ore Geology Reviews. https://doi.org/10.1016/j.oregeorev.2018.11.019
- Zhao, J., Chen, S., Zuo, R., & Zhou, M. (2019). Controls on and prospectivity mapping of volcanic-type uranium mineralization in the Pucheng district, NW Fujian, China. Ore Geology Reviews, 112, 112. https://doi.org/10.1016/j.oregeorev.2019.103028
- Zuo, R., Agterberg, F. P., Cheng, Q., & Yao, L. (2009). Fractal characterization of the spatial distribution of geological point processes. International Journal of Applied Earth Observation and Geoinformation, 11(6), 394–402. https://doi.org/10.1016/j.jag.2009.07.001
- Zuo, R., Cheng, Q., Agterberg, F. P., & Xia, Q. (2009). Application of singularity mapping technique to identify local anomalies using stream sediment geochemical data, a case study from Gangdese, Tibet, western China. Journal of Geochemical Exploration, 101(3), 225–235. https://doi.org/10.1016/j.gexplo.2008.08.003
Appendix
Table A1. Details of known gold occurrences.