
Abstract
Following a dramatic decline, the lesser kestrel Falco naumanni global population has recently stabilised, although it is still fluctuating in several countries, including Greece. Nestling growth rates and size at fledging greatly influence future survival and reproductive success, and therefore the study of postnatal growth can aid the understanding of population dynamics and the conservation of avian populations. We quantified body mass and morphological traits in female and male lesser kestrel nestlings from a lowland Greek breeding population. Nonlinear mixed models were used to describe and compare growth trajectories. Growth in body mass, tarsus and bill reached asymptotic values before fledging and was best described by the logistic equation, whereas total length grew linearly beyond the fledging phase. Random variation was found in the asymptote in body mass, the inflection point in body mass, tarsus and bill lengths and the intercept in total length, being substantially higher between nests than amongst siblings, implying differences in parental quality between nests and also an even distribution of parental care amongst siblings. Random effects were not observed on the growth rate constant, supporting the hypothesis that it varies little within populations. Females were significantly heavier and had longer bills and total length than males, whereas males were similar to females in tarsus growth. Nonlinear mixed models allowed us to describe a stage of avian life vital for future survival and reproductive output and reveal variation between nests, nestlings and the sexes.
Introduction
The study of postnatal growth can provide critical information for the conservation of avian populations because nestling growth rates and size at fledging greatly influence future survival and reproductive success (Gebhardt-Henrich & Richner Citation1998). Food availability seems to be the most important environmental factor for postnatal growth (Martin Citation1987), and also most other environmental causes of growth variation, especially in body mass, seem somehow related to food supply (Gebhardt-Henrich & Richner Citation1998). However, Moe et al. (Citation2004) showed that overall structural growth was very well conserved even during food restriction in nestling European shags Phalacrocorax aristotelis (Linnaeus, 1761), suggesting that structural size is expected to vary less with varying food availability than body mass is. Sex has also been confirmed to influence growth, especially in sexually dimorphic species (Becker & Wink Citation2003; Kalmbach et al. Citation2009). At least two lines of hypotheses have been proposed to explain reversed sexual size dimorphism (RSSD) in raptors (e.g. Earhart & Johnson Citation1970; Trivers Citation1972; Newton Citation1986). The first stresses the importance of large female size in the evolution of RSSD (females may be heavier to increase reproductive output: natural selection hypothesis), while the second focuses on the significance of small male size (smaller males may be more often selected by females for mating because they are more efficient hunters: sexual selection hypothesis).
The lesser kestrel Falco naumanni (Fleischer, 1818) is a colonial and migratory falcon, displaying moderate female-biased sexual size dimorphism (Cramp & Simmons Citation1980; Ortego et al. Citation2010). Its global population is estimated at 25,100–52,000 pairs, whilst the European breeding population lies between 25,000 and 42,000 breeding pairs (BirdLife International Citation2015). The western European population suffered a dramatic decline of 95% since 1950; however, recently its numbers have been stabilised and thus the species qualified as “least concern” (BirdLife International Citation2015), mainly due to conservation efforts that led to population increases in several countries, most notably France, Italy, Portugal and Spain (Iñigo & Barov Citation2010). Its population in Greece, comprising approximately 15% of the European total, has also been declining and it is mostly concentrated in Thessaly, central Greece, in 98 colonies totaling c. 2900 breeding pairs (Vlachos et al. Citation2004a). Lesser kestrels prefer human constructions for nesting and are associated with cultivated fields as foraging places (Vlachos et al. Citation2003). As a result of this behaviour, the reduction of nesting habitats (renovation and/or demolition of old buildings) and the intensification in agricultural practices are included in the major causes of its decline throughout its breeding geographical range in Europe (Donázar et al. Citation1993; Biber Citation1996).
Many aspects of lesser kestrel’s biology and ecology have been studied, including population dynamics, breeding success, mate provisioning, foraging habitat and behaviour, environmental contamination, and genetic structure and diversity, particularly in Spain (e.g. Aparicio Citation1997; Aparicio & Cordero Citation2001; Serrano et al. Citation2005; Ortego et al. Citation2010), Italy (e.g. Campobello et al. Citation2012; Sarà et al. Citation2012; Di Maggio et al. Citation2013, Citation2015, Citation2016), Portugal (e.g. Franco et al. Citation2004, Citation2005; Catry et al. Citation2011, Citation2016), France (e.g. Choisy et al. Citation1999; Lepley et al. Citation2000; Prugnolle et al. Citation2003; Mihoub et al. Citation2012) and Greece (e.g. Vlachos et al. Citation2003, 2004a,b, 2015; Goutner et al. Citation2015). Despite their usefulness in predicting future population dynamics and monitoring local environmental conditions, we only found two studies of nestling lesser kestrel growth patterns. Rodríguez et al. (Citation2006) developed a model simulating the growth in body mass of a lesser kestrel brood as a function of prey abundance and prey size. Catry et al. (Citation2012) presented the growth in body mass of 62 lesser kestrel nestlings from Portugal.
As part of long-term research for the conservation of the lesser kestrel and its habitats (Bakaloudis Citation2012; Vlachos et al. Citation2015), the current study describes for the first time the falcon’s postnatal growth trajectories in Greece. First, growth functions were fitted to body mass, tarsus, bill and total length measurements to estimate growth parameters. Second, nonlinear mixed models were used to estimate variation between nests and nestlings and test for the effect of sex on growth parameters.
Materials and methods
Study area
The study was conducted in 2007 on a lesser kestrel colony located near the village of Armenio (22°41΄36΄΄E, 39°29΄09΄΄N), within the “Periochi Thessalikou Kampou” Special Protected Area (SPA, GR-1420011), at the eastern part of the Larissa plain, Thessaly, central Greece (). The colony consisted of approximately 120 pairs, nesting in nest boxes. Lesser kestrel’s reproductive output increases in protected nest sites, and Vlachos et al. (Citation2004a) reported a mean clutch size of four eggs and a mean number of 3.16 fledglings in the study colony. Nest boxes were made from 15-mm-thick marine plywood and their dimensions were: 280 mm (front height), 330 mm (back height), 290 × 290 mm (floor), 75 mm (entrance hole diameter). Nest boxes were mounted on Calabrian pine (Pinus brutia) trees at 3 m above ground and they were orientated from south to south-west.
Figure 1. Location of the study area in central Greece.
The study area is surrounded by 20,000 ha of intensively cultivated agricultural land, ranging from 78 to 90 m above sea level. The climate is thermo-Mediterranean, with mild rainy winter, dry and hot summer and a mean annual precipitation of about 465 mm. The most important crops include cotton, corn and cereals, whereas natural habitats are marginal, mainly grasslands and abandoned fields (Vlachos et al. Citation2015).
Fieldwork and growth measurements
Nest boxes were checked from mid-April to mid-July. All nests were monitored every 2 days until the clutch was completed, since females usually lay three to five eggs with mean intervals of 2 days. Eggs hatch asynchronously because incubation, which usually lasts 26–28 days, begins before clutch completion. Therefore nests were checked 25 days after clutch initiation and every other day after that to find and measure hatchlings. A sample of 10 nests was selected after hatching, and then nests were visited every 3 days to a maximum age of 28 days. After that age and until fledging, which occurs at about 37 days (Bustamante & Negro Citation1994), nestlings are highly mobile and cannot be approached without risking injury.
Nestlings were marked at hatching with nail varnish, and they were banded 1 week later, with coloured plastic rings. Sex determination was carried out at the age of 20 days, following the method of Negro and Hiraldo (Citation1992), using the colour of the rectrices and upper tail coverts. In nestlings that are 3 weeks old or older, rectrices and upper tail coverts are greyish or cinnamon in males, and brown and more heavily streaked in females. This method was tested and found 100% accurate by Negro and Hiraldo (Citation1992) and Aparicio and Cordero (Citation2001).
During each visit, body mass and three structural size measurements (bill length, tarsus length and total length) were taken for each nestling from hatching and to a maximum age of 28 days. All measurements were taken by the same person (S. Braziotis) to eliminate variation among investigators, and those taken on the day of hatching were assigned to age 0. All visits were made at the same time of the day, from 06:30 to 10:00, to avoid diurnal variations in body mass. Body mass was measured with an electronic balance to the nearest 0.1 g. Bill length (from the anterior edge of the cere to the tip of the bill) and tarsus length (from middle of midtarsal joint to distal end of tarsometatarsus, with foot closed towards tail) were measured with digital calipers to the nearest 0.1 mm. Total length was measured, from the tip of the bill to the tip of the tail, with a stopped ruler to the nearest 1 mm. The bird was held gently on its back, with the head bent dorsally so that the bill was parallel with the ruler.
Fitting growth functions
The two most commonly fitted growth curves to model nestling growth, the logistic and Gompertz (Ricklefs Citation1968, Citation1983), were used to test which best describes the growth of lesser kestrel body mass, bill and tarsus length. Initial fitting showed that the logistic function provided a better fit to all considered growth variables, and it was therefore used for further modelling (ΔAICc > 9; Table S1): g = A/(1+exp(-k(t-T))), where g is the growth variable, A its asymptotic value, t the nestling’s age in days (d), k the logistic growth rate constant in d−1, which is proportional to the overall growth rate (Ricklefs Citation1968), and T the inflection point in d, which occurs when 50% of the total logistic growth has been accomplished. The maximum growth rate (gmax) that occurs at the inflection point T was also calculated, as kA/4.
After visual inspection of the data, total length plotted against nestling age appeared to follow a linear pattern. Therefore, a linear equation was used to fit total length data: TL = bt+a, where TL is the total length, t the nestling’s age in days, a and b the intercept and slope, respectively.
Statistical analyses
Nestling growth was modelled with nonlinear mixed models (NLMM) for body mass, bill and tarsus length, and with linear mixed models (LMM) for total length (Pinheiro & Bates Citation2000; Zuur et al. Citation2009; Sofaer et al. Citation2013). To account for the variation of different nestlings in different nests, a hierarchical random effect structure was included in the models (Pinheiro & Bates Citation2000; Zuur et al. Citation2009). These random effects estimated the amount of variation in each parameter between nests (including nest identity as a random factor) and between nestlings (including nestling identity as a random factor). Because nestlings were repeatedly measured, a first-order autoregressive correlation structure was also included in the models to account for temporal autocorrelation within nestlings (Pinheiro & Bates Citation2000; Zuur et al. Citation2009).
The protocol recommended by Diggle et al. (Citation2002) was used for the selection of the optimal model. Starting with a model including a set of three nest random effects and a set of three nestling random effects (on parameters A, k, T), the correlations between random effects in each set, and also fixed effects of sex on all parameters, the optimal random effect structure model was first found using restricted maximum likelihood (REML). When a model failed to converge, or the standard deviation of a random effect was zero, or the absolute correlation between two random effects was 0.90 or higher, that model was excluded from further analyses as overparameterised. After selecting the optimal structure of the random component, the optimal fixed structure was determined using maximum likelihood estimation. To test for the effect of sex on the three growth parameters, a total of 23 = 8 logistic growth models were considered.
Analyses were performed in the program R 3.1.1 (R Development Core Team Citation2014). Functions nlme and nls of package nlme (Pinheiro et al. Citation2014) were used to fit models with and without random effects, respectively. Model assumptions of homogeneity of variance and normality were visually checked. As is typical for mass data, variance was increasing with age. However, the attempt to correct for heteroscedasticity in body mass residuals by modelling variance as a function of age (Pinheiro & Bates Citation2000) resulted in poor estimation of asymptotic values due to the reduced influence of older, heavier nestlings on the model. Therefore, heteroscedasticity was not accounted for in subsequent analysis.
An information-theoretic approach based on the Akaike information criterion corrected for small sample size (AICc: Akaike Citation1973; Burnham & Anderson Citation2002) was used for the selection of the optimal random and fixed-effect structures (see Tables S1 and S2). In both instances, the most parsimonious model was selected, namely the model with the fewest parameters among those with substantial support (ΔAICc < 2). The estimates of the most parsimonious model were derived with REML for each growth measurement. Standard deviation (SD) with 95% confidence intervals (CI) is given for each random effect. For fixed effects, parameter estimates and standard errors (SE) are reported.
Lesser kestrel nestlings peaked in body mass at the age of about 20 days, subsequently decreasing until fledging (see ). To control for the reliability of asymptotic estimates, a second estimate of mass, mean maximum mass, was therefore calculated for each nestling, by using the measurements taken after peak body mass, following Krebs (Citation1999), and was compared with asymptotic values estimated from logistic growth models using two-tailed t-tests (Motulsky & Christopoulos Citation2004). Nestling asymptotic measurements were compared with those of adults’ found in the literature, using two-tailed t-tests.
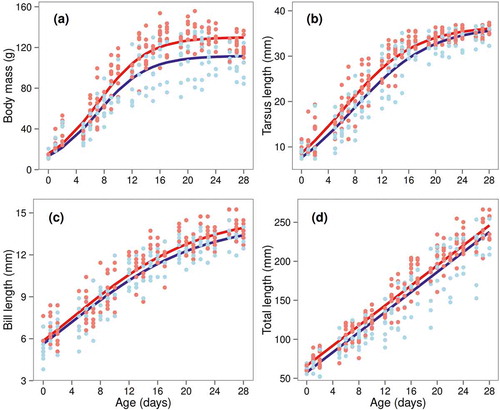
Figure 2. Variation in postnatal growth of four body components of lesser kestrel nestlings from central Greece: (a) body mass, (b) tarsus length, (c) bill length, (d) total length. Logistic growth curves (linear for total length) were fitted to measurements of 40 nestlings (22 female, 18 male), based on the most parsimonious model (indicated in bold in Table S2). Lines are separately drawn for females (red) and males (blue), because the most parsimonious models contained a sex effect on one or more model parameters (i.e. A, the asymptote in g or mm; k, the growth rate constant in d−1; and T, the inflection point in d).
Results
A total of 40 nestlings in 10 nests, five with three nestlings and five with five nestlings, 22 female and 18 male, were regularly measured to the age of 28 days, after which they could not be approached and were considered fledged.
The random-effects models were much better than the fixed-effects-only models for all growth measurements (ΔAICc > 225) and support was strongest for models in which nest and nestling random effects were not correlated between parameters, for all growth measurements (Table S1).
The optimal random structure for body mass included variation both between nests and between nestlings in the asymptotic value and between nests in the inflection point. The estimated nest and nestling random effect SDs on the asymptotic mass were 9.17 g (95% CI = 5.35–15.73) and 0.53 g (95% CI = 0.29–0.96), respectively. The estimated nest random effect SD on the inflection point was 1.12 d (95% CI = 0.63–1.98). The final most parsimonious model included fixed effects of sex on asymptotic mass, with females being heavier and having a faster maximum growth rate than males (; ). Mean maximum masses lower than but close to asymptotic values were estimated for both male (mean 108.21 ± 4.08 g; t4 = 0.741, P = 0.50) and female nestlings (128.06 ± 2.36 g; t4 = 0.503, P = 0.64).
Table I. Parameter estimates (mean ± standard error, SE) of the most parsimonious growth models for body mass, tarsus length, bill length and total length of 40 lesser kestrel nestlings (22 female, 18 male) from central Greece.
The top random effects model for tarsus length included both nest (SD 1.68 d, 95% CI = 1.02–2.78) and nestling random effects (SD 0.84 d, 95% CI = 0.45–1.54) on the inflection point. The most parsimonious fixed-effects model included sex differences on the growth rate and the inflection point. Females had faster growth rates and maximum growth, and reached the inflection point earlier than males (; ).
Nestlings varied in their inflection points of bill growth (SD 1.41 d, 95% CI = 0.61–3.27). The final fixed model included sex effects on the asymptotic values. Female bills were longer and had a faster maximum growth rate than male ones (; Figure 2c).
Nestlings’ total length growth was linear during the first 28 days (Figure 2d). Nests and individuals varied in their intercept. The estimated nest and nestling random effect SDs on the intercept were 6.14 mm (95% CI = 3.06–10.85) and 0.48 mm (95% CI = 0.34–0.65), respectively. Fixed effects included sex differences on the intercept only, with females having a higher intercept than males (; Figure 2d).
Estimated asymptotic tarsus length was higher than the measurements reported by Cramp and Simmons (Citation1980) for adults, both females (mean 31.20 ± 0.89 mm, range 30.00–33.00 mm, n = 16; t4 = 5.262, P = 0.005) and males (30.80 ± 1.03 mm, 29.00–32.00 mm, n = 21; t4 = 5.330, P = 0.006). On the other hand, asymptotic bill length of nestlings was similar to adults’ for both females (13.30 ± 0.62 mm, 12.20–14.50 mm, n = 18; t4 = 2.294, P = 0.083) and males (13.30 ± 0.62 mm, 12.30–14.40 mm, n = 19; t4 = 1.508, P = 0.206).
Discussion
Avian growth and development models are most suitable for comparative studies of the relationships between structure and function, on one hand, and the environment, on the other (Starck & Ricklefs Citation1998). This study presents data on the growth of lesser kestrel nestlings in a Greek colony. Nestling mortality was not observed, probably due to the birds’ breeding in protected nest boxes (Vlachos et al. Citation2004a). Mixed-effects models provided a substantially better fit to the data than models without random effects, for all growth measurements (see Table S1). The inclusion of random effects allowed the understanding of variation in growth between nests and nestlings, and also to account for the lack of independence between measurements. Fixed effects allowed testing for differences in growth parameters between the sexes.
Optimal random-effects models revealed variation in asymptotic values of body mass only, both between nests and between nestlings. Inflection points also varied, between nests in body mass, between nestlings in bill length and between both in tarsus length. Total length varied in the intercept between nests and between nestlings. In contrast, there was a lack of support for nest or nestling random effects on the growth rate constant. This finding is consistent with the hypothesis that the growth rate constant varies little within populations (Ricklefs Citation1968; Sofaer et al. Citation2013). Variation in growth parameters was substantially higher between nests than between nestlings. The greater relative importance of nest random effects indicates that shared genes, maternal effects, and/or a relatively even distribution of parental care overwhelm differences between nest mates (Sofaer et al. Citation2013). The correlation between random effect parameters measures whether deviations around one fixed effect are related to deviations around the other. Nest random effects on the inflection point and the asymptotic mass were not correlated, and while female and male nestlings reached the inflection point at the same time, they attained different asymptotic masses, mostly due to random effects between nestlings (see Table S1).
Results showed sex-specific fixed-effect differences on one or more growth parameters. Females were 16% heavier and had 4% longer bills, although they had similar tarsi to males’. Total length grew linearly; however, the 15% higher intercept in females and the similar slopes suggest longer final sizes for females than males. Female tarsi grew 9% faster and reached a higher maximum growth rate 1.5 days earlier than male tarsi. Female maximum growth rate was also higher for body mass due to the higher asymptote. The more pronounced differences in body mass growth compared to other morphometric characteristics were also observed in nestlings of other sexually size-dimorphic bird species, such as the similar-sized American kestrel Falco sparverius (Linnaeus, 1758) (Negro et al. Citation1994) and Eurasian kestrel Falco tinnunculus (Linnaeus, 1758) (Dijkstra et al. Citation1990), and also in other species such as the European shag (Velando et al. Citation2000) and Eurasian spoonbill Platalea leucorodia (Linnaeus, 1758) (Lok et al. Citation2014).
Body mass levelled off and started to decrease slightly after the age of 20 days. However, logistic models fitted well to lesser kestrel nestling growth trajectories and produced reliable estimates of asymptotic values, as compared to mean maximum masses, after the age of 20 days. A similar decrease in body mass before fledging was also found in the American (Negro et al. Citation1994) and Eurasian kestrels (Dijkstra et al. Citation1990). As it is common in many altricial and semialtricial birds to achieve higher body mass than adults before fledging (Ricklefs Citation1973), Dijkstra et al. (Citation1990) found that the decreasing trend continued after fledging and both sexes attained minimum body mass around the age of independence, about 44–62 days after hatching. Donázar et al. (Citation1992) found that RSSD in lesser kestrels reached maximum values at the onset of egg-laying and concluded that the increase in female body mass allowed the laying of earlier and larger clutches, in support of the natural selection hypothesis on the evolution of RSSD in raptors. Research by Hakkarainen et al. (Citation1996) produced support for the sexual selection hypothesis, suggesting that female Eurasian kestrels prefer to pair with smaller males because they have higher flight performance and better hunting success than heavier males, thus contributing to the evolution of RSSD. Lesser kestrels are known to hunt for their mainly insect prey either from a perch or from the air. However, the prevalence of aerial hunting was observed in the study area, mainly due to a shortage of suitable perch sites for hunting (Vlachos et al. Citation2003). RSSD observed in the studied population might be partly attributed to females preferring to mate with smaller males, which are more efficient in the prevalent aerial hunting, lending support to the sexual selection hypothesis.
Tarsus and bill lengths appear to level off during the pre-fledging stage and are well described by logistic growth curves. The higher tarsus length of Greek nestlings compared with adult measurements reported by Cramp and Simmons (Citation1980) might suggest differences among populations. On the other hand, bill length was similar between nestlings and adults. In line with this study, the reported RSSD in adult lesser kestrels was also low, with females having 1% longer tarsi and similar bills compared to males. These comparisons indicated that tarsus and bill length have attained adult size by the age of 28 days. In contrast, total length continued its linear growth, and the point at which asymptotic values are achieved is not known. Greek nestlings averaged 24 cm at the age of 28 days, being 75–83% of the adult size of 29–32 cm reported by Cramp and Simmons (Citation1980). Dijkstra et al. (Citation1990) found that wing length also grew linearly in the Eurasian Kestrel, being at fledging 75% of the final length, which was reached 20 days after fledging. Further investigations are needed to determine to what degree the development of tail feathers contributes to total length growth patterns.
The growth in body mass of Greek nestlings (see ) was similar, in both size and variation, to that of Portuguese (cf. fig. S2 in Catry et al. Citation2012) and Spanish nestlings during bad foraging conditions (cf. fig. 3, bottom graph, in Rodríguez et al. Citation2006). In contrast to body mass growth, bill and tarsus asymptotic lengths approached adult sizes (Cramp & Simmons Citation1980). Rodríguez et al. (Citation2006) found that, in Spanish lesser kestrel colonies, more and heavier nestlings were produced in years with good foraging conditions than in years with bad foraging conditions. Negro et al. (Citation1994) found that captive nestling American kestrels suffered significant weight loss after food deprivation, whereas tarsus and bill lengths were not affected. These findings agree with Moe et al.’s (2004) suggestion that body mass is more sensitive than structural measurements to variations in food availability.
This study described for the first time the growth patterns of nestling lesser kestrels in central Greece. By using nonlinear mixed models, random and fixed effects were accounted for. Results provided important new information and offered insights into lesser kestrel postnatal growth patterns. They could therefore prove critical for the better understanding of population dynamics and as an aid in the conservation of fragile local populations. Avian growth data can be also used for the assessment of variation between populations in different geographical areas and for the detection of changes in local environmental conditions, and as such current research could be useful for future comparisons.
Supplemental data
Supplemental data for this article can be accessed here.
Related Research Data
References
- Akaike H. 1973. Information theory and an extension of the maximum likelihood principle. In: Petrov BN, Csáki F, editors. Proceedings 2nd International Symposium on Information Theory, 2–8 September 1971, Tsahkadsor, Armenia, USSR. Budapest: Akadémiai Kiadó. pp. 267–281.
- Aparicio JM. 1997. Costs and benefits of surplus offspring in the lesser kestrel Falco naumanni. Behavioral Ecology and Sociobiology 41:129–137. DOI:10.1007/s002650050372.
- Aparicio JM, Cordero PJ. 2001. The effects of the minimum threshold condition for breeding on offspring sex-ratio adjustment in the lesser kestrel. Evolution 55:1188–1197. DOI:10.1111/evo.2001.55.issue-6.
- Bakaloudis DE. 2012. A preliminary overview of monitoring for raptors in Greece. Acrocephalus 33:293–295.
- Becker PH, Wink M. 2003. Influences of sex, sex composition of brood and hatching order on mass growth in common terns Sterna hirundo. Behavioral Ecology and Sociobiology 54:136–146.
- Biber JP. 1996. Action plan for the conservation of lesser kestrel. In: Heredia B, Rose L, Painter M, editors. Globally threatened birds in Europe. Action plans. Brussels: Council of Europe. pp. 191–204.
- BirdLife International. 2015. Species factsheet: Falco naumanni. Available: http://www.birdlife.org. Accessed Aug 2016 15.
- Bolker BM. 2008. Ecological models and data in R. Princeton: Princeton University Press.
- Bolker BM. 2015. emdbook: Ecological models and data in R. R package version 1.3.8.
- Burnham KP, Anderson DR. 2002. Model selection and multimodel inference: A practical information-theoretic approach. 2nd ed. New York: Springer.
- Bustamante J, Negro JJ. 1994. The post fledgling dependence period of the lesser kestrel in southwestern Spain. Journal of Raptor Research 28:158–163.
- Campobello D, Sarà M, Hare JF. 2012. Under my wing: Lesser kestrels and jackdaws derive reciprocal benefits in mixed species colonies. Behavioral Ecology 23:425–433. DOI:10.1093/beheco/arr207.
- Catry I, Amano T, Franco AMA, Sutherland WJ. 2012. Influence of spatial and temporal dynamics of agricultural practices on the lesser kestrel. Journal of Applied Ecology 49:99–108. DOI:10.1111/j.1365-2664.2011.02071.x.
- Catry I, Catry T, Alho M, Franco AMA, Moreira F. 2016. Sexual and parent–offspring dietary segregation in a colonial raptor as revealed by stable isotopes. Journal of Zoology 299:58–67. DOI:10.1111/jzo.12324.
- Catry I, Franco AMA, Sutherland WJ. 2011. Adapting conservation efforts to face climate change: Modifying nest-site provisioning for lesser kestrels. Biological Conservation 144:1111–1119. DOI:10.1016/j.biocon.2010.12.030.
- Choisy M, Conteau C, Lepley M, Manceau N, Yau G. 1999. Lesser kestrel Falco naumanni diet and feeding behaviour in Crau during the prenuptial period. Alauda 67:109–118.
- Cramp S, Simmons KEL. 1980. Handbook of the birds of Europe, the middle east and north Africa. Oxford: Oxford University Press.
- Di Maggio R, Campobello D, Sarà M. 2013. Nest aggregation and reproductive synchrony promote lesser kestrel Falco naumanni seasonal fitness. Journal of Ornithology 154:901–910. DOI:10.1007/s10336-013-0954-3.
- Di Maggio R, Campobello D, Tavecchia G, Sarà M. 2016. Habitat- and density-dependent demography of a colonial raptor in Mediterranean agro-ecosystems. Biological Conservation 193:116–123. DOI:10.1016/j.biocon.2015.11.016.
- Di Maggio R, Mengoni C, Mucci N, Campobello D, Randi E, Sarà M. 2015. Do not disturb the family: Roles of colony size and human disturbance in the genetic structure of lesser kestrel. Journal of Zoology 295:108–115. DOI:10.1111/jzo.2015.295.issue-2.
- Diggle PJ, Heagerty P, Liang K-Y, Zeger SL. 2002. Analysis of longitudinal data. Oxford Statistical Science Series 25. 2nd ed. Oxford: Oxford University Press.
- Dijkstra C, Bult A, Bijlsma S, Daan S, Meijer T, Zijlstra M. 1990. Brood size manipulations in the kestrel (Falco tinnunculus): Effects on offspring and parent survival. The Journal of Animal Ecology 59:269–285. DOI:10.2307/5172.
- Donázar JA, Negro JJ, Hiraldo F. 1992. Functional analysis of mate-feeding in the lesser kestrel Falco naumanni. Ornis Scandinavica 23:190–194. DOI:10.2307/3676448.
- Donázar JA, Negro JJ, Hiraldo F. 1993. Foraging habitat selection, land-use changes and population decline in the lesser kestrel. Journal of Applied Ecology 30:515–522. DOI:10.2307/2404191.
- Earhart CM, Johnson NK. 1970. Size dimorphism and food habits of North American owls. Condor 72:251–264. DOI:10.2307/1366002.
- Franco AMA, Marques JT, Sutherland WJ. 2005. Is nest-site availability limiting lesser kestrel populations? A multiple-scale approach. Ibis 147:657–666. DOI:10.1111/j.1474-919x.2005.00437.x.
- Franco AMA, Palmeirim JM, Sutherland WJ. 2004. Modelling the foraging habitat selection of lesser kestrels: Conservation implications of European agricultural policies. Biological Conservation 120:63–74. DOI:10.1016/j.biocon.2004.01.026.
- Gebhardt-Henrich S, Richner H. 1998. Causes of growth variation and its consequences for fitness. In: Starck JM, Ricklefs RE, editors. Avian growth and development: Evolution within the Altricial-Precocial Spectrum. Oxford: Oxford University Press. pp. 324–339.
- Goutner V, Bakaloudis DE, Papakosta MA, Vlachos CG, Mattig FR, Pijanowska U, Becker PH. 2015. Organochlorine and mercury residues in eggs of the lesser kestrel Falco naumanni from a long term study in the eastern Mediterranean. Environmental Pollution 207:196–204. DOI:10.1016/j.envpol.2015.09.021.
- Hakkarainen H, Huhta E, Lahti H, Lundvall P, Mappes T, Tolonen P, Wiehn J. 1996. A test of male mating and hunting success in the kestrel: Advantages of smallness? Behavioral Ecology and Sociobiology 39:375–380. DOI:10.1007/s002650050303.
- Iñigo A, Barov B. 2010. Action plan for the lesser kestrel Falco naumanni in the European Union. SEO|BirdLife and BirdLife International for the European Commission.
- Kalmbach E, Griffiths R, Furness RW. 2009. Sex-specific growth patterns and effects of hatching condition on growth in the reversed sexually size-dimorphic great skua Stercorarius skua. Journal of Avian Biology 40:358–368. DOI:10.1111/jav.2009.40.issue-4.
- Krebs EA. 1999. Last but not least: Nestling growth and survival in asynchronously hatching crimson rosellas. Journal of Animal Ecology 68:266–281. DOI:10.1046/j.1365-2656.1999.00284.x.
- Lepley M, Brun L, Foucart A, Pilard P. 2000. Régime et comportement alimentaires du faucon crecerellette Falco naumanni en Crau en période de reproduction et postreproduction. Alauda 68:177–184.
- Lok T, Overdijk O, Piersma T. 2014. Interpreting variation in growth of Eurasian spoonbill chicks: Disentangling the effects of age, sex and environment. Ardea 102:181–194. DOI:10.5253/arde.v102i2.a8.
- Martin TE. 1987. Food as a limit on breeding birds: A life-history perspective. Annual Review of Ecology and Systematics 18:453–487. DOI:10.1146/annurev.es.18.110187.002321.
- Mihoub JB, Mouawad NG, Pilard P, Jiguet F, Low M, Teplitsky C. 2012. Impact of temperature on the breeding performance and selection patterns in lesser kestrels Falco naumanni. Journal of Avian Biology 43:472–480. DOI:10.1111/jav.2012.43.issue-5.
- Moe B, Brunvoll S, Mork D, Brobakk TE, Bech C. 2004. Developmental plasticity of physiology and morphology in diet-restricted European shag nestlings Phalacrocorax aristotelis. Journal of Experimental Biology 207:4067–4076. DOI:10.1242/jeb.01226.
- Motulsky H, Christopoulos A. 2004. Fitting models to biological data using linear and nonlinear regression. Oxford: Oxford University Press.
- Negro JJ, Chastin A, Bird D. 1994. Effects of short-term food deprivation on growth of hand-reared American kestrels. Condor 96:749–760. DOI:10.2307/1369478.
- Negro JJ, Hiraldo F. 1992. Sex ratios in broods of the lesser kestrel, Falco naumanni. Ibis 134:190–191.
- Newton I. 1986. The Sparrowhawk. Calton: Poyser.
- Ortego J, Cordero PJ, Aparicio JM, Calabuig G. 2010. Parental genetic characteristics and hatching success in a recovering population of lesser kestrels. Journal of Ornithology 151:155–162. DOI:10.1007/s10336-009-0438-7.
- Pinheiro J, Bates D, DebRoy S, Sarkar D, The R Development Core Team. 2014. nlme: Linear and nonlinear mixed effects models. R package version 3.1-117.
- Pinheiro JC, Bates DM. 2000. Mixed-effects models in S and S-plus. New York: Springer.
- Prugnolle F, Pilard P, Brun L, Tavecchia G. 2003. First-year and adult survival of the endangered lesser kestrel Falco naumanni in southern France. Bird Study 50:68–72. DOI:10.1080/00063650309461292.
- R Development Core Team. 2014. R: A language and environment for statistical computing. Vienna: R Foundation for Statistical Computing. Available: http://www.R-project.org. Accessed Aug 2016 15.
- Ricklefs RE. 1968. Patterns of growth in birds. Ibis 110:419–451. DOI:10.1111/j.1474-919X.1968.tb00058.x.
- Ricklefs RE. 1973. Patterns of growth in birds. II. Growth rate and mode of development. Ibis 115:177–201. DOI:10.1111/j.1474-919X.1973.tb02636.x.
- Ricklefs RE. 1983. Avian postnatal development. In: Farner DS, King JR, Parkes KC, editors. Avian biology. Vol. 7. London: Academic. pp. 1–83.
- Rodríguez C, Johst K, Bustamante J. 2006. How do crop types influence breeding success in lesser kestrels through prey quality and availability? A modelling approach. Journal of Applied Ecology 43:587–597. DOI:10.1111/j.1365-2664.2006.01152.x.
- Sarà M, Campobello D, Zanca L. 2012. Effects of nest and colony features on Lesser Kestrel (Falco naumanni) reproductive success. Avian Biology Research 5:209–217. DOI:10.3184/175815512X13535044854571.
- Serrano D, Tella JL, Ursua E. 2005. Proximate causes and fitness consequences of hatching failure in lesser kestrels Falco naumanni. Journal of Avian Biology 36:242–250. DOI:10.1111/j.0908-8857.2005.03395.x.
- Sofaer HR, Chapman PL, Sillett TS, Ghalambor CK. 2013. Advantages of nonlinear mixed models for fitting avian growth curves. Journal of Avian Biology 44:469–478.
- Starck JM, Ricklefs RE. 1998. Patterns of development: The Altricial-Precocial Spectrum. In: Starck JM, Ricklefs RE, editors. Avian growth and development: Evolution within the Altricial-Precocial Spectrum. Oxford: Oxford University Press. pp. 3–30.
- Trivers RL. 1972. Parental investment and sexual selection. In: Campbell B, editor. Sexual selection and the descent of man, 1871–1971. Chicago: Aldine-Atherton. pp. 139–179.
- Velando A, Graves J, Freire J. 2000. Sex-specific growth in the European shag Stictocarbo aristotelis, a sexually dimorphic species. Ardea 88:127–136.
- Vlachos C, Bakaloudis D, Chatzinikos E. 2004a. Status of the lesser kestrel Falco naumanni in Thessaly, central Greece. In: Chancellor RD, Meyburg B-U, editors. Raptors worldwide. Berlin and Budapest: World Working Group on Birds of Prey/MME-Birdlife. pp. 731–736.
- Vlachos C, Bakaloudis D, Chatzinikos E. 2004b. Unusual nesting of the lesser kestrel Falco naumanni in Thessaly, Greece. Journal of Raptor Research 38:161–163.
- Vlachos C, Bakaloudis D, Chatzinikos E, Papadopoulos T, Tsalagas D. 2003. Aerial hunting behaviour of the lesser kestrel Falco naumanni during the breeding season in Thessaly (Greece). Acta Ornithologica 38:47–52. DOI:10.3161/068.038.0210.
- Vlachos CG, Bakaloudis DE, Kitikidou K, Goutner V, Bontzorlos V, Papakosta MA, Chatzinikos E. 2015. Home range and foraging habitat selection by breeding lesser kestrels Falco naumanni in Greece. Journal of Natural History 49:371–381. DOI:10.1080/00222933.2013.825022.
- Zuur AF, Ieno EN, Walker N, Saveliev AA, Smith GM. 2009. Mixed effects models and extensions in ecology with R. New York: Springer.