
Abstract
Animals employ various strategies to adapt to different natural habitats. In order to investigate the relationship between thermogenesis of adipose tissue and seasonal variations in Tupaia belangeri, body mass, food intake, adipose tissue morphology, and expression levels of three adipose differentiation-related genes – peroxisome proliferators-activated receptor α (PPARα), cyclooxygenase-2 (COX-2) and peroxisome proliferator-activated receptor γ coactivator 1-α (PGC-1α) – were measured in the present study. The results show that body mass and food intake increased significantly in winter compared with summer. White adipose tissue (WAT) in winter demonstrated the characteristic appearance of beige adipocytes, including smaller and multi-chamber lipid droplets, darker hue, and increased expression levels of COX-2 and PGC-1α genes, which would increase thermogenic properties in T. belangeri to make up for the lack of thermogenesis in nonshivering thermogenesis (NST) caused by brown adipose tissue (BAT). Moreover, analysis of BAT morphology showed smaller lipid droplets, and COX-2 and PPARα gene expression in BAT increased significantly in winter, indicating that uncoupling protein 1 (UCP1) had been activated to increase NST. All of these results suggest that T. belangeri enhanced thermogenic capacity in winter, including WAT undergoing “browning” and enhanced NST in BAT, which played important roles in the strategies of thermal physiology and bioenergetics in T. belangeri during seasonal change.
Introduction
Small mammals living in different habitats are affected by various ecological factors, such as photoperiod, food quantity or quality, ambient temperature, etc. In order to adapt to changeable climate conditions, small mammals have evolved strategies in physiology, behavior and morphology for survival (Jackson et al. Citation2001; Zhu et al. Citation2017b). Many animals face food resource scarcity and lower temperature in winter; they usually increase thermogenic capacity to improve their ability to resist environmental stress (Zhang et al. Citation2017).
To cope with winter or cold conditions, small mammals always enhance nonshivering thermogenesis (NST), and the major site of its occurrence is brown adipose tissue (BAT). Long-term cold exposure also leads to “browning” in white adipose tissue (WAT), which produces BAT-like properties (Peschechera & Eckel Citation2013), and transcriptional activation of many genes involved in lipid catabolism (Christian Citation2005; Kim et al. Citation2017). In the past, mammalian adipose tissues were mainly divided into WAT and BAT, but in recent years another adipose tissue was found, which is induced from WAT, called “beige adipose tissue” (Wang et al. Citation2014). White adipocytes, which have larger lipid droplets, and store energy in the form of triacylglycerol, secrete hormones and cytokines to regulate energy metabolism (Nedergaard et al. Citation2007); brown adipocytes, which have smaller lipid droplets and richer mitochondria, mediated by uncoupling protein 1 (UCP1), are involved in NST response (Cannon & Nedergaard Citation2004). The morphology of beige adipocytes is similar to that of brown adipocytes, but have higher expression of UCP1 under cold acclimation or hormone stimulation, so they are also called “brown-like adipocytes” (Harms & Seale Citation2013).
Peroxisome proliferators-activated receptor α (PPARα) is a major transcriptional regulator of the fatty acid oxidase gene, which is expressed abundantly in brown adipocytes and maintains normal lipid and energy metabolism (Corton et al. Citation2018; Yang et al. Citation2018). PPARα is also a coactivator of peroxisome proliferator-activated receptor γ (PPARγ), which can promote the formation of BAT (Komatsu et al. Citation2010). Cyclooxygenase-2 (COX-2) is a protein encoded by mitochondria, an important component of the oxidative phosphorylation pathway, which plays an important role in the formation of brown adipocytes (Aguirre et al. Citation2017). Peroxisome proliferator-activated receptor γ coactivator 1-α (PGC-1α) is a coenzyme factor of PPARγ (Puigserver Citation1998; Cappello et al. Citation2018) which can increase energy consumption of BAT and is a major regulator of transcription factors involved in cell metabolism (Chen et al. Citation2016). Previous studies have shown that plateau pika (Ochotona curzoniae) increase thermogenesis by browning in subcutaneous WAT and increasing BAT mass to adapt to cold temperatures, and the expressions of UCP1 and PCG-1a are up-regulated in this process (Li et al. Citation2018). Results found by our group also showed that increasing PPARα, COX-2 and PGC-1a gene expression in Tupaia belangeri could induce WAT browning and increase the UCP1 content in BAT (Hou et al. Citation2017).
The tree shrew Tupaia belangeri (Wagner Citation1841) (Mammalia: Scandentia: Tupaiidae), a squirrel-like lower primate, is a unique Oriental species, commonly used as a new but promising animal model in biomedical research (Wagner Citation1841; Wu et al. Citation2013). It inhabits tropical rain forests, secondary forests and mountain forests, and feeds on insects and sweet fruits (Zhu et al. Citation2017a). It is widely used in medicine and biology because of its close relationship with primates, fast reproduction and low feeding cost (Zhang et al. Citation2017). In a previous study (Hou et al. Citation2017), we explored the changes of adipose tissue of T. belangeri during seasonal variations at individual, tissue and molecular levels, and laid a foundation for establishing an energy homeostasis maintenance mechanism and survival adaptation model of T. belangeri.
Materials and methods
Animals and experimental design
Tree shrews Tupaia belangeri were captured at the boscage of Luquan County (25°25ʹ–26°22ʹ N, 102°13ʹ–102°57ʹ E, at 1679 m altitude), Yunnan Province, China, and maintained at the School of Life Sciences, Yunnan Normal University, Kunming (1910 m altitude). All animals were healthy adults, and were housed individually in wire cages (40 cm × 40 cm × 40 cm); water with vitamins was provided ad libitum. The cage environment was maintained on a 12L:12D cycle (lights on at 08:00), 25 ± 1°C, and 65–92% relative humidity. The shrews were fed a food mixture containing 25.0% crude protein, 6.3% crude fat, 4.6% crude fiber, 7.4% ash, and 0.96 kJ/g gross energy, as well as apples, pears and other fruits twice weekly (Zhang et al. Citation2017).
A total of 32 adult tree shrews were wild-captured in June, September and December 2017, and March 2018 (hereafter referred to as the summer, autumn, winter and spring groups, respectively), omitting pregnant or lactating individuals, and used in the present study (summer, n = 8; autumn, n = 8; winter, n = 8; spring, n = 8; each group included 3–5 females and 3–5 males). After measurement of food intake, animals were sacrificed by puncture of the posterior vena cava within 4 days after capture, and WAT and BAT samples were taken for measurement of physiological parameters (Wang et al. Citation2006). All animal procedures were compliant with the Animal Care and Use Committee of the School of Life Science, Yunnan Normal University. The study was approved by this Committee (13–0901–011).
Food intake
Food intake was measured by food equity (Rosenmann & Morrison Citation1974). Each animal was put in a metabolic cage (20 cm × 15 cm × 15 cm) with no nest materials, and fed a food mixture. Animals were fed a fixed quantity at a set time (9.5–10.5 g, 11:00 am), and the next day body mass was assessed, and residual food collected. Residual food was dried in a vacuum dryer until the mass was constant.
Histomorphological study
WAT and BAT samples (0.5 cm3) were prepared for histological examination as previously described (Tomaszewska et al. Citation2014), except for samples that were cut into 4-μm sections and stained with haematoxylin and eosin (HE), and Masson’s trichrome method (MT). Microscopic (two-dimensional) images were collected using an AXIOVERT 200M microscope (Carl Zeiss, Germany), equipped with an AxioCam HRc camera (Carl Zeiss, Germany). The structure of WAT and BAT was examined under the microscope and the images collected were analyzed using the graphical analysis software CellSens Olympus Version 1.5 (OLYMPUS, Japan).
Quantitative real time polymerase chain reaction (qRT-PCR) assay of PPARα, COX-2 and PGC-1α
qRT-PCR was used to assay expressions of PPARα, COX-2 and PGC-1α. Species-specific primer sets for PPARα, COX-2 and PGC-1α, and beta-actin in tree shrews were designed according to reference gene sequences (Hou et al. Citation2017).
Total RNA was isolated from WAT and BAT using the TRIzol Kit (Invitrogen, Carlsbad, CA, USA) according to the manufacturer protocols. To remove any contaminants, DNA and RNA samples were treated with DNase I (Promega, USA) for 30 min at 37°C, followed by another cycle of TRIzol extraction to eliminate residual DNase I. An equal amount (3 μg) of total RNA for each sample was transcribed into first strand cDNA using M-MLV First Strand Kit (Invitrogen, Carlsbad, CA, USA) according to the manufacturer instructions.
Primers set for beta-actin and three transforming genes were designed for real-time PCR (). Real-time PCR was completed using the SYBR Green I qPCR kit (TaKaRa Bio, Dalian, China) in the Mx3000P quantitative PCR system (Stratagene, La Jolla, CA, USA). qRT-PCR was carried out in 12.5 μL reaction agent comprised of 6.25 μL 2 SYBR Premix EX Taq master mix, 1 μL cDNA and 0.25 μL of each primer (10 umol/L). Thermal cycling conditions were: 95°C for 20 s, 35 cycles of 95°C for 20 s, 56°C for 50 s, and 72°C for 90 s, then 72°C for 10 min. Melting curve analysis showed a single PCR product after amplification of three hypothalamic genes and beta-actin, and end products of PCR were further confirmed by DNA sequencing. We constructed standard curves for each gene via serial dilutions of cDNA (2-fold dilutions). Analysis of standard curves between target genes and beta-actin showed that they had similar amplification efficiency, which ensures the validity of the comparative quantity method. The data derived from the Mx3000P quantitative software were expressed as relative amounts. Gene expression was calculated by the 2−ΔΔCt method (Zhang et al. Citation2017).
Table I. Primers for polymerase chain reaction (PCR) amplification of each gene studied of Tupaia belangeri.
Statistical analysis
Data were analyzed using SPSS 16.0 software (SPSS Inc., Chicago, IL, USA). Prior to all statistical analyses, data were examined for assumptions of normality and homogeneity of variance using the Kolmogorov–Smirnov and Levene tests, respectively. Seasonal variations in factors such as body mass, food intake, and expressions of PPARα, COX-2 and PGC-1α were analyzed using one-way analysis of variance (ANOVA). Differences among groups were detected using Duncan’s multiple range test. Results are presented as mean ± Standard Error of Mean (SME) (n sample size) in the test, and P < 0.05 was considered as statistically significant.
Results
Body mass and food intake
Body mass and food intake showed significant seasonal differences in tree shrews (body mass: F1,30 = 32.989, P < 0.01; food intake: F1,30 = 11.334, P < 0.01), which were significantly higher in winter than in summer, but there were no significant differences between spring and autumn. The body mass of tree shrews in winter was 31.01% higher than that in summer, and food intake in winter was 32.58% higher than that in summer ().
Table II. Seasonal changes of body mass and food intake in Tupaia belangeri.
Adipose tissue morphology
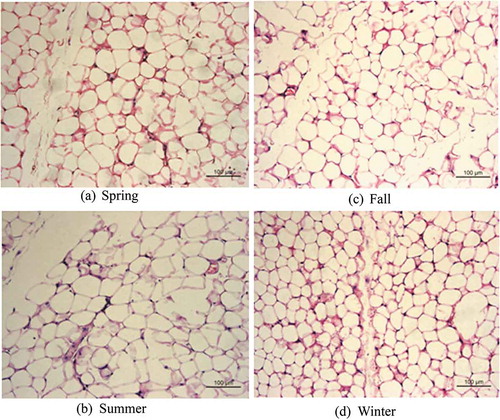
In winter, the multi-chamber adipocytes with smaller lipid droplets were differentiated from white adipocytes compared with those in summer; the intercellular space increased and the color darkened. White adipocytes showed no significant differences between spring and autumn ( and )). The white adipocytes of tree shrew in winter and summer showed significant differences in morphology: they were larger in summer, and were single-chamber fat droplets ( and )). The brown adipocytes of the tree shrew showed similar size and cell morphology in spring and autumn ( and )); the cell diameter was the largest and the arrangement was loosest in summer ()), whereas the cell diameter was the smallest, the number of cells was the largest and the arrangement was tightest in winter, and the cell diameter around the blood vessels was obviously smaller in winter than in the other three seasons ()).
Figure 1. Morphological study of seasonal variation in white adipose tissue in Tupaia belangeri.
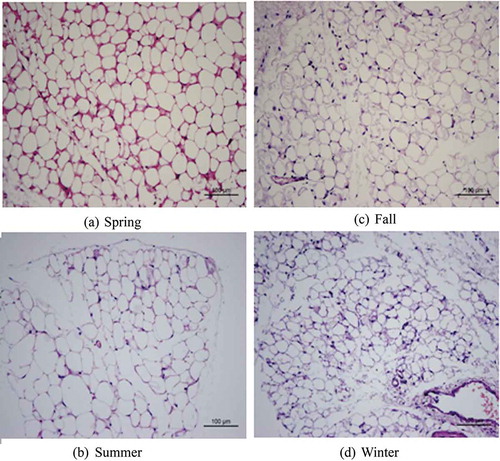
Figure 2. Morphological study of seasonal variation in brown adipose tissue in Tupaia belangeri.
PPARα, COX-2, PGC-1α gene expressions
Expression of the COX-2 gene in WAT of tree shrew was significantly higher in winter than in spring, summer and autumn (F1,30 = 18.857, P < 0.01, )). Expression of the PGC-1α gene was the highest in winter, significantly higher than in summer, and PGC-1α gene expression showed significant differences during the four seasons (F1,30 = 4.368, P < 0.05, )); but the expression of PPARα showed no significant seasonal variation (F1,30 = 0.142, P < 0.05, )).
Figure 3. Seasonal expression levels of the (a) cyclooxygenase-2 (COX-2), (b) peroxisome proliferator-activated receptor γ coactivator 1-α (PGC-1α), and (c) peroxisome proliferators-activated receptor α (PPARα) genes of white adipose tissue in Tupaia belangeri. Data are expressed as mean ± standard error; values not sharing a common letter are significantly different (P < 0.05).
Expression of COX-2 gene in BAT of tree shrew in autumn and winter was significantly higher than that in spring and summer (F1,30 = 20.435, P < 0.01, )); expression of the PGC-1α gene was not significantly different between seasons (F1,30 = 0.808, P > 0.05, )); and expression of the PPARα gene in spring and winter was significantly higher than in summer (F1,30 = 3.574, P < 0.05, )).
Figure 4. Seasonal expression levels of the (a) cyclooxygenase-2 (COX-2), (b) peroxisome proliferator-activated receptor γ coactivator 1-α (PGC-1α), and (c) peroxisome proliferators-activated receptor α (PPARα) genes of brown adipose tissue in Tupaia belangeri. Data are expressed as mean ± standard error; values not sharing a common letter are significantly different (P < 0.05).
Discussion
Different animals adopt different survival strategies when adapting to environmental changes. Seasonal variations of body mass of tree shrews are different from that of Eothenomys olitor (Zhu & Wang Citation2015), E. miletus (Zhu et al. Citation2014) and Apodemus chevrieri (Zhu et al. Citation2012). For example, body mass is higher in winter, which may be related to the environmental resources of their habitats: tree shrews often live in the tropics, subtropics and plateau areas. Even in winter, food resources are relatively abundant, and energy consumption can be satisfied by increasing food intake. Therefore, food intake of tree shrews in winter was higher than that in summer in the present study, which was consistent with the previous study (Zhang et al. Citation2017). The increase of body mass in tree shrews in winter may be partly because of the increasing of adipose tissue mass (Hou et al. Citation2017). Adipose tissue plays an important role in the regulation of energy homeostasis in small mammals (Carobbio et al. Citation2013). When animals are in a lower temperature environment, WAT may possibly transform into beige adipose tissue, which can promote the formation of beige and brown adipocytes in order to increase NST to adapt to cold conditions in winter (Nedergaard et al. Citation2007). Morphological analysis of HE-stained samples from tree shrews in the present study found that WAT increased the number of cells and decreased the fat droplets in winter, indicating that WAT undergoes “browning”, thereby increasing the content of UCP1 and promoting NST; fat droplets of white adipocytes were significantly smaller and color became darker in winter than in summer. Similar results were observed for BAT morphology, possibly because of an increase in mitochondria. The results are consistent with the previous results of our group found under cold exposure (Sun et al. Citation2015), indicating that WAT might be browning and beige fat cells were differentiated (Gburcik et al. Citation2012).
Beige adipocytes and brown adipocytes are heat-producing cells in WAT and BAT, respectively (Jonathan Citation2017). Studies have shown that beige adipocytes have similar or even higher thermogenic capacity compared with brown adipocytes under specific physiological conditions or drug stimulation (Toselli et al. Citation2010). Therefore, how to effectively induce WAT “browning” to produce beige adipose tissue, consume WAT to increase thermogenic capacity in animals, and prevent obesity caused by excessive accumulation of WAT have become the focus of current studies (Frühbeck et al. Citation2009; Okamatsuogura et al. Citation2017). Many studies have shown that in cold temperatures, β-adrenergic receptor agonist stimulation, which was involved in thermogenesis during exercise, or even intestinal microbes may induce the formation of beige adipocytes in WAT (Carey et al. Citation2014). PPARα is a unique link between lipid metabolism and immune function, which plays an important role in inflammatory reaction (Hines et al. Citation2018). Therefore, some effector molecules produced by immune cells in WAT and BAT and their regulation of the development and proliferation of beige and brown adipocytes (Brestoff & Artis Citation2015; DiSpirito & Mathis Citation2015), and activation of beige adipocytes in vitro, have become current research directions (Steinbring et al. Citation2017). Expression of UCP1 in WAT is dependent on the activation of COX-2 (Lau et al. Citation2013). PGC-1α is a key auxiliary activator for brown adipogenesis and mitochondrial biogenesis, and is also involved in the browning process of WAT (Finck & Kelly Citation2006). Expression levels of PPARα, COX-2 and PGC-1α genes were measured to study whether WAT of tree shrew had “browning” at the molecular level. The results show that expressions of COX-2 and PGC-1α genes in WAT of tree shrews were higher in winter than in summer, indicating that “browning” may occur in WAT. The reason why PPARα gene expression did not display significant differences across the four seasons may be that PPARα mainly exists in organs of catabolism and gluconeogenesis, and it was abundantly expressed in brown adipocytes (Nedergaard et al. Citation2005). In the process of promoting UCP1 expression by PPARα, the participation of PGC-1α is required (Seale Citation2015). Therefore, up-regulation of PGC-1α induces UCP1 expression. The expression level of the PGC-1α gene in WAT was lower than that in BAT, which could distinguish beige fat and brown fat after cold acclimation (Harms & Seale Citation2013). PGC-1α gene expression in BAT in autumn (0.95 ± 0.17) was higher than that in WAT (0.92 ± 0.09), which indicates that WAT began to differentiate into beige fat cells in autumn in response to the lower temperatures as winter approached. In winter, the expression of PGC-1α in WAT and BAT was higher, which suggests that the beige adipocytes and brown adipocytes might coexist in adipose tissue.
Expression levels of PPARα and COX-2 genes in BAT of tree shrews were higher in winter than in summer in the current study. The difference in PGC-1α gene expression between summer and winter was not significant, which suggests that BAT can develop normally without PGC-1α because of the supplementation of PGC-1β expression and that of related genes (Bellafante et al. Citation2013; Maisano et al. Citation2016). The up-regulation of PPARα gene expression induced a proliferation of primary BAT cells and higher expression of UCP1 (Komatsu et al. Citation2010), thereby enhancing the oxidative capacity of BAT and increasing expression of COX-2 (Aguirre et al. Citation2017). Expression levels of PPARα and COX-2 genes in winter were significantly higher than in summer, which indicates that they can increase the content of UCP1 to increase NST in winter.
In conclusion, tree shrews could produce beige adipocytes by inducing “browning” of WAT, and increased UCP1 expression to compensate for the deficiency of NST induced by BAT in winter. BAT, in turn, could differentiate more brown adipocytes to increase the activity of UCP1 and enhanced NST to resist cold temperatures in winter.
Acknowledgements
We wish to thank Prof. Burkart Engesser at Historisches Museum Basel, Switzerland, for correcting the English usage in the draft. Thank you to the anonymous reviewers and the editor of the journal for their valuable comments.
Disclosure statement
No potential conflict of interest was reported by the authors.
Additional information
Funding
References
- Aguirre L, Miltonlaskibar I, Hijona E, Bujanda L, Rimando AM, Portillo MP. 2017. Effects of pterostilbene in brown adipose tissue from obese rats. Journal of Physiology & Biochemistry 73:1–8.
- Bellafante E, Murzilli S, Salvatore L, Latorre D, Villani G, Moschetta A. 2013. Hepatic-specific activation of peroxisome proliferator-activated receptorgamma coactivator-1beta protects against steatohepatitis. Hepatology 57:1343–1356. DOI:10.1002/hep.26222.
- Brestoff JR, Artis D. 2015. Immune regulation of metabolic homeostasis in health and disease. Cell 161:146–160. DOI:10.1016/j.cell.2015.02.022.
- Cannon B, Nedergaard J. 2004. Brown adipose tissue: Function and physiological significance. Physiological Reviews 84:277–359.
- Cappello T, Giannetto A, Parrino V, De MG, Mauceri A, Maisano M. 2018. Food safety using NMR-based metabolomics: Assessment of the Atlantic bluefin tuna, Thunnus thynnus, from the Mediterranean Sea. Food and Chemical Toxicology 115: 391–397. DOI:10.1016/j.fct.2018.03.038.
- Carey AL, Vorlander C, Reddyluthmoodoo M, Natoli AK, Formosa MF, Bertovic DA. 2014. Reduced ucp-1 content in in vitro differentiated beige/brite adipocytes derived from preadipocytes of human subcutaneous white adipose tissues in obesity. PloS one 9: e91997. DOI:10.1371/journal.pone.0091997.
- Carobbio S, Rosen B, Vidal-Puig A. 2013. Adipogenesis: New insights into brown adipose tissue differentiation. Journal of Molecular Endocrinology 51:E1–3. DOI:10.1530/JME-13-0158.
- Chen YY, Yan Y, Zhao Z, Shi MJ, Zhang YB. 2016. Bofutsushosan ameliorates obesity in mice through modulating PGC-1α expression in brown adipose tissues and inhibiting inflammation in white adipose tissues. Chinese Journal of Natural Medicines 14:449–456. DOI:10.1016/S1875-5364(16)30084-X.
- Christian M. 2005. Transcriptional fingerprinting of “browning” white fat identifies NRG4 as a novel adipokine. Adipocyte 4:50–54. DOI:10.4161/adip.29853.
- Corton JC, Peters JM, Klaunig JE. 2018. The PPARα-dependent rodent liver tumor response is not relevant to humans: Addressing misconceptions. Archives of Toxicology 92:83–119.
- DiSpirito JR, Mathis D. 2015. Immunological contributions to adipose tissue homeostasis. Seminars in Immunology 27:315–321. DOI:10.1016/j.smim.2015.10.005.
- Finck BN, Kelly DP. 2006. PGC-1 coactivators: Inducible regulators of energy metabolism in health and disease. Journal of Clinical Investigation 116:615–622. DOI:10.1172/JCI27794.
- Frühbeck G, Becerril S, Sáinz N, Garrastachu P, Garcíavelloso MJ. 2009. BAT: A new target for human obesity? Trends in Pharmacological Sciences 30:387–396. DOI:10.1016/j.tips.2009.05.003.
- Gburcik V, Cawthorn WP, Nedergaard J, Timmons JA, Cannon B. 2012. An essential role for Tbx15 in the differentiation of brown and “brite” but not white adipocytes. American Journal of Physiology Endocrinology and Metabolism 303:e1053. DOI:10.1152/ajpendo.00104.2012.
- Harms M, Seale P. 2013. Brown and beige fat: Development, function and therapeutic potential. Nature Medicine 19:1252–1263. DOI:10.1038/nm.3361.
- Hines IN, Kremer M, Moore SM, Wheeler MD. 2018. Impaired T cell-mediated hepatitis in per- oxisome proliferator activated receptor alpha (PPARα)-defcient mice. Biological Research 51:5. DOI:10.1186/s40659-018-0176-5.
- Hou DM, Zhang D, Yu TT, Wang ZK, Gao WR, Zhu WL. 2017. Effect of cold exposure on the expressions of PPARα, COXII and PGC-1α in Tupaia belangeri. Schuan Journal of Zoology 36:34–38.
- Jackson DM, Trayhurn P, Speakman JR. 2001. Associations between energetics and over-winter survival in the short-tailed field vole Microtus agrestis. Journal of Animal Ecology 70:633–640. DOI:10.1046/j.1365-2656.2001.00518.x.
- Jonathan RB. 2017. Isolation of immune cells from adi-pose tissue for flow cytometryx. Methods in Molecular Biology 1566:49–59.
- Kim YS, Lee HM, Kim JK, Yang CS, Kim TS, Jung M, Jin HS, Kim S, Jang J, Oh GT, Kim JM, Jo EK. 2017. PPAR-α activation mediates innate host defense through induction of TFEB and lipid catabolism. Journal of Immunology 198:3283–3295. DOI:10.4049/jimmunol.1601920.
- Komatsu M, Tong Y, Li Y, Nakajima T, Li G, Hu R. 2010. Multiple roles of PPARalpha in brown adipose tissue under constitutive and cold conditions. Genes to Cells 15: 91–100. DOI:10.1111/j.1365-2443.2009.01368.x.
- Lau K, Kothari V, Das A, Zhang XB, Baylink DJ. 2013. Cellular and molecular mechanisms of accelerated fracture healing by Cox2 gene therapy. Studies in a mouse model of multiple fractures. Bone 53:369–381. DOI:10.1016/j.bone.2013.01.003.
- Li J, Yang Q, Bai Z, Semenza GL, Ge RL. 2018. Chronic cold exposure results in subcutaneous adipose tissue browning and altered global metabolism in qinghai-tibetan plateau pika (Ochotona curzoniae). Biochemical & Biophysical Research Communications 500:2. DOI:10.1016/j.bbrc.2018.03.147.
- Maisano M, Cappello T, Oliva S, Natalotto A, Giannetto A, Parrino V, Battaglia P, Romeo T, Salvo A, Spano N, Mauceri A. 2016. PCB and OCP accumulation and evidence of hepatic alteration in the atlantic bluefin tuna, T. thynnus, from the Mediterranean Sea. Marine Environmental Research 121:40–48. DOI:10.1016/j.marenvres.2016.03.003.
- Nedergaard J, Bengtsson T, Cannon B. 2007. Unexpected evidence for active brown adipose tissue in adult humans. American Journal of Physiology Endocrinology and Metabolism 293:e444–452. DOI:10.1152/ajpendo.00691.2006.
- Nedergaard J, Petrovic N, Lindgren EM, Jacobsson A, Cannon B. 2005. PPARgamma in the control of brown adipocyte differentiation. Biochimica et Biophysica Acta 1740:293–304. DOI:10.1016/j.bbadis.2005.02.003.
- Okamatsuogura Y, Fukano K, Tsubota A, Niokobayashi J, Nakamura K, Morimatsu M, Sakaue H, Saito M, Kimura K. 2017. Cell-cycle arrest in mature adipocytes impairs bat development but not wat browning, and reduces adaptive thermogenesis in mice. Scientific Reports 7:6648. DOI:10.1038/s41598-017-07206-8.
- Peschechera A, Eckel J. 2013. “Browning” of adipose tissue-regulation and therapeutic perspectives. Archives of Physiology and Biochemistry 119:151–160. DOI:10.3109/13813455.2013.789529.
- Puigserver P. 1998. A cold-inducible coactivator of nuclear receptors linked to adaptive thermogenesis. Cell 92:829–839.
- Rosenmann M, Morrison P. 1974. Maximum oxygen consumption and heat loss facilitation in small homeotherms by He-O2. American Journal of Physiology 226:490–495.
- Seale P. 2015. Transcriptional regulatory circuits controlling brown fat development and activation. Diabetes 64:2369–2375. DOI:10.2337/db14-1560.
- Steinbring J, Graja A, Jank AM, Schulz TJ. 2017. Flow cytometric isolation and differentiation of adipogenic progenitor cells into brown and brite/beige adipocytes. Methods in Molecular Biology 1566:25–36.
- Sun SR, Zhu WL, Chen JL, Cao N, Gao WR, Zuo ML, Ye FY, Fu JH, Yang T, Wang ZK. 2015. The comparations of tree shrews (Tupaia belangeri) adipose tissue slices preliminary study under cold-acclimation. Chinese Journal of Conparative Medicine 25:1–6.
- Tomaszewska E, Dobrowolski P, Kwiecień M, Burmańczuk N, Badzian B, Szymańczyk S. 2014. Alterations of liver histomorphology in relation to copper supplementation in inorganic and organic form in growing rats. Bulletin of the Veterinary Institute in Pulawy 58:479–486. DOI:10.2478/bvip-2014-0073.
- Toselli S, Tarazona-Santos E, Pettener D. 2010. Body size, composition, and blood pressure of high-altitude Quechua from the Peruvian Central Andes (Huancavelica, 3,680 m). American Journal of Human Biology 13:539–547. DOI:10.1002/ajhb.1086.
- Wagner JA. 1841. Das peguanische Spitzhörnchen. In: von Schreber JCD, editor. Die Säugethiere in Abbildungen nach der Natur mit Beschreibungen. Supplementband 2. Erlangen: Expedition des Schreber’schen Säugethier- und des Esper’schen Schmetterlingswerkes. pp. 42–43.
- Wang JM, Zhang YM, Wang DH. 2006. Seasonal regulations of energetic, serum concentrations of leptin, and uncoupling protein 1 content of brown adipose tissue in root voles (Microtus oeconomus) form the Qinghai-tibtan plateau. Journal of Comparative Physiology 176:663–671. DOI:10.1007/s00360-006-0089-4.
- Wang Y, Zhu TT, Ke S, Fang N, Irwin DM, Lei M, Zhang JP, Shi HZ, Zhang SY, Wang Z. 2014. Thegreat Roundleaf Bat (Hipposideros armiger) as a good model for cold-induced browning of intraabdominal white adipose tissue. PloS one 9:e112495. DOI:10.1371/journal.pone.0112495.
- Wu X, Chang Q, Zhang Y, Zou X, Chen L, Zhang L. 2013. Relationships between body weight, fasting blood glucose concentration, sex and age in tree shrews (Tupaia belangeri chinensis). Journal of Animal Physiology and Animal Nutrition 97:1179–1188. DOI:10.1111/jpn.12036.
- Yang X, Fu Y, Hu F, Luo X, Hu J, Wang G. 2018. PIK3R3 regulates PPARα expression to stimulate fatty acid β-oxidation and decrease hepatosteatosis. Experimental & Molecular Medicine 50:e431. DOI:10.1038/emm.2017.243.
- Zhang L, Yang F, Wang ZK, Zhu WL. 2017. Role of thermal physiology and bioenergetics on adaptation in tree shrew (Tupaia belangeri): The experiment test. Scientific Reports 7:41352. DOI:10.1038/srep41352.
- Zhu WL, Wang ZK. 2015. Seasonal changes in body mass, serum leptin levels and hypothalamic neuropeptide gene expression in male Eothenomys olitor. Comparative Biochemistry and Physiology 184:83–89. DOI:10.1016/j.cbpa.2015.02.011.
- Zhu WL, Yang SC, Zhang L, Wang ZK. 2012. Seasonal variations of body mass, thermogenesis and digestive tract morphology in Apodemus chevrieri in Hengduan mountain region. Animal Biology 62:463–478. DOI:10.1163/157075612X650140.
- Zhu WL, Ye FY, Wang ZK. 2017a. Study of chemical communication based on urine in tree shrews (Tupaia belangeri). The European Zoological Journal 84:512–524. DOI:10.1080/24750263.2017.1391340.
- Zhu WL, Zhang D, Hou DM, Yang G. 2017b. Roles of hypothalamic neuropeptide gene expression in body mass regulation in Eothenomys miletus (Mammalia: Rodentia: Cricetidae). The European Zoological Journal 84:322–333. DOI:10.1080/24750263.2017.1334840.
- Zhu WL, Zhang H, Zhang L, Yu TT, Wang ZK. 2014. Thermogenic properties of Yunnan red-backed voles (Eothenomys miletus) from the Hengduan mountain region. Animal Biology 64:59–73. DOI:10.1163/15707563-00002430.