
Abstract
The aim of this work was to monitor the ornithic community of the forest of Vallombrosa Biogenetic National Nature Reserve, in the Florence area. The forest covers about 1273 hectares, at an altitude of 470 to 1440 m above sea level (a.s.l.). The main forest types are coniferous woodland, mixed woodland of coniferous and deciduous trees with a prevalence of beech, and open areas. The bird monitoring was carried out using the point count method. Forty-one listening points were considered. The results of the counts allowed the calculation of abundance per station (n), richness (S), Shannon–Wiener diversity (H’), evenness (J’) and non-passerine incidence (NP). The data were analysed using the Kruskal–Wallis non-parametric test and principal component analysis, considering the forest type, season and altitude as sources of variability. Forty-seven bird species were identified. Abundance was higher in open areas, in the pre-reproductive period and at 800–1000 m a.s.l. Richness was higher in open areas, in reproductive and pre-reproductive periods and at lower altitudes. Diversity index was higher in open areas, in the reproductive period and at lower altitudes. Evenness was greater in the reproductive period, lower in the broadleaved-tree woodland and lower at higher altitudes. Non-passerine incidence was lower in deciduous areas, higher in the pre-reproductive and reproductive periods and higher at lower altitudes. Seventeen species registered more than 100 contacts each. The highest average values of richness, abundance, diversity and non-passerine incidence were found in the open areas and at high altitudes. Considering the ornithical community throughout the year, the ecological indices taken together showed the highest values in the pre-reproductive and reproductive periods. Because of the area’s high richness and biodiversity, and the significant presence of species that are rare and of naturalistic interest, Vallombrosa forest is confirmed to be of high ornithological value.
Introduction
This work aimed to determine the structure and composition of the bird community of Vallombrosa Biogenetic National Nature Reserve (Vallombrosa forest). This work complies with Annex V of Directive 2009/147/CE of the European Parliament and of the Council of 30 November 2009 on the conservation of wild birds (Official Journal of the European Union, 26 January 2010), and with the Istituto superiore per la protezione e la ricerca ambientale (ISPRA) guidelines (ISPRA Citation2017). Furthermore, this work considers the bird community a relevant ecological indicator, following previous authors (Pilastro et al. Citation1993; O’Connell et al. Citation2000; Stolen et al. Citation2005; Padoa-Schioppa et al. Citation2006; Radhouani et al. Citation2012).
Bird classes include many species with important and differentiated roles in terrestrial ecosystems, and that are easy to detect. Birds are homeotherms, able to remain active during the whole year. Their particular locomotion ability allows birds to adapt in different natural environments, quickly adapting to climate changes (Wiens Citation1992) and showing high ecological ductility (Dorst Citation1982). Birds are indicators of the health status of a territory, aiding territory planning, also at large scale (Bermejo Citation2010). Woodland birds merit continuous and careful attention because their biological cycle is strictly connected to the woodlands, especially in the more exigent species (“interior species”). Forests, used by humans for centuries as a source of wood (MacArthur & MacArthur Citation1961; Furness & Greenwood Citation1994; Berg Citation1997; Brichetti & Gariboldi Citation1997; Villard Citation1998; Martini Citation2011; Martini et al. Citation2013), are important for biodiversity.
This survey was carried out during a new phase of forestry ecosystem management and during important climate alterations, including a catastrophic windstorm in 2015. The current forestry management (2006–2015) indicates that about 90% of the forest will be re-naturalised through innovative, cautious and widespread silvicultural operations, synergic to the natural dynamics (Ciancio Citation2009). This method represents a turning point for the reserve: after centuries of major exploitation of woodlands for commercial purposes, for about 20 years (in the 20th and 21st centuries) there was poor forest management (i.e. poor cutting of dead, endangered, or falling trees).
The aim of this work was to evaluate the main ecological indices of the Vallombrosa forest and to determine its biodiversity level from the bird structure and composition as a function of the type of forest, season and altitude.
The terrible windstorm on 5 March 2015 resulted in fallen trees in large areas of the forest; the results of this study represent the “first phase” of a series of observations and considerations taken at a local level on the impacts and damage of climate change. The continuation of the study in 2017–2018 will allow a first evaluation of the possible changes to the bird community in the forest.
Materials and methods
Study area
Vallombrosa Biogenetic National Nature Reserve is located in the municipality of Reggello in the province of Florence, on the north-west side of Pratomagno Massif, which divides the Casentino Valley and the upper Valdarno. The size of the reserve is 1273 ha and the altitude varies between 470 and 1447 m above sea level (a.s.l.). This area is characterised by steep slopes and torrential, seasonal and short rivers (Patrone Citation1970).
Sedimentary rocks, mainly sandstones of varying structure and texture, characterise the area of the reserve. There are also many schistose rocks (called “galestro”) that produce poor limestone and rather acid soils.
Soils are well drained and well structured, with variable depth. The Mediterranean climate of this area is characterised by cool summers and mild winters, with frequent, sometimes heavy rains. The main forest type is the high forest of Abies alba (664 ha), but the end of the cutting of trees at ground level and the suspension of anthropogenic restoration practices, along with the frequent windstorms, are leading to a mixed forest of deciduous prevalence. The high forest of Fagus sylvatica, the second forest type of the reserve, occupies 187 ha between 1000 and 1450 a.s.l. This is an old forest, between 70 and 170 years old. Near the high-altitude limit, the prevalent species is Pinus nigra (also Pseudotsuga menziesii, introduced for experimental purposes). At the same altitude there are also deciduous mixed forests of Castanea sativa, Quercus cerris, Quercus pubescens, Ostrya carpinifolia, Fagus sylvatica and Fraxinus ornus, in addition to a few tree species with high naturalistic relevance: old chestnut coppice and chestnut trees for fruit production that are growing in natural forest.
The most common mammals are ungulates, mainly Dama dama and Sus scrofa. These animals have a detrimental effect on forest restoration, without affecting the conservation of the forest ecosystem. This area also hosts Capreolus capreolus and Cervus elaphus, the latter a species thought to be moving towards larger and richer pastures. Among the small mammals, there are Vulpes vulpes, Mustela nivalis, Martes faina, Mustela putorius, Glis glis, Hystrix cristata, Lepus europaeus, Erinaceus europaeus, Sciurus vulgaris, Meles meles, Muscardinus avellanarius and various bats. The presence of Canis lupus and Felis silvestris has been documented in this area.
Among the reptiles of European interest in this area are Lacerta viridis and Podarcis muralis, while among the amphibia there are Bombina pachypus, Triturus carnifex, Speleomantes italicus and Salamandra salamandra, protected by Regional Law (L.R.) 56/2000 (Ciancio Citation2009).
The class of birds includes numerous species related to old forest that play an important ecological role in these ecosystems. These birds belong to the orders Passeriformes, Piciformes, Columbiformes, Accipitriformes and Strigiformes. The Species of Conservation Interest (SCI) under Directive 147/2019 92/43/EEC reported in the reserve are the Eurasian tree-creeper Certhia familiaris, the lesser spotted woodpecker Dendrocopos minor and the European honey buzzard Pernis apivorus. Vallombrosa forest is a Biogenetic National Nature Reserve, registered in the official List of Protected Areas (R.L. 394/91). The reserve includes the Special Conservation Zone (SCZ) IT51400012 “Vallombrosa and Sant’Antonio Forest” (Natura 2000 network), which is defined as a “Site of Regional Interest” (SIR46) according to the Tuscan Regional Law no. 56/2000: “Rules for the conservation of the natural and semi-natural environment and of flora and wildlife”. In this site, characterised by many habitats and species of European interest, and for scientific purposes, innovative “forestry ecosystem management” was introduced and developed. This management is innovative because is a complex biological system based on autopoiesis, which describes the capacity of an entity to reproduce itself and permits autonomous organisation and evolution of the forest. Systemic silviculture using the “modular cutting system” was carried out; this system applies targeted methods that allow the conservation, preservation and re-naturalisation of the forest. The conservation permits the maintenance of the historical, cultural and landscaping (about 100 ha) characters; the preservation permits the monitoring of non-anthropised forest areas and those undergoing re-naturalisation (about 50 ha). This re-naturalisation improves the intrinsic self-organisation of the natural and evolutive processes of the forest stands (about 1100 ha). The systemic silviculture, respecting and promoting forest functionality, considers anthropic activity essential in the ecosystem (Ciancio Citation2009).
Bird community
To study the bird populations of Vallombrosa Reserve, the “point count” method was used (Blondel et al. Citation1981; Volpato et al. Citation2009). This method is commonly used in ornithology because it allows the collection of information about the number of species and individuals in a particular area, and it is the most suitable for use in a forest environment (Massa Citation1998; Klingbeil & Willig Citation2015). Individuals seen and/or heard were annotated while standing still in one place (station) for 10 minutes (Thompson et al. Citation2002). Forty-one stations were distributed at intervals of no more than 200 m along the pathways, public roads and forest roads of the reserve (Dawson Citation1981; Bibby et al. Citation1992). The position of the stations was recorded via paper cartography (forestry vegetation map, scale 1:10,000, attached to the Forestry Management Plan 2006–2025) and via Global Positioning System (GPS), then imported into a Geographic Information System (GIS; ).
Figure 1. Point counts map – listening points
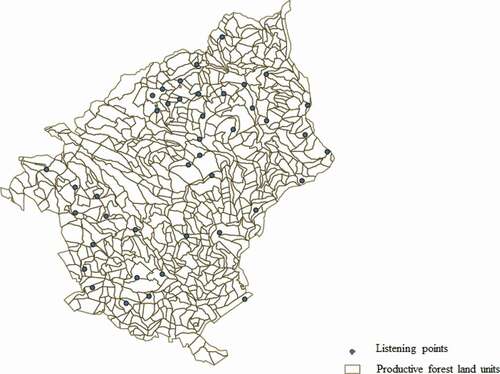
The bird population was studied considering the vegetation cover (individuated through the Forestry Management Plan), the season and the altitude. The “listening points” were chosen via stratified sampling, considering the level of the vegetation cover. The vegetation classes used were the following:
Marginal areas (MA): Represented by the few open areas of the reserve, near the Vallombrosa Abbey, around the buildings and nurseries. Five marginal areas were chosen; these are relevant ecological zones.
Coniferous (Co): Coniferous forests, mainly Abies alba. Eighteen coniferous areas were chosen.
Coniferous and broadleaved (Co/Bl): Mixed broadleaved and coniferous woodland forest, in variable percentages. Thirteen mixed areas were chosen.
Broadleaved (Bl): Broadleaved forests, mainly represented by Fagus sylvatica. Five deciduous areas were chosen.
Throughout the year, each station was visited once a month; the listening time was 10 minutes for each station. For all species and in all cases, playback was never used to stimulate the bird response. Monitoring began at sunrise and continued for 5 hours, except when there was rainfall or snowfall, or unfavourable wind.
For the seasonal parameter, the reproductive physiological status of the bird populations was considered. Four groups were individuated: February, March (FM) – the pre-reproductive period; April, May, June, July (AMJJ) – the reproductive period; August, September, October, November (ASON) – the post-reproductive period; December, January (DJ) – the wintry period.
The altitude of the stations was considered to evaluate the altitude parameter. Four classes were individuated: 600–800, 800–1000, 1000–1200 and 1200–1400 m a.s.l.
Using the count data, the main ecological parameters were calculated:
Abundance (N): The total number of individuals.
Richness (S): The number of species. This gives the population richness and its complexity.
Relative frequency (pi): The ratio of the number of individuals of a particular species to the number of total individuals in the ornithical community. The equation for the relative frequency is pi = ni/N, where ni = number of individuals of the ith species and N = ∑ ni. When pi is equal to or greater than 0.05, the species is considered dominant (Turček Citation1956; Oelke Citation1980; Fulco & Tellini Florenzo Citation2008; Angelici et al. Citation2012; Domokos & Domokos Citation2016); when pi is between 0.02 and 0.05, the species is sub-dominant. This index indicates the relative relevance of every species in a community.
Shannon–Wiener Diversity (H’) (Wiener Citation1948; Shannon & Weaver Citation1949): This is the most commonly used index for species diversity (Hubalek Citation2000). This index gives the population biodiversity, and it depends on the number of species and their abundance. The equation for calculating this index is H’ = −∑ S i=1 (pi ∙ ln pi). It ranges between 0 (monospecific community) and ln S (maximum richness, where the species are equally represented). It measures the probability that individuals of different species will be found during the monitoring. Diversity is positively correlated with the H’ value: an increase in H’ corresponds to a higher diversity. The value of H’ can range between 0 and, theoretically, +∞.
Evenness (J’): The homogeneity of distribution of the different species abundances in a community. The equation for calculating this index is J’ = H’/H’max, where H’max = ln S. Its value varies between 0, when only one species is present, and 1, when the species of the community are equally distributed (equal abundance index). It depends only on the distribution of the abundances of individuals within the species (Lloyd & Ghelardi Citation1964; Pielou Citation1966).
Non-passerine percentage (NP%): In a bird community, this parameter gives the percentage of the species not belonging to the order Passeriformes. It can indicate the presence of stenoeic species; previous studies have shown that the non-Passeriformes may be absent in the initial phases of an ecological succession, and may increase in the subsequent stages (Bellomo Citation2006).
The ecological parameters and the overall species abundances higher than 100 were analysed, using JMP® (Citation2012), with the Kruskal–Wallis non-parametric test, considering the following as fixed factors:
Vegetation type: marginal areas (MA); coniferous forests (Co); coniferous and broadleaved forests (Co/Bl); broadleaved forests (Bl).
Seasonal period (Season): pre-reproductive period, in February and March (FM); reproductive period, in April, May, June and July (AMJJ); post-reproductive period, in August, September, October and November (ASON); wintry period, in December and January (DJ).
Altitude: 600–800 (A), 800–1000 (B), 1000–1200 (C) and 1200–1400 (D) m a.s.l.
To compare the groups, the non-parametric Dunn test was used.
For the above parameters, principal component analysis (PCA) was also applied. PCA belongs to the group of multivariate analysis methods. Its basic concept is to describe a given phenomenon using a small number of so-called hidden factors (i.e. components) in relation to an extensive set of primary variables. This method was selected to determine the degree of similarity between vegetation type, season, altitude and bird populations. The Kaiser test was applied, and biplot graphics were created to visualise the bird population distribution in different vegetation types, seasons and altitudes (Sargentini et al. Citation2018).
The abbreviations used for the listed species are as follows: common swift – Apus apus (AA); long-tailed bushtit – Aegithalos caudatus (AC); Eurasian sparrow hawk – Accipiter nisus (AN); tree pipit – Anthus trivialis (AT); common buzzard – Buteo buteo (BB); short-toed treecreeper – Certhia brachydactyla (CB); goldfinch – Carduelis carduelis (CC); Eurasian blue tit – Cyanistes caeruleus (Cc); common cuckoo – Cuculus canorus (Cca); greenfinches – Carduelis chloris (Cch); Hooded Crow – Corvus cornix (Cco); hawfinch – Coccothraustes coccothraustes (Coco); common woodpigeon – Columba palumbus (CP); Eurasian siskin – Carduelis spinus (CS); great spotted woodpecker – Dendrocopus major (DM); black woodpecker – Dryocopus martius (Dm); lesser spotted woodpecker – Dendrocopus minor (DMi); cirl bunting – Emberiza cirlus (EC); European robin – Erithacus rubecula (ER); common chaffinch – Fringilla coelebs (FC); brambling – Fringilla montifringilla (FM); Eurasian jay – Garrulus glandarius (GG); crested tit – Lophophanes cristatus (Lc); white wagtail – Motacilla alba (MA); grey wagtail – Motacilla cinerea (MC); spotted flycatcher – Muscicapa striata (MS); coal tit – Periparus ater (PA); European honey buzzard – Pernis apivorus (Pa); chiffchaff – Phylloscopus collybita (PC); great tit – Parus major (PM); black redstart – Phoenicurus ochruros (PO); marsh tit – Poecile palustris (PP); Eurasian bullfinch – Pyrrhula pyrrhula (Pp); common redstart – Phoenicurus phoenicurus (Pph); Eurasian crag martin – Ptyonoprogne rupestris (PR); European green woodpecker – Picus viridis (PV); common firecrest – Regulus ignicapilla (RI); goldcrest – Regulus regulus (RR); blackcap – Sylvia atricapilla (SA); tawny owl – Strix aluco (Sa); European nuthatch – Sitta europeae (SE); European serin – Serinus serinus (SS); Eurasian blackbird – Turdus merula (TM); song thrush – Turdus philomelos (TP); Eurasian northern wren – Troglodytes troglodytes (TT); mistle thrush – Turdus viscivorus (TV); Eurasian hoopoe – Upupa epops (UE).
Results
Bird community and ecological indices
From September 2013 to August 2014, 47 bird species were recorded in Vallombrosa Reserve (): 11 species belonged to non-passerine orders (Accipitriformes, Apodiformes, Bucerotiformes, Cuculiformes, Columbiformes, Piciformes, Strigiformes) and 36 were Passeriformes. Among the non-passerine species, there were diurnal and nocturnal birds of prey. In this study, 6569 contacts were recorded. During the considered period, five species were found to be dominant, meaning each showed an abundance value higher than 5% of the total abundance (Turček Citation1956): common chaffinch, coal tit, European nuthatch, short-toed treecreeper and common firecrest. The following sub-dominant species had abundance values between 2% and 5% of the total abundance (Purroy Citation1975): Eurasian blackbird, Eurasian jay, Eurasian blue tit, European robin, northern wren, song thrush, European green woodpecker.
Table I. Total number of birds contacted (ni) and dominance (relative frequency) (pi)
In this study individuals of Dryocopus martius were found in six live beech trees with damaged trunks, which contained 22 holes (nest cavities), including one that was an outline and two that were not completed. Many holes for feeding were found on trunks of Abies alba, Pinus nigra and Fagus sylvatica at altitudes ranging from 800 to 1400 m. a.s.l.
The most important ecological indices, considered throughout the whole year, showed an S’ value of 47 and a non-passerine percentage of 23.40%.
The annual trend of the species richness and the percentage of non-passerine species is shown in . The richness estimated throughout the year () produced the following results: the lowest values were found in DJ, with 21 recorded species; and the highest number of species was recorded, with a peak of 33 in April, during the reproductive and post-reproductive period (from April to August), when nesting species are present in the reserve.
Figure 2. Trend throughout the year of species richness (S) and of non-passeriform species percentage (NP%)
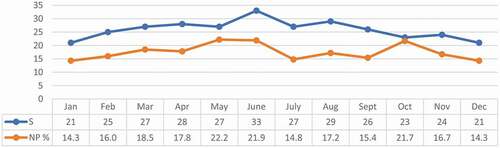
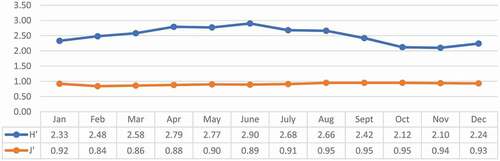
The non-passerine species were present throughout year () with percentages higher than 14.3% (DJ). The highest percentages occurred in May and June, when they reached 22.2% (five NP species among 27 counted species) and 21.9% (seven NP species among 33 counted species), respectively. A peak of 21.7% was registered in October. The overall Shannon–Wiener index reached a value of 2.50, while the evenness index (J’) was 0.91 (). The Shannon–Wiener diversity index reached its highest values in the spring and summer months, with a peak in June, when many nesting species are present in the forest. The lowest values were registered in October and November. The evenness index was constant during the year ().
Figure 3. Trend throughout the year for the Shannon–Wiener (H’) and evenness (J’) indices
Vegetation type ecological indices
In the most important ecological indices considered for listening points and vegetation type are shown. The abundance index, the species richness and the Shannon–Wiener index were highest in MA. The evenness index did not show significant variation among groups, and the non-passerine index was significantly lower in the Bl forests.
Table II. Ecological Indices by vegetation type (mean ± standard deviation; χ² and P > χ² from Kruskal-Wallis test) using Dunn’s multiple comparison test
Seasonal ecological indices
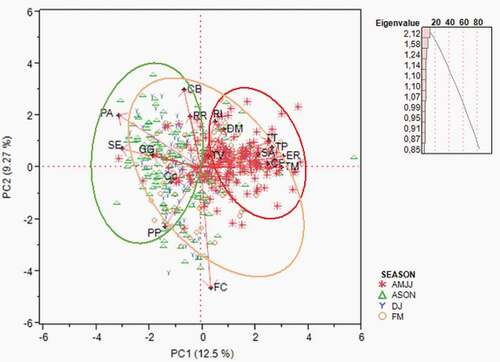
The ecological indices of the bird community evaluated according to season and phenological stadium are shown in . The abundance was higher in FM, while the specific richness was higher in the pre-reproductive period (FM) and reproductive period (AMJJ). The Shannon–Wiener index was higher in the reproductive season (AMJJ). The evenness index was higher in the reproductive period, indicating that this forest is a nesting area with equal species richness. Even the non-passerine index was higher in the pre-reproductive and reproductive seasons.
Table III. Ecological Indices by season (mean ± standard deviation; χ² and P > χ² from Kruskal-Wallis test) using Dunn’s multiple comparison test
Altitude ecological indices
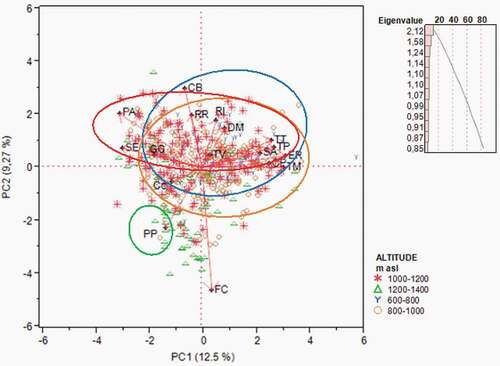
shows the distribution of the ornithical community according to altitude: abundance and richness were higher at low altitudes. The richness was higher between 600 and 1000 m a.s.l.; it decreased significantly at 1000–1200 m and again at 1200–1400 m. The Shannon–Wiener index showed the same trend as the richness (). The percentage of non-passerine species was higher at low altitude; it decreased at 800–1200 m a.s.l., and the lowest value was found at 1200–1400 m. The evenness index was high and did not differ with altitude, while the non-passerine index was lower at high altitudes.
Table IV. Ecological Indices by elevation (mean ± standard deviation; χ² and P > χ² from Kruskal-Wallis test) using Dunn's multiple comparison test
Species by vegetation type (numbers greater than 100)
Among the species having numbers greater than 100, Eurasian blue tit, great spotted woodpecker and Eurasian blackcap prefer the marginal areas (). These results were confirmed by the PCA ().
Table V. Distribution of species with total number > 100 by vegetation type (Average number of individuals per station) using Dunn’s pairwise multiple-comparison test
Figure 4. PCA: Biplot of the distribution of species with total number > 100 by vegetation type. Notes. Poecile palustris (PP); Cyanistes caeruleus (Cc); Periparus ater (PA); Columba palumbus (CP); Garrulus glandarius (GG); Troglodytes troglodytes (TT); Erithacus rubecula (ER); Turdus merula (TM); Turdus philomelos (TP); Turdus viscivorus (TV); Regulus ignicapilla (RI); Regulus regulus (RR); Certhia brachydactyla (CB); Sitta europaea (SE); Dendrocopus major (Dm); Fringilla coelebs (FC); Sylvia atricapilla (SA); Marginal areas (MA); Coniferous (Co); Coniferous and broadleaved (Co/Bl); Broadleaved (Bl)
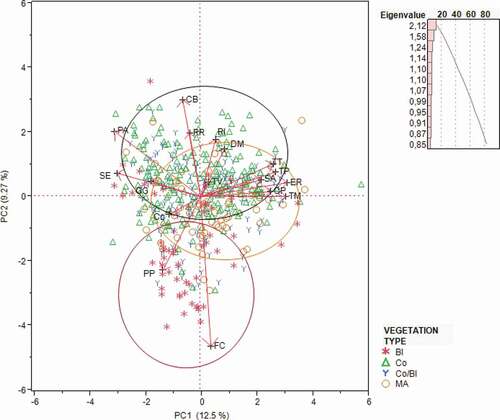
Marsh tit lives in the broadleaved forests and in the marginal areas (). In the beech woodlands an average abundance of 0.571 was found. The Northern wren prefers the pure and mixed coniferous forests. Among the members of the family Turdidae, the Eurasian blackbird prefers mainly the marginal areas, then the pure and mixed coniferous forests and finally the broadleaf forests.
Goldcrest and common firecrest showed higher average abundance values in the pure and mixed coniferous forest. The short-toed treecreeper showed lower average abundance values in the broadleaf (beech) forest. The coal tit showed higher average abundance values in the coniferous forest.
Species by season (numbers greater than 100)
shows the average number of individuals per station in different periods of the year. Marsh tit, Eurasian blue tit and coal tit showed the highest abundance values in late summer/autumn (ASON) and in FM. The findings in the table agree with the PCA results (). The highest average number of common woodpigeon individuals was found in FM and AMJJ. The highest average numbers of northern wren and European robin individuals were found in AMJJ, while Eurasian blackbird and common firecrest individuals showed their highest numbers in FM and AMJJ. During the trial the song thrush was mainly individuated in FM, when its singing activity was highest; short-toed treecreeper and European nuthatch individuals showed their highest numbers in ASON. The great spotted woodpecker reached its highest numbers in FM, when the individuals of this species – early singing birds – start to sing; even the common chaffinch showed the highest abundance in this period, probably because of the presence of migratory birds. The average number of Eurasian blackcap individuals was highest by far in AMJJ.
Table VI. Distribution of species with total number > 100 by season (Average number of individuals per station) using Dunn’s pairwise multiple-comparison test
Figure 5. PCA: Biplot of the distribution of species with total number > 100 by altitude (m above sea level). Notes. Poecile palustris (PP); Cyanistes caeruleus (Cc); Periparus ater (PA); Columba palumbus (CP); Garrulus glandarius (GG); Troglodytes troglodytes (TT); Erithacus rubecula (ER); Turdus merula (TM); Turdus philomelos (TP); Turdus viscivorus (TV); Regulus ignicapilla (RI); Regulus regulus (RR); Certhia brachydactyla (CB); Sitta europea (SE); Dendrocopus major (Dm); Fringilla coelebs (FC); Sylvia atricapilla (SA); April, May, June, July (AMJJ); August, September, October, November (ASON); December, January (DJ); February, March (FM)
Species by altitude (numbers greater than 100)
In terms of altitude (), marsh tit (PP) preferred the high mountains. The results shown in were confirmed by the PCA (). In this study, northern wren avoided high altitudes, and Eurasian blackbird lived between 600 and 1000 m a.s.l. The highest average abundance values of European robin (ER) were found at lower altitudes. Even the song thrush followed this trend. The highest abundance values of the short-toed treecreeper (CB) occurred between 600 and 800 m a.s.l., whereas the common firecrest and Great Spotted Woodpecker lived below 1200 m a.s.l.
Table VII. Distribution of species with total number > 100 by altitude (Average number of individuals per station) using Dunn’s pairwise multiple-comparison test
Figure 6. PCA: Biplot of the distribution of species with total number > 100 by season. Notes. Poecile palustris (PP); Cyanistes caeruleus (Cc); Periparus ater (PA); Columba palumbus (CP); Garrulus glandarius (GG); Troglodytes troglodytes (TT); Erithacus rubecula (ER); Turdus merula (TM); Turdus philomelos (TP); Turdus viscivorus (TV); Regulus ignicapilla (RI); Regulus regulus (RR); Certhia brachydactyla (CB); Sitta europea (SE); Dendrocopus major (Dm); Fringilla coelebs (FC); Sylvia atricapilla (SA)
Discussion
Bird community and ecological indices
The non-passerine birds represent a part of the ornithic community that is rather selective from an ecological point of view, so their abundance is an index of the higher or lower complexity of the bird community (Bernoni et al. Citation2012). Two examples are: the diurnal and nocturnal birds of prey, which are at the top of the food chain; and the woodpeckers, which require a complex and very peculiar environment. The presence of Dryocopus martius, listed in Annex I of Directive 147/2009/CE and in Annex III of the Berne Convention, was very important; it is a strictly protected species under National Law 157/92, and is a species of conservation interest in SCZ IT51400012 “Vallombrosa and Sant’Antonio Forest”. The presence of Dryocopus martius was identified in this area in 2010 (Martini Citation2011; Martini et al. Citation2013). The abundance index and the species richness were highest in the ecotonal areas (Martini et al. Citation2017). The species richness value, an indicator of the complexity of the ornithical community (Gustin et al. Citation2015), agrees with the species richness value found in the wet zone of Sentina Natural Reserve (Gustin et al. Citation2015). The richness registered in April was higher than that registered in the nearby “Foreste Casentinesi”, where only high forest of white fir was considered (Lapini & Tellini Citation1990), and slightly higher than that registered in a beechwood in Basilicata (Fulco & Tellini Florenzo Citation2008). The number of species registered in April, May and June was higher than the average value recorded in three Aveto forests (Zatta, Lama and Penna) characterised by a different proportion of mixed Abies alba and Fagus sylvatica (Baghino Citation2013). The trend of this parameter during the year, characterised by small variations, agrees with the results of other studies examining complex forestry ecosystems (Malavasi Citation1998; Nardo Citation2001). The evenness index (J’) as measured in this study agrees with the values for the “dello Zatta Forest” (Baghino Citation2013), whereas it is higher than the values found by the same author in the three regional forests of the Aveto Natural Park (Baghino Citation2013).
Ecological indices by vegetation type
The quite high Shannon–Wiener diversity index throughout the year confirmed, as observed by other authors (Malavasi Citation1998; Nardo Citation2001), that evolved forestry ecosystems, having a high level of structural complexity and low anthropisation, are suitable habitats for a bird community that is qualitatively and quantitatively more or less constant during the year. The evenness is a measure of the relative abundance of the different species making up the richness of an area (Brichetti & Gariboldi Citation1997). This study showed index values close to the maximum value of 1; the diversified environment allows similar species abundance. The abundance index and the species richness agrees with previous studies carried out in similar and different territories: Giogo and Casaglia areas (Sposimo Citation1995), Foreste Casentinesi (Tellini Florenzano Citation1999), Brescia Prealps (Cambi & Micheli Citation1985), and the Niraj Valley in Romania (Domokos & Domokos Citation2016). The high ecological value of the ecotonal areas, which are strongly heterogeneous, is due to the so-called marginal effect (Silbernagel Citation2003). In these areas, various vegetation and environment typologies are present; here the typical bird species and the birds of the transitional areas, that are characterised by high density and biodiversity, live together (STERNA Citation2018).
Ecotonal effects on the biodiversity richness are shown in an anthropogenic naturalised environment, such as in the margins of cut woods and the nearby woods of Val di Non (Marchesi Citation2007). In the coniferous forest, the Shannon–Wiener index was higher than that found in an alpine environment in mixed forests with a prevalence of coniferous trees (Laiolo & Rolando Citation2005). In the mixed coniferous/broadleaved (beech) forest, the Shannon–Wiener value was lower than in a mixed forest of beech and white fir in Sambuca Pistoiese, where only the reproductive season (MAMJJ) was considered (Bettini & Gargani Citation2009–2010). The lowest evenness values were observed in broadleaved forests; this value was lower than the evenness index in similar forests in the north of Tuscany (Farina Citation1987).
The marginal areas, the coniferous forest, and the mixed coniferous and broadleaved forest seemed to show higher biodiversity than did the other vegetation types.
Ecological indices by season
The abundance was higher in FM, when there is an overlap of individuals in migration (mainly finches) and the early singing birds for attracting a mate. The richness results indicate that this area was chosen for nesting by various species. The Shannon–Wiener value found in this study is comparable to that found in a study carried out in the forests of “Monte la Croce” (Sambuca pistoiese) during the period MAMJJ (Bettini & Gargani Citation2009–2010). In another study, in the Aveto Mounts, a very high Shannon–Wiener index was found, but only April and June were considered for the calculation (Baghino Citation2013).
The evenness index found in this study was higher than that obtained by Baghino (Citation2013) in Aveto Mounts. Because the non-passerine index measures the structural complexity of the environment (Gustin et al. Citation2015), the values obtained in the present study indicate a good forest environmental heterogeneity. The indices found in FM and AMJJ agree with the values obtained in the Tarvisio forests in the Sciliar Natural Park (Sorace & Visentin Citation2007).
Ecological indices by altitude
In terms of altitude, the findings of this study agree with the results of Forconi (Citation2018) and Massa et al. (Citation1989) from studies carried out in Marche and in the Etna area, respectively: at high altitudes the species richness and structural complexity were lower, but more specialised birds live at these altitudes. Beskardes et al. (Citation2018) also found, on pure oak stands in north-western Turkey, higher richness indices at lower altitude. In addition to high altitudes, a smaller difference in bird populations was found at lower latitudes and in areas with equatorial climate: in Usumbara Mountains in north-eastern Tanzania above 450 m a.s.l., the variety in composition of the bird community progressively decreased due to the lower temperature and the higher altitude.
The findings of this study do not agree with the Shannon–Wiener index found in the Italian Alps in 2010 (Popy et al. Citation2010); moreover, in 2019 some authors found an upwards shift in the altitudinal ranges of bird populations, caused by the warming climate and reduced snow (Bani et al. Citation2019). Also, in the Ailao Mountains of south-west China, in a study carried out between 1270 and 2470 m a.s.l., higher taxonomic diversity was found at high altitudes; this may be caused by the interspecific competition for food, and by the anthropic activities at lower altitudes (He et al. Citation2018). The evenness index, highly similar at different altitudes, indicated an adequate number of individuals distributed among the species; these results agree with the findings of Gustin and Di Federico (Citation2016) in the Abruzzo forests and with those of Sorace and Visentin (Citation2007) in other Italian areas. The low non-passerine index at high altitudes agrees with the results of Brunelli et al. (Citation2015) in the Duchessa Mountains of Latium (Central Italy).
Species by vegetation type (numbers greater than 100)
The value of Marh tit abundance in broadleaved (0.67) was higher than the same parameter found on the Lepini Mounts (Sorace et al. Citation2004). The northern wren (TT) prefers the pure and the mixed coniferous forests, and does not prefer the broadleaf forests, as highlighted by Tellini Florenzano (Citation1999) in the Casentino Forests Park, where the preferred environment of this species was the fir forest. In the same study, the Eurasian blackbird (SA) was found to avoid beech and fir forests, whereas the song thrush (TM) mainly preferred the coniferous forests. Tellini Florenzano (Citation1999) also found goldcrest (RR) and common firecrest (RI) in the fir forest; both species showed higher average abundance values in the pure and mixed coniferous forest. A similar trend was observed in the Penna and Lame Forests (Aveto Park), where common firecrest (RI), coal tit (PA) and common chaffinch (FC) preferred pure or dominant fir forests (Baghino Citation2013). In the Casentino Forests (Tellini Florenzano Citation1999), the short-toed treecreeper (CB) avoided the broadleaved forests, whereas in the Lepini Mounts, in winter, its abundance was higher in beech forests than in marginal and reforested areas (Sorace et al. Citation2004). The coal tit (PA) results are in line with the results of Tellini Florenzano (Citation1999), who showed that this species prefers the fir woodlands. In another study carried out in winter in the Lepini Mounts (Sorace et al. Citation2004), the abundance in the reforested coniferous areas was greater than that in the beech forests.
Species by season (numbers greater than 100)
The Eurasian blackcap findings agree with a study carried out in three state forests (Farina & Brogi Citation1995) in Tondo Mount area, in Monterufoli area and in Amiata Mount area (Madonna delle Querce). That study found that the species was absent in the DJ period in the forests of Tondo Mount, which has a mountain climate, and in the Monterufoli area. Results for the goldfinch (CC), northern wren (TT), goldcrest (RR), Great Spotted Woodpecker (DM) and Eurasian blackcap (SA) agree with those obtained in a study carried out in forests of England (Alder et al. Citation2018). The PCA partially agrees with Laiolo (Citation2005), who found common woodpigeon (CP) associated with the spring season. Other species were associated with other seasons.
Species by altitude (numbers greater than 100)
The marsh tit (PP) findings did not agree with those of another study carried out in the Casentino forests (Tellini Florenzano Citation1999), where this species avoided high altitude. The results for the northern wren (TT) and Eurasian blackbird (SA) matched those of another study performed in Casentino Forests (Tellini Florenzano Citation1999). In contrast, in the present study, European robin (ER) showed the highest average abundance at lower altitudes. The results for short-toed treecreeper (CB) were in accord with those of a study carried out in the forests of the north Apennines (Baghino Citation2013).
To conclude, because of the area’s high richness and biodiversity and the significant presence of species that are rare and of naturalistic interest, Vallombrosa forest is confirmed to be of high ornithological value.
Disclosure statement
No potential conflict of interest was reported by the authors.
Additional information
Funding
References
- Alder DC, Fullerc RJ, Marsdenb SJ. 2018. Implications of transformation to irregular silviculture for woodland birds: A stand wise comparison in an English broadleaf woodland. Forest Ecology and Management 422:69–78. DOI: 10.1016/j.foreco.2018.04.004.
- Angelici C, Brunelli M, Battisti C. 2012. Breeding birds in agroforest habitat types (Nazzano, Tevere-Farfa Nature Reserve, central Italy): Evidencing patterns following a dominance/diversity approach. Avocetta 36:97–102.
- Baghino L. 2013. Dati ecologici preliminari e indici della comunità ornitica nidificante in tre foreste regionali del Parco Naturale dell’Aveto (GE). Picus 39(75):5–14.
- Bani L, Luppi M, Rocchia E, Winners E, Dondina O, Orioli V. 2019. How the elevational range of breeding birds on Alps has varied over the past four decades due to climate and habitat changes. Ecology and Evolution 9:1289–1305. DOI: 10.1002/ece3.4838.
- Bellomo D. 2006. Gli uccelli come indicatori ambientali. APAT Agenzia per la protezione dell’ambiente e per i servizi tecnici. Roma, Italy.
- Berg Å. 1997. Diversity and abundance of birds in relation to forest fragmentation, habitat quality and heterogeneity. Bird Study 44(3):355–366. DOI: 10.1080/00063659709461071.
- Bermejo A. 2010. Bird number 2010 “Monitoring, indicators and targets”. Book of abstracts of the 18th Conference of the European Bird Census Council, SEO/BirdLife, Cáceres, Spain.
- Bernoni M, Sorace A, Cecere J, Biondi M, Cento M, Guerrieri G, Savo E. 2012. La comunità degli uccelli nidificanti nella ZPS-603005 “Comprensorio Tolfetano-Cerite-Manziano” (Lazio). Alula XIX(1–2):11–27.
- Beskardes V, Keten A, Kumbasli M, Pekin B, Yilmaz E, Makineci E, Ozdemir E, Zengin H. 2018. Bird composition and diversity in oak stands under variable coppice management in Northwestern Turkey. IForest-Biogeosciences and Forestry 11:58–63. DOI: 10.3832/ifor2489-010.
- Bettini G, Gargani B. 2009-2010. Relazione Monitoraggio Ornitologico nel sito “Monte La Croce” Sambuca Pistoiese (Pt) – CONSIAG. Availbale: www.regione.toscana.it›documents›studioavifauna.pdf.
- Bibby CJ, Burgess ND, Hill DA. 1992. Bird census techniques. London, UK: Accademic Press.
- Blondel J, Ferry C, Frochot B. 1981. Point counts with unlimited distance. Studies in Avian Biology 6:414–420.
- Brichetti P, Gariboldi A. 1997. Manuale pratico di ornitologia. Bologna, Italy: Edagricole.
- Brunelli M, Cento M, De Santis E, Savo E. 2015. Breeding bird community of the Montagne della Duchessa (Latium, central Italy). Avocetta 39:19–28.
- Cambi D, Micheli A. 1985. L’avifauna nidificante della «Corna di Savallo» (Prealpi bresciane, Lombardia): Censimento ed ecologia. «NATURA BRESCIANA». Annali del Museo Civico di Scienze Naturali di Brescia 22(1986):103–178.
- Ciancio O. 2009. Riserva Naturale Statale Biogenetica di Vallombrosa. Piano di Gestione e Silvomuseo 2006-2025. Firenze: Tipografia Coppini.
- Dawson DG. 1981. Counting birds for a relative measure (index) of density. Studies in Avian Biology 6:12–16.
- Domokos E, Domokos J. 2016. Bird communities of different woody vegetation types from the Niraj Valley, Romania. Turkish Journal of Zoology 40:734–742. DOI: 10.3906/zoo-1510-64.
- Dorst J. 1982. La vita degli uccelli. Milan, Italy: Ed. Garzanti.
- Farina A. 1987. Autumn‐winter structure of bird communities in selected habitats of Tuscany (Italy). Italian Journal of Zoology 54:243–249.
- Farina A, Brogi L. 1995. Struttura e dinamica delle comunità di uccelli in tre aree del demanio forestale della Regione Toscana, Regione Toscana, Giunta regionale, Progetto “Recupero e conservazione della naturalità”, Litografia della Giunta regionale, Firenze. 81 pp.
- Forconi P. 2018. An altitudinal gradient for breeding birds in Marche Region (Central Italy). In: Pedrotti F, editor. Climate gradients and biodiversity in mountains of Italy. Geobotany 800 studies (basics, methods and case studies). Cham, CH: Springer. pp. 187–198. DOI: 10.1007/978-3-319-67967-9_10.
- Fulco E, Tellini Florenzo G. 2008. Composizione e struttura della comunità ornitica nidificante in una faggeta della Basilicata. Avocetta 32:55–60.
- Furness RW, Greenwood JJD. 1994. Birds as monitors of environmental change. London, UK: Chapman & Hall.
- Gustin M, Di Federico A. 2016. La comunitá ornitica nidificante nelle più importanti tipologie forestali nel comune di Fontecchio (L’Aquila, Abruzzo): composizione e struttura. Avalaible: http://www.mediterraneanmosaics.org/wp-content/uploads/2016/11/report-comunit%C3%A0-ornitica.pdf.
- Gustin M, Sorace A, Iavicoli D, Romano C. 2015. Rapporto finale sul monitoraggio dell’avifauna della Riserva Naturale Sentina nel 2014. Available: https://www.riservasentina.it/media/uploads/Rapporto-su-monitoraggio-avifauna-anno-2014.pdf.
- He X, Luo K, Brown C, Lin L. 2018. A taxonomic, functional, and phylogenetic perspective on the community assembly of passerine birds along an elevational gradient in southwest China. Ecology and Evolution 8:2712–2720. DOI: 10.1002/ece3.3910.
- Hubalek Z. 2000. Measures of species diversity in ecology: An evaluation. Folia Zoologica 49(4):241–260.
- ISPRA. 2017. Linee guida per l’analisi e la caratterizzazione delle componenti ambientali a supporto della valutazione e redazione dei documenti della VAS. Available: http://www.isprambiente.gov.it/files/pubblicazioni/manuali-lineeguida/MLG_148_17_LGVAS.pdf.
- JMP®. 2012. Version 10.0.2. Cary, NC: SAS Institute Inc. pp. 1989–2019.
- Klingbeil BT, Willig MR. 2015. Bird biodiversity assessments in temperate forest: The value of point count versus acoustic monitoring protocols. PeerJ 3:e973. DOI: 10.7717/peerj.973.
- Laiolo P. 2005. Spatial and seasonal patterns of bird communities in Italian Agroecosystems. Conservation Biology 19(5):1547–1556. DOI: 10.1111/j.1523-1739.2005.004376.x.
- Laiolo P, Rolando A. 2005. Forest bird diversity and ski-runs: A case of negative edge effect. Animal Conservation 8(1):9–16. DOI: 10.1017/S1367943004001611.
- Lapini L, Tellini G. 1990. La comunità ornitica nidificante in una fustaia di Abete bianco dell’Appennino toscano. Rivista italiana di Ornitologia 60:64–70.
- Lloyd M, Ghelardi RJ. 1964. A table for calculating the “equitability” component of species diversity. Journal of Animal Ecology 33:217–225. DOI: 10.2307/2628.
- MacArthur RH, MacArthur JW. 1961. On bird species diversity. Ecology 42:594–598. DOI: 10.2307/1932254.
- Malavasi D. 1998. Osservazioni sulla comunità ornitica del Bosco Panfilia. Rivista italiana di Ornitologia 68:175–182.
- Marchesi L. 2007. Nuova vita intorno alla cava. (BACK TO NATURE Esperienze di ripristino ambientale). Natura Alpina, n.1/2: 41-47 Società di Scienze naturali del Trentino. Available: http://www.mtsn.tn.it/pubblicazioni/8/58a/MUSEO_nat_03.pdf.
- Martini I. 2011. Composizione e struttura della comunità ornitica nidificante nella Riserva Naturale Statale Biogenetica di Vallombrosa. Master’s thesis. Facoltà di Agraria: Università degli studi di Firenze.
- Martini I, Bartolozzi L, Sargentini C. 2013. Composizione e struttura della comunità ornitica nidificante nella Riserva Naturale Statale Biogenetica di Vallombrosa. Corpo Forestale dello Stato, Ufficio per la Biodiversità di Vallombrosa. Stia (AR), Italy: Corpo Forestale dello Stato, UTB Vallombrosa - Arti Grafiche Cianferoni.
- Martini I, Galipò G, Sargentini C. 2017. Specie ornitiche come bioindicatori nella Riserva Naturale Statale biogenetica di Vallombrosa. Raggruppamento Carabinieri Biodiversità. Florence, Italy: Corrado Tedeschi Editore.
- Massa B, Lo Valvo M, Catalisano A. 1989. Bird communities on Mount Etna (Sicily, Italy). Italian Journal of Zoology 4:349–356. DOI: 10.1080/11250008909355661.
- Massa R. 1998. L’avifauna minore. In: Simonetta AM, Dessì-Fulgheri F, editors. 1998 – Principi e tecniche di gestione faunistico-venatoria. Bologna, Italy: Ed. Greentime. p. 427.
- Nardo A. 2001. Ciclo annuale della comunità ornitica del Bosco Olmè di Cessalto (Veneto). Rivista italiana di Ornitologia 71:171–179.
- O’Connell TJ, Jackson LE, Brooks RP. 2000. Bird guilds as indicators of ecological condition in the central Appalachians. Ecological Applications 10:1706–1721. DOI: 10.1890/1051-0761(2000)010[1706:BGAIOE]2.0.CO;2.
- Oelke H. 1980. The bird structure of the central European spruce forest biome – as regarded for breeding bird censuses. Proceedings of the VI International Conference Bird Census Work, Gottingen, Germany. pp. 201–209.
- Padoa-Schioppa E, Baietto M, Massa R, Bottoni L. 2006. Bird communities as bioindicators: The focal species concept in agricultural landscapes. Ecological Indicators 6(1):83–93. DOI: 10.1016/j.ecolind.2005.08.006.
- Patrone G. 1970. Piano di assestamento delle Foreste di Vallombrosa e di S. Antonio per il quindicennio 1970-1984. Rome, Italy: Ministero dell’Agricoltura e delle Foreste, Azienda di Stato per le Foreste Demaniali.
- Pielou EC. 1966. The measurement of diversity in different types of biological collections. Journal of Theoretical Biology 13:131–144. DOI: 10.1016/0022-5193(66)90013-0.
- Pilastro A, Congiu L, Tallandini L, Turchetto M. 1993. The use of bird feathers for the monitoring of cadmium pollution. Archives of Environmental Contamination and Toxicology 24(3):355–358. DOI: 10.1007/BF01128733.
- Popy S, Bordignon L, Prodon R. 2010. A weak upward elevational shift in the distributions of breeding birds in the Italian Alps. Journal of Biogeography 37:57–67. DOI: 10.1111/j.1365-2699.2009.02197.x.
- Purroy FJ. 1975. Evolución anual de la avifauna de un bosque mixto de coniferas y frondosas en Navarra. Ardeola 21:669–697.
- Radhouani H, Poeta P, Goncalves A, Pacheco R, Sargo R, Igrejas G. 2012. Wild birds as biological indicators of environmental pollution: Antimicrobial resistance patterns of Escherichia coli and enterococci isolated from common buzzards (Buteo buteo). Journal of Medical Microbiology 61:837–843. DOI: 10.1007/BF01128733.
- Sargentini C, Tocci R, Martini A, Bozzi R. 2018. Morphological characterization of Amiata donkey through Multivariate analyses. Revista Brasileira de Zootecnia 47:1–10. DOI: 10.1590/rbz4720170310.
- Shannon CE, Weaver W. 1949. The mathematical theory of communication. Urbana: University of Illinois Press.
- Silbernagel J. 2003. Spatial theory in early conservation design: Examples from Aldo Leopold’s work. Landscape Ecology 18:635–664. DOI: 10.1023/B:LAND.0000004458.18101.4d.
- Sorace A, Corsetti L, Lanzuisi E. 2004. Le comunità ornitiche svernanti nel comprensorio dei Monti Lepini. Alula XI(1–2):119–133.
- Sorace A, Visentin M. 2007. Avian diversity on golf courses and surrounding landscapes in Italy. Landscape and Urban Planning 81:81–90. DOI: 10.1016/j.landurbplan.2006.10.014.
- Sposimo P. 1995. Indagine sull’avifauna nidificante nel complesso “Giogo-Casaglia” e nelle aree limitrofe, con particolare riguardo per le specie di maggiore interesse e gli ambienti funzionali alla loro conservazione. Available:: http://www.regione.toscana.it/documents/10180/24010/giogo-casaglia/6ff6a8db-e2d7-44f4-a7e7-3fb5924c18c6;jsessionid=09C7072CA691E6DB0E376678A8A15BE9.web-rt-as01-p1?version=1.0.
- STERNA 2018. Carta delle vocazioni faunistiche della Regione Emilia Romagna. Available: https://www.sterna.it/CartavocER/book/home.htm.
- Stolen ED, Breininger DR, Frederick PC. 2005. Using waterbirds as indicators in Estuarine Systems: Successes and Perils. In: Bartone S, editor. Estuarine indicators. Boca, Raton, FL: CRC Press. pp. 409–422.
- Tellini Florenzano G. 1999. Gli uccelli delle Foreste Casentinesi. Regione Toscana. Available: http://www.regione.toscana.it/documents/10180/24010/Gli+uccelli+delle+Foreste+Casentinesi/c495c8c0-fa42-445b-ab94-4099ef164764;version=1.0.
- Thompson FR, Burhans DE, Root B. 2002. Effects of point count protocol on bird abundance and variability estimates and power to detect population trends. Journal Field Ornithology 73(2):141–150. DOI: 10.1648/0273-8570-73.2.141.
- Turček FJ. 1956. Zur Frage der Dominanze in Vogelpopulationen. Waldhygiene 8:249–257.
- Villard MA. 1998. On forest-interior species, edge avoidance, area sensitivitj6 and Dogmas in Avian conservation. The Auk 115(3):801–805.
- Volpato GH, Lopes EV, Mendonça LB, Boçon R, Bisheimer MV, Serafini PP, Dos Anjos L. 2009. The use of the point count method for bird survey in the Atlantic forest. Zoologia 26(1):74–78. DOI: 10.1590/S1984-46702009000100012.
- Wiener N. 1948. Cybernetics, or control and communication in the animal and the machine. First ed. Cambridge, Massachusetts: The MIT Press.
- Wiens JA. 1992. The ecology of bird communities. Cambridge, Massachusetts: Cambridge University Press.