
Abstract
Molecular-based approaches for species identification and delimitation strongly rely, in terms of universality and efficiency, on the selected markers. Conventionally, when adopting a DNA barcoding approach to discriminate (or identify) metazoans species, the marker choice falls on the 658 base pair region at the 5ʹ end of the mitochondrial COI gene. However, a growing number of studies suggest to use alternative and more variable genetic regions, even from the same gene, such as the 3ʹ end of the COI. In this work, we compared the identification performance of the 5ʹ and 3ʹ end COI regions on a large sequence dataset of odonate species, an order of arthropods among the most studied in terms of conservation importance for aquatic ecosystems. The genetic datasets comprised a total of 236 specimens, 113 species, 51 genera and 12 families spanning the two odonate suborders Zygoptera and Anisoptera, and were analysed under an integrative multiple approach including descriptive statistics and variability of the sequences, phylogenetic reconstructions, DNA-based species delimitations, genetic distances, identification of diagnostic characters and saturation plots. All analyses were congruent in recovering the COI-3ʹ region to be slightly more variable than the COI-5ʹ one, and both regions showed a saturation of transversion at the third codon position. However, phylogenetic reconstructions, genetic distances, and diagnostic characters identification resulted in a similar discrimination power for the two COI regions. Therefore, the COI-3ʹ region does not add much information to the standard COI-5ʹ barcode region, which has in turn largely been demonstrated to successfully delineate invertebrate communities through DNA and eDNA metabarcoding, and to have a much more extensive taxonomic coverage in public databases. Overall, the DNA barcoding inventory assembled in this study will provide valuable insights into the systematics and conservation of many odonate species with implications for future DNA and eDNA monitoring-based studies.
Introduction
Odonata represent a moderately species-rich insect order encompassing two main suborders, namely Zygoptera (damselflies) and Anisoptera (dragonflies), including 3,216 and 3,092 species, respectively (Schorr & Paulson Citation2021). Although well-investigated since at least two centuries, odonates have become increasingly popular with both the scientific community and amateur naturalists in the last few decades, fueling the data availability and scientific production on this insect group (May 2019; Bried et al. Citation2020). Indeed, odonates show an extensive phenotypic and ecological diversity, as well as many evolutionary innovations, such as direct flight musculature, complex colour vision, secondary genitalia and complex life cycles, constituting unparalleled models for ecological and evolutionary studies (Córdoba-Aguilar Citation2008; Bybee et al. Citation2016). Additionally, their complex life cycles consisting in both freshwater and terrestrial phases, their interspecific variability in life-history traits and habitat preferences, and their fully predatory habits, make these insects important bioindicators of global change, especially in freshwater ecosystems (Dijkstra et al. Citation2014a; Hassall Citation2015; Termaat et al. Citation2019).
Although damselflies and dragonflies are readily detected and studied in the wild due to their large size and conspicuousness compared to other insects, their morphology-based surveying could be challenging and not always straightforward. This is due to the occurrence of cryptic species and difficulties in larval and exuvial identification, which determine that most of studies rely on adults and are restricted to the their (often short) flying period (e.g., Bried et al. Citation2012; Solano et al. Citation2018; Galimberti et al. Citation2021). Therefore, as in other insect orders (e.g., Lepidoptera, Platania et al. Citation2020; Coleoptera, Kajtoch et al. Citation2018; and Hymenoptera; Lecocq et al. Citation2020), the integration of morphology and DNA-based identification approaches represent a promising and powerful tool for rigorous species identification and surveying of odonates, also in well-investigated areas (e.g., in the Mediterranean, see Ferreira et al. Citation2014a; López-Estrada et al. Citation2020). DNA-based approaches strongly rely on the correct taxonomic identification of the organisms of interest, since misidentifications may cause taxonomic inconsistencies in reference databases, and the work done by specialized taxonomists is therefore crucial for the success of such methods (e.g., Salvi et al. Citation2020). Additionally, the success of DNA-based identification strategies implies a comprehensive knowledge of the genetic and geographic diversity of the group of interest (Meyer & Paulay Citation2005; Bergsten et al. Citation2012; Gaytán et al. Citation2020), as well as the choice of appropriate molecular markers, which should be easily amplifiable, evolve adequately fast, and show limited overlap between intra- and interspecific divergence (Ballare & Ware Citation2011; Ferreira et al. Citation2014b). A debate about what is the most suitable universal molecular marker for DNA barcoding in metazoans is still open, especially in environmental DNA (eDNA) metabarcoding studies (e.g., Deagle et al. Citation2014; Andújar et al. Citation2018). Traditionally, a 658 bp portion at the 5ʹ-end region of the cytochrome c oxidase subunit I gene (COI-5ʹ) has been widely used for DNA barcoding purposes in a broad range of taxa, and has been adopted as universal DNA barcoding marker by the “Consortium for the Barcode of Life” (Ratnasingham & Hebert Citation2007, Citation2013). More recently, a layered DNA barcoding approach (i.e. integration of more molecular markers) has also been proposed for a variety of taxa, with the aim to increase the descrimination power (e.g., Paknia et al. Citation2015; Stefanni et al. Citation2018).
Regarding Odonata, previous large-scale DNA-based works were based on the COI-5ʹ region (e.g., Rach et al. Citation2008; Damm et al. Citation2010; Koroiva & Kvist Citation2018; Galimberti et al. Citation2021), or on this region combined with other markers, such as a portion of the NADH dehydrogenase 1 (ND1) (e.g., Bergmann et al. Citation2013). Rach et al. (Citation2017) recently compared the discrimination power of these two regions and another portion of the COI gene, namely the 3ʹ-end region (COI-3ʹ). Specifically, they amplified the three regions for 130 odonate specimens belonging to 23 species, 12 genera and 6 families and compared their amplification success, variability, number of diagnostic characters, and possible nucleotide substitution saturation. According to their results, they concluded that the COI-3ʹ region showed the highest potential for discriminating closely related taxa, whereas the COI-5ʹ region was more difficult to amplify and experienced nucleotide substitution saturation at third codon positions. Therefore, they suggested the use of a layered DNA barcoding approach including this COI-3ʹ region to increase the identification success at the species level. Nevertheless, a recent comprehensive survey of Italian odonates based on the “traditional” COI-5ʹ region revealed the suitability of this region for accurate species-level identification and allowed to detect several “warnings”, which are mismatches between morphospecies assignment and DNA-based species delimitation (e.g., presence of cryptic lineages) (Galimberti et al. Citation2021).
For this reason, we extended the sampling of Rach et al. (Citation2017) by sequencing the COI-3ʹ region of several Italian samples, covering approximately 90% of the breeding Italian odonate species, including some of the warnings identified by Galimberti et al. (Citation2021), and retrieving other sequences from GenBank, obtaining a total dataset of 236 individuals belonging to 113 species. The newly generated datasets were used to perform a large-scale comparison of the two COI regions, based on the analysis of descriptive statistics and variability of the sequences, phylogenetic reconstructions and species delimitations, genetic distances, identification of diagnostic characters and saturation plots, and to eventually identify the region with the highest discrimination power for DNA barcoding and eDNA metabarcoding purposes.
Materials and methods
Sampling, PCRs and datasets assembling
Samples were collected in Italy during 2018–2019 by a network of professional and voluntary taxonomists in order to compile a first comprehensive DNA barcoding inventory for Italian Odonata (Galimberti et al. Citation2021). The Italian Ministry of the Environment, Land and Sea released a national permit for the collection of species included in European and Italian conservation directives or to collect samples in regional or national protected areas (Prot. n° 0031783.20-11-2019). Sampling details are publicly available in the BOLD Systems platform (https://www.boldsystems.org/index.php/MAS_Management_DataConsole?codes=ZPLOD). DNA extraction, as well as the sequencing of the COI-5ʹ region were already performed by Galimberti et al. (Citation2021). From this large dataset, a subset of 87 specimens belonging to 80 species, 34 genera, and 10 families was selected, representing approximately 90% of the breeding Italian odonate species, to amplify and sequence the COI-3ʹ region, named CO1b by Rach et al. (Citation2017) (Table S1). For each sample, a 629 bp fragment was amplified with the primers OdoCO1Fw and OdoCO1Rev (Rach et al. Citation2017), with the following PCR amplification conditions: 95°C for 3 min, 35 cycles at 95°C for 30 s, 53°C for 30s and 72°C for 60s, and a final extension at 72°C for 6 min. PCRs were conducted in a 25-μL reaction (including 10 ng of DNA as template) by using puReTaq Ready-To-Go PCR beads (Amersham Bioscience, Freiburg, Germany), according to the manufacturer’s instructions. After checking for amplicons presence and quality on 1.5% agarose gel, the sequencing was performed bi-directionally at Eurofins Genomics (Milan, Italy), with the same primers used for the PCRs. Consensus sequences were obtained by editing the electropherograms with Geneious 7 and, after primer trimming, the presence of open reading frames was verified. Newly-generated consensus sequences were deposited in the BOLD Systems platform (project code ZPLOD) and GenBank (accession numbers reported in Table S1).
To assemble the COI-3ʹ and COI-5ʹ datasets, we started our search by downloading all COI sequences of Odonata from BOLD (last accessed 20 September 2020), retaining only COI-3ʹ sequences (n = 639). Subsequently, we further reduced the dataset adopting the following stringent criteria. Sequences were kept only when showing no insertions/deletions, <1% of missing sites, and overlapping at least 500 bp with the COI-3ʹ region obtained in this study. Subsequently, COI-5ʹ sequences obtained from the same individuals were searched and the same criteria were applied to discard short and/or low-quality sequences. Additionally, the GenBank database (last accessed 20 September 2020) was explored to include sequences not deposited in BOLD and full mitochondrial genomes. Finally, sequences belonging to specimens not identified at the species level or with a possibly incorrect identification were also discarded, resulting in a total number of 149 sequences for each COI region obtained from public repositories. COI-5ʹ and COI-3ʹ sequences were aligned with MAFFT 7.110 (Katoh & Standley Citation2013) using the E-INS-i option, and split in Anisoptera and Zygoptera, resulting in the four datasets Zygoptera_COI-3ʹ, Anisoptera_COI-3ʹ, Zygoptera_COI-5ʹ, and Anisoptera_COI-5ʹ. The final datasets consisted of a total of 93 specimens (38 species, 17 genera and 5 families) for Zygoptera and 143 specimens (75 species, 34 genera and 7 families) for Anisoptera (Table S1).
The nomenclature used in this study follows the last update of the World Odonata List (Schorr & Paulson Citation2021).
Bioinformatic analyses
For each dataset, multiple analyses were run, namely descriptive statistics and variability of the sequences, phylogenetic reconstructions, genetic distances, identification of diagnostic characters and saturation plots.
General statistics and variability of the two COI regions for each dataset were calculated with DnaSP (Rozas et al. Citation2017) and included the number of sequences, sites, variable sites, mutations, parsimony informative sites, unique haplotypes, the haplotype and nucleotide diversity, and the average interspecific K2P genetic distances.
Phylogenetic trees were reconstructed using both Bayesian inference (BI) and maximum likelihood (ML). For the sake of clarity, the aim of these analyses was not to obtain accurate phylogenetic hypotheses, being the COI region not appropriate for this purpose, but to use the obtained trees as tools to visualize possible species delimitations (DeSalle & Goldstein Citation2019). Prior to performing the analyses, outgroup sequences were added to each dataset, as in Galimberti et al. (Citation2021). Specifically, the dragonfly Lindenia tetraphylla (Vander Linden, 1825) was used to root the Zygoptera trees, whereas the damselfly Nehalennia speciosa (Charpentier, 1840) was used to root the Anisoptera trees. All sequences were retained in the dataset, without removing identical haplotypes. Best-fit substitution models were determined using JModelTest 2 (Darriba et al. Citation2012), resulting in GTR+I+G for all datasets. BI analyses were run using MrBayes 3.2.6 (Ronquist et al. Citation2012): two independent runs for four Markov chains were conducted for 10 million generations, with trees sampled every 1000th generation, and burn-in set to 25%. Parameter estimates and convergence were checked using Tracer 1.6 (Rambaut et al. Citation2014). ML analyses were run with RAxML 8.2.9 (Stamatakis Citation2014) using 1000 bootstrap replicates. Additionally, two species delimitation analyses were performed, namely the distance-based Assemble Species by Automatic Partitioning (ASAP; Puillandre et al. Citation2021) and the tree-based single threshold Poisson Tree Process (PTP; Zhang et al. Citation2013). ASAP analyses were performed on the website https://bioinfo.mnhn.fr/abi/public/asap/using K2P distances, and considering only the partition showing the lowest asap-score. PTP analyses were run on the website https://mptp.h-its.org/using the rooted ML trees, after cropping the outgroups and selecting the single-threshold option (with p-value 0.001).
Interspecific K2P genetic distances were calculated for each COI region, both at the suborder and genus level. For the genus-level analyses, only genera represented by at least two species and two sequences were kept. Intraspecific K2P distances were also calculated for the species represented by at least two sequences. Genetic distances were calculated using MEGA X (Kumar et al. Citation2018) and were represented as boxplots using SPSS 25, with boxes showing the first and third quartiles, whiskers showing range values, horizontal lines indicating median values, and asterisks representing outliers. When the number of observations were >10, differences between the interspecific genetic distances based on the two COI regions were tested for each genus and whole dataset using one-way analysis of variance (ANOVA) when data were normally distributed (for the genus Sympetrum only), and non‐parametric Kruskal–Wallis tests when data were not normally distributed, using SPSS 25. Furthermore, ad hoc thresholds of intraspecific distances were calculated in the R environment (R Core Team Citation2020) for each suborder dataset, with the function “LocalMinima” in the package “spider” (Brown et al. Citation2012). The obtained values were then used in the function “treshOpt” (Brown et al. Citation2012) to compare the cumulative identification errors between COI regions, which are the sum of false-positive (no conspecific matches within the threshold) and false-negative (sequences from multiple species within the threshold) cases.
The identification of DNA diagnostic characters was performed using the package QUIDDICH (Kühn & Haase Citation2020) in the R environment. Specifically, the package was used to search for character attributes (i.e., single nucleotides) present in all members of a defined clade but absent in members of other clades. The analyses were run, for each dataset, considering three taxonomic ranks: i) genus, ii) family, and iii) suborder. Diagnostic characters were determined at the species level (genus) or, when possible, at the species and genus level (family and suborder).
Finally, the number of transitions and transversions versus divergence was plotted for each dataset and also considering all odonate sequences together (keeping the two COI regions separate), in order to obtain a representation of substitution saturation at all sites, first and second codon position, and third codon position alone, using DAMBE (Xia & Xie Citation2001). Second-order polynomial regression lines were fitted to the transition and transversion data of each saturation plot. The K2P distance was used as a measure of divergence. If no saturation occurs, both the transitional and transversional substitutions are expected to increase with K2P, whereas when the slope of the regression line is zero or negative the data can be considered affected by saturation (Xia Citation2000).
Results
Overall, the amplification success of both COI regions was high (98% for COI-5ʹ and 90% for COI-3ʹ, considering a total of 97 tested samples). However, for three species [Calopteryx virgo (Linnaeus, 1758), Diplacodes lefebvrii (Rambur, 1842), and Sympetrum flaveolum (Linnaeus, 1758)], despite multiple retrials, the amplification of the COI-3ʹ region was not successful, or the obtained sequences included stop codons or were not readable, whereas good quality COI-5ʹ sequences were obtained for all the analysed specimens. Species were included in datasets only when the two COI regions were sequenced from the same specimen, and the final datasets consisted of a total of 93 specimens (38 species, 17 genera and 5 families) for Zygoptera and 143 specimens (75 species, 34 genera and 7 families) for Anisoptera.
The two COI regions showed similar values in the general statistics, with the COI-3ʹ region being generally more variable than the COI-5ʹ region (). Indeed, the 3ʹ region, despite being shorter than the 5ʹ region (629 vs 658 bp), showed a higher number of variable sites, parsimony informative sites, and unique haplotypes, as well as a higher nucleotide and haplotype diversity and a higher average interspecific K2P distance, for both Zygoptera and Anisoptera ().
Table I. General statistics and variability of the two COI regions for each suborder of odonates
The reconstructed BI and ML phylogenetic trees based on both COI regions showed some differences in terms of topology and nodal support, especially regarding deeper relationships (BI trees with both Bayesian posterior probabilities and ML bootstrap values are reported as supplementary material; Figures S1-S4). Notably, phylogenetic trees were reconstructed only for species delimitation purposes and not to reconstruct phylogenetic relationships among taxa (DeSalle & Goldstein Citation2019; Galimberti et al. Citation2021). Indeed, as expected, internal nodes were generally weakly supported, whereas more terminal nodes (i.e., species-level clusters) showed similar and higher levels of nodal support. Moreover, based on species delimitation analyses, similar warnings (i.e., mismatch between morphospecies assignment and DNA-based species delimitation) were detected, with limited variation between the two COI regions (Table S1). Specifically, both ASAP and PTP analyses revealed a total number of 109 species hypotheses based on the COI-5ʹ region, whereas the analysis of the COI-3ʹ region resulted in 104 and 110 species hypotheses based on the ASAP and PTP analyses, respectively (Table S1). For instance, regarding Zygoptera (Figures S1, S2; Table S1), Erythromma lindenii (Selys, 1840), Pseudagrion kersteni (Gerstäcker, 1869), and Pseudagrion bicoerulans Martin, 1906 showed a further genetic structure in all analyses but the COI-3ʹ ASAP, whereas Ischnura genei (Rambur, 1842) was not separated from I. elegans (Vander Linden, 1820) and Pseudagrion niloticum Dumont, 1978 was not distinguishable from P. acaciae Förster, 1906, as already shown in Galimberti et al. (Citation2021) and Rach et al. (Citation2008). In Anisoptera (Figures S3, S4), Anax imperator Leach in Brewster, 1815 and A. parthenope (Selys, 1839) were not distinguishable according to DNA data, similarly to Somatochlora metallica (Vander Linden, 1825) and S. meridionalis Nielsen, 1935, as recently shown by Galimberti et al. (Citation2021).
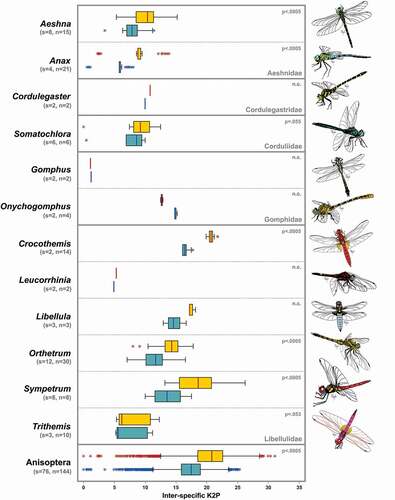
The comparison of genetic distances revealed that the COI-3ʹ region was in most cases characterised by higher interspecific distances, both at genus and suborder level (). A statistical test, performed for three out of nine genera in Zygoptera (), resulted in significantly higher values for the COI-3ʹ K2P genetic distances in Pseudagrion (p = 0.001), Lestes (p < 0.01), and whole Zygoptera (p < 0.0005), but not in Coenagrion (p = 0.52). Regarding Anisoptera, the same test performed for seven genera out of 12 () showed that COI-3ʹ K2P distances were significantly higher than COI-5ʹ ones in Aeshna (p < 0.0005), Anax (p < 0.0005), Crocothemis (p < 0.0005), Orthetrum (p < 0.0005), Sympetrum (p < 0.0005) and in the whole suborder (p < 0.0005), but not in Somatochlora (p = 0.055) and Trithemis (p = 0.053). Regarding intraspecific distances, a comparison was possible for a subset of the species used to calculate interspecific distances, belonging to four Zygoptera genera and six Anisoptera genera (Figure S5). The ad hoc thresholds varied among suborders and regions, with Anisoptera and COI-3ʹ datasets showing the highest values (Table S2). However, the identification performance was identical for the two COI regions in Zygoptera, with a cumulative error of 20.4% in both datasets. Similarly, only a slight difference was observed in the cumulative errors in Anisoptera datasets (COI-3ʹ = 23.1% and COI-5ʹ = 22.4%) (Table S2).
Diagnostic characters were detected in sequences of all species of Anisoptera and Zygoptera, using both COI-3ʹ and COI-5ʹ datasets (Files S1-S6). Specifically, when working at the genus level, diagnostic characters were found for all species, but when the taxonomic context was widened (family level), the number of diagnostic characters decreased dramatically, being in many cases zero when using all the suborder sequences (Table S3). Focusing on the genus level, the analyses of both COI regions revealed a similar number of diagnostic characters for each species, with slightly higher numbers for the COI-3ʹ region, especially in Anisoptera (Table S3).
In most cases, nucleotide substitution saturation was not observed for both regions (neither for transition nor transversion), specifically when analysing all codons together and the combined first and second codon positions (Figures S6a-d, S7a-d, S8a-d). When analysing the third codon position alone, no saturation of transitions was observed, but a saturation of transversions occurred in all cases (Figures S6e-f, S6e-f, S7e-f), especially considering all Zygoptera and Anisoptera sequences together (Figure S8e-f). Therefore, the two COI regions showed an overall similar pattern of saturation of transversions at the third codon position.
Figure 1. Boxplots of the inter-specific K2P distances of COI-3ʹ (yellow) and COI-5ʹ (blue) regions among congenerics divided by family, and in the whole suborder Zygoptera. Boxes show the first and third quartiles, whiskers show range values, horizontal lines indicate median values, and asterisks represent outliers. At the top-right, the p-value of comparisons between the two regions is shown, when available. s: number of species; n: number of sequences; n.c.; not calculable
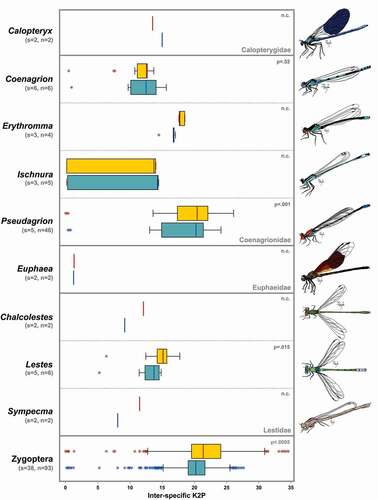
Figure 2. Boxplots of the inter-specific K2P distances of COI-3ʹ (yellow) and COI-5ʹ (blue) regions among congenerics divided by family, and in the whole suborder Anisoptera. Boxes show the first and third quartiles, whiskers show range values, horizontal lines indicate median values, and asterisks represent outliers. At the top-right, the p-value of comparisons between the two regions is shown, when available. s: number of species; n: number of sequences; n.c.; not calculable
Discussion
The datasets assembled in this study allowed a detailed comparison of the nucleotide variability at the COI-5ʹ and COI-3ʹ regions to assess their differential performance in Odonata molecular identification. The addition of many new specimens, species, genera and families to the previous dataset explored by Rach et al. (Citation2017) confirmed only part of their results. Both studies agree in demonstrating that the COI-3ʹ region shows an overall variability higher than the COI-5ʹ one, in terms of number of variable sites, parsimony informative sites, haplotype and nucleotide diversity, genetic distances, and number of diagnostic characters. Rach et al. (Citation2017) also reported difficulties in the amplification of the COI-5ʹ region and described a saturation of transversions at the third codon position in this region, whereas no saturation was reported for the COI-3ʹ region. Conversely, in our expanded dataset, we did not find difficulties in the amplification of the COI-5ʹ region using the primer pair ODOF1_t1 and ODOR1_t1 (J. Semotok, unpublished data, Source: BOLD Systems primer database) or the alternative primer pair ODO_LCO1490d/ODO_HCO2198d (Dijkstra et al. Citation2014b) for the most recalcitrant cases (i.e., Calopteryx spp.) (see Galimberti et al. Citation2021 for further details). Overall, the amplification of the COI-5ʹ fragment actually outperformed the amplification of the COI-3ʹ region. Additionally, we observed similar patterns of saturation for both COI regions, with transversions at the third codon position being saturated in all datasets. These differences between the two studies could be due to the higher sampling size and to the wider taxonomic breadth covered by our datasets, along with the fact that the dataset analyzed by Rach et al. (Citation2017) covered in more detail the intraspecific variability of the selected species.
The phylogenetic reconstructions and the species delimitation analyses based on both COI regions allowed to define highly similar species boundaries, and consequently, also similar taxonomic warnings, such as the presence of possibly cryptic lineages or no inter-specific delimitation. Moreover, no differences in identification performance were observed between the two COI regions, with almost identical cumulative identification error values. Therefore, despite the higher variability and inter-specific genetic distances of the COI-3ʹ region, we did not find any substantial difference in the taxonomic discrimination power of the two COI regions, and the saturation patterns observed at the third codon position do not seem to influence the suitaibility of both regions for DNA barcoding purposes.
Considering the variability and discrimination power of the conventional COI-5ʹ barcode region, the fact that it has been largely demonstrated to be suitable for successfully delineating invertebrate communities through DNA and eDNA metabarcoding (e.g., Elbrecht et al. Citation2019; Hajibabaei et al. Citation2019), and the extensive geographic and taxonomic coverage of the available reference sequence databases (e.g., Koroiva & Kvist Citation2018), we suggest to keep the COI-5ʹ region as the standard DNA barcode for Odonata and to concentrate the future screening and sequencing efforts on the group to this region. Although efficient in terms of species identification and delimitation purpuses, the COI-3ʹ region does not add much information and shows a discrimination power very similar to that of the COI-5ʹ region, as shown also for other insect groups (e.g., Cywinska et al. Citation2010) and, therefore, its use in a layered DNA barcoding approach would probably not increase much the identification success. In this context, species delimitation is best addressed considering different sources of information, such as morphology, ecology but also multiple independent molecular markers which may also have a phylogenetic utility (Roe & Sperling Citation2007; Bybee et al. Citation2011; Cruaud et al. Citation2017). In this sense, the development of standardised nuclear markers, such as universal single-copy orthologs and ultraconserved elements, seems promising in implementing the power of DNA barcoding to delimit and identify species (Eberle et al. Citation2020; Gueuning et al. Citation2020), and has great potential also for DNA metabarcoding studies (Pierce Citation2019).
However, given its higher variability, the COI-3ʹ region may be useful as an additional source of genetic information to investigate, or better support, for instance, the intra-specific geographic structure of odonate species. In this context, since the development of the universal Jerry/Pat primer pair (Simon et al. Citation1994), the COI-3ʹ region has been used in several studies focusing on different orders of arthropods, such as Orthoptera, Coleoptera, Lepidoptera, Diptera and Hymenoptera (e.g., Ribera et al. Citation2008; Kodandaramaiah & Wahlberg Citation2009; Lecocq et al. Citation2013; Reemer & Ståhls Citation2013; Dorková et al. Citation2020). Another field of application of this alternative region could be the development of suitable Real-Time PCR markers, alternative or additional to those usually designed on the conventional COI-5ʹ barcode or on other mtDNA or nuclear DNA loci, for the rapid and sensitive detection of target species in eDNA-based investigations.
Supplemental Material
Download PDF (651.4 KB)Supplemental Material
Download PDF (2.6 MB)Supplemental Material
Download MS Excel (118.1 KB)Acknowledgements
We are grateful to Daniele Baroni, Gaia Bazzi, Ivan Chiandetti, Andrea Corso, Vincenzo Ferri, Mirko Galuppi, Luca Ilahiane, Gianandrea La Porta, Lorenzo Laddaga, Federico Landi, Fabio Mastropasqua, Valerio Orioli, Samuele Ramellini, Roberto Santinelli, Giovanni Soldato and Salvatore Surdo for retrieving part of the investigated samples. We thank the association Odonata.it for warmly welcoming this project. The “Servizio Sviluppo Sostenibile e Aree Protette of Provincia Autonoma di Trento” allowed specimen collection in full-protected areas in Trentino (Prot. S175/2018/382452/17.11.2/LS/57EI); and the Italian Ministry of the Environment, Land and Sea released a national permit for the collection of species included in European and Italian conservation directives (Prot. 0031783.20-11-2019).
Disclosure statement
No potential conflict of interest was reported by the authors.
Data availability statement
All specimen data are accessible on BOLD (www.boldsystems.org) under the project name “ZPLOD - DNA barcoding Italian Odonata”. The data include collection locality, geographic coordinates, collector, identifier, voucher depository, BINs and other sampling details. Sequence data are available on BOLD and have also been deposited in GenBank (Accession numbers: MW377804-MW377890).
Supplementary material
Supplemental data for this article an be accessed here.
Related Research Data
References
- Andújar C, Arribas P, Yu DW, Vogler AP, Emerson BC. 2018. Why the COI barcode should be the community DNA metabarcode for the metazoa. Molecular Ecology 27(20):3968–3975. DOI: 10.1111/mec.14844.
- Ballare EF, Ware JL. 2011. Dragons fly, biologists classify: An overview of molecular odonate studies, and our evolutionary understanding of dragonfly and damselfly (Insecta: Odonata) behavior. International Journal of Odonatology 14(2):137–147. DOI: 10.1080/13887890.2011.579538.
- Bergmann T, Rach J, Damm S, DeSalle R, Schierwater B, Hadrys H. 2013. The potential of distance-based thresholds and character-based DNA barcoding for defining problematic taxonomic entities by CO1 and ND1. Molecular Ecology Resources 13(6):1069–1081. DOI: 10.1111/1755-0998.12125.
- Bergsten J, Bilton DT, Fujisawa T, Elliott M, Monaghan MT, Balke M, Hendrich L, Geijer J, Herrmann J, Foster GN, Ribera I, Nilsson AN, Barraclough TG, Vogler AP. 2012. The effect of geographical scale of sampling on DNA barcoding. Systematic Biology 61(5):851–869. DOI: 10.1093/sysbio/sys037.
- Bried J, Ries L, Smith B, Patten M, Abbott J, Ball-Damerow J, Cannings R, Cordero-Rivera A, Córdoba-Aguilar A, De Marco Jr P, Dijkstra KD, Dolný A, Van Grunsven R, Halstead D, Harabiš F, Hassall C, Jeanmougin M, Jones C, Juen L, Kalkman V, Kietzka G, Mazzacano CS, Orr A, Perron MA, Rocha-Ortega M, Sahlén G, Samways M, Siepielski A, Simaika J, Suhling F, Underhill L, White E. 2020. Towards global volunteer monitoring of odonate abundance. BioScience 70(10):914–923. DOI: 10.1093/biosci/biaa092.
- Bried JT, D’Amico F, Samways MJ. 2012. A critique of the dragonfly delusion hypothesis: Why sampling exuviae does not avoid bias. Insect Conservation and Diversity 5(5):398–402. DOI: 10.1111/j.1752-4598.2011.00171.x.
- Brown SD, Collins RA, Boyer S, Lefort MC, Malumbres-Olarte J, Vink CJ, Cruickshank RH. 2012. Spider: An R package for the analysis of species identity and evolution, with particular reference to DNA barcoding. Molecular Ecology Resources 12(3):562–565. DOI: 10.1111/j.1755-0998.2011.03108.x.
- Bybee S, Córdoba-Aguilar A, Duryea MC, Futahashi R, Hansson B, Lorenzo-Carballa MO, Schilder R, Stoks R, Suvorov A, Svensson EI, Swaegers J, Takahashi Y, Watts PC, Wellenreuther M. 2016. Odonata (dragonflies and damselflies) as a bridge between ecology and evolutionary genomics. Frontiers in Zoology 13:46. DOI: 10.1186/s12983-016-0176-7.
- Bybee SM, Bracken-Grissom H, Haynes BD, Hermansen RA, Byers RL, Clement MJ, Udall JA, Wilcox ER, Crandall KA. 2011. Targeted amplicon sequencing (TAS): A scalable next-gen approach to multilocus, multitaxa phylogenetics. Genome Biology and Evolution 3:1312–1323. DOI: 10.1093/gbe/evr106.
- Córdoba-Aguilar A. 2008. Dragonflies and damselflies: Model organisms for ecological and evolutionary research. Oxford, England: Oxford University Press. DOI: 10.1093/acprof:oso/9780199230693.001.0001.
- Cruaud P, Rasplus JY, Rodriguez LJ, Cruaud A. 2017. High-throughput sequencing of multiple amplicons for barcoding and integrative taxonomy. Scientific Reports 7(1):41948. DOI: 10.1038/srep41948.
- Cywinska A, Hannan MA, Kevan PG, Roughley RE, Iranpour M, Hunter FF. 2010. Evaluation of DNA barcoding and identification of new haplomorphs in Canadian deerflies and horseflies. Medical and Veterinary Entomology 24(4):382–410. DOI: 10.1111/j.1365-2915.2010.00896.x.
- Damm S, Schierwater B, Hadrys H. 2010. An integrative approach to species discovery in odonates: From character-based DNA barcoding to ecology. Molecular Ecology 19(18):3881–3893. DOI: 10.1111/j.1365-294X.2010.04720.x.
- Darriba D, Taboada GL, Doallo R, Posada D. 2012. jModelTest 2: More models, new heuristics and parallel computing. Nature Methods 9(8):772. DOI: 10.1038/nmeth.2109.
- Deagle BE, Jarman SN, Coissac E, Pompanon F, Taberlet P. 2014. DNA metabarcoding and the cytochrome c oxidase subunit I marker: Not a perfect match. Biology Letters 9(9):20140562. DOI: 10.1098/rsbl.2014.0562.
- DeSalle R, Goldstein PZ. 2019. Review and interpretation of trends in DNA barcoding. Frontiers in Ecology and Evolution 7:302. DOI: 10.3389/fevo.2019.00302.
- Dijkstra KDB, Kalkman VJ, Dow RA, Stokvis FR, Van Tol JAN. 2014b. Redefining the damselfly families: A comprehensive molecular phylogeny of Z ygoptera (O donata). Systematic Entomology 39(1):68–96. DOI: 10.1111/syen.12035.
- Dijkstra KDB, Monaghan MT, Pauls SU. 2014a. Freshwater biodiversity and aquatic insect diversification. Annual Review of Entomology 59(1):143–163. DOI: 10.1146/annurev-ento-011613-161958.
- Dorková M, Krištín A, Jarčuška B, Kaňuch P. 2020. The mosaic distribution pattern of two sister bush-cricket species and the possible role of reproductive interference. Ecology and Evolution 10(5):2570–2578. DOI: 10.1002/ece3.6086.
- Eberle J, Ahrens D, Mayer C, Niehuis O, Misof B. 2020. A plea for standardized nuclear markers in metazoan DNA taxonomy. Trends in Ecology & Evolution 35(4):336–345. DOI: 10.1016/j.tree.2019.12.003.
- Elbrecht V, Braukmann TWA, Ivanova NV, Prosser SWJ, Hajibabaei M, Wright M, Zakharov EV, Hebert PDN, Steinke D. 2019. Validation of COI metabarcoding primers for terrestrial arthropods. PeerJ 7:e7745. DOI: 10.7717/peerj.7745.
- Ferreira S, Lorenzo-Carballa MO, Torres-Cambas Y, Cordero-Rivera A, Thompson DJ, Watts PC. 2014b. New EPIC nuclear DNA sequence markers to improve the resolution of phylogeographic studies of coenagrionids and other odonates. International Journal of Odonatology 17(2–3):135–147. DOI: 10.1080/13887890.2014.950698.
- Ferreira S, Velo-Anton G, Brochard C, Vieira C, Alves PC, Thompson DJ, Watts PC, Brito JC. 2014a. A Critically Endangered new dragonfly species from Morocco: Onychogomphus boudoti sp. nov. (Odonata: Gomphidae). Zootaxa 3856(3):349–365. DOI: 10.11646/zootaxa.3856.3.3.
- Galimberti A, Assandri G, Maggioni D, Ramazzotti F, Baroni D, Bazzi G, Chiandetti I, Corso A, Ferri V, Galuppi M, Ilahiane L, La Porta G, Laddaga L, Landi F, Mastropasqua F, Ramellini S, Santinelli R, Soldato G, Surdo S, Casiraghi M. 2021. Italian odonates in the Pandora’s box: A comprehensive DNA barcoding inventory shows taxonomic warnings at the Holarctic scale. Molecular Ecology Resources 21(1):183–200. DOI: 10.1111/1755-0998.13235.
- Gaytán Á, Bergsten J, Canelo T, Pérez‐Izquierdo C, Santoro M, Bonal R. 2020. DNA Barcoding and geographical scale effect: The problems of undersampling genetic diversity hotspots. Ecology and Evolution 10(19):10754–10772. DOI: 10.1002/ece3.6733.
- Gueuning M, Frey JE, Praz C. 2020. Ultraconserved yet informative for species delimitation: Ultraconserved elements resolve long-standing systematic enigma in Central European bees. Molecular Ecology 29(21):4203–4220. DOI: 10.1111/mec.15629.
- Hajibabaei M, Porter TM, Wright M, Rudar J. 2019. COI metabarcoding primer choice affects richness and recovery of indicator taxa in freshwater systems. PLoS One 14(9):e0220953. DOI: 10.1371/journal.pone.0220953.
- Hassall C. 2015. Odonata as candidate macroecological barometers for global climate change. Freshwater Science 34(3):1040–1049. DOI: 10.1086/682210.
- Kajtoch Ł, Montagna M, Wanat M. 2018. Species delimitation within the Bothryorrhynchapion weevils: Multiple evidence from genetics, morphology and ecological associations. Molecular Phylogenetics and Evolution 120:354–363. DOI: 10.1016/j.ympev.2017.12.022.
- Katoh K, Standley DM. 2013. MAFFT multiple sequence alignment software version 7: Improvements in performance and usability. Molecular Biology and Evolution 30(4):772–780. DOI: 10.1093/molbev/mst010.
- Kodandaramaiah U, Wahlberg N. 2009. Phylogeny and biogeography of Coenonympha butterflies (Nymphalidae: Satyrinae) - Patterns of colonization in the Holarctic. Systematic Entomology 34:315–323. DOI: 10.1111/j.1365-3113.2008.00453.x.
- Koroiva R, Kvist S. 2018. Estimating the barcoding gap in a global dataset of cox1 sequences for Odonata: Close, but no cigar. Mitochondrial DNA Part A 29(5):765–771. DOI: 10.1080/24701394.2017.1357709.
- Kühn AL, Haase M. 2020. QUIDDICH: QUick IDentification of DIagnostic CHaracters. Journal of Zoological Systematics and Evolutionary Research 58(1):22–26. DOI: 10.1111/jzs.12347.
- Kumar S, Stecher G, Li M, Knyaz C, Tamura K. 2018. MEGA X: Molecular evolutionary genetics analysis across computing platforms. Molecular Biology and Evolution 35(6):1547–1549. DOI: 10.1093/molbev/msy096.
- Lecocq T, Biella P, Martinet B, Rasmont P. 2020. Too strict or too loose? Integrative taxonomic assessment of Bombus lapidarius complex (Hymenoptera: Apidae). Zoologica Scripta 49(2):187–196. DOI: 10.1111/zsc.12402.
- Lecocq T, Vereecken NJ, Michez D, Dellicour S, Lhomme P, Valterova I, Rasplus JY, Rasmont P. 2013. Patterns of genetic and reproductive traits differentiation in mainland vs. Corsican Populations of Bumblebees. PLoS One 8(6):e65642. DOI: 10.1371/journal.pone.0065642.
- López-Estrada EK, Fernández JB, Cardo-Maeso N, Montejano ST, Diaz-Martinez C. 2020. Onychogomphus cazuma sp. nov. from Spain: Molecular and morphological evidence supports the discovery of a new European dragonfly species (Odonata: Gomphidae). Odonatologica 49:125–154. DOI: 10.5281/zenodo.3823337.
- May ML. 2019. Odonata: Who they are and what they have done for us lately: Classification and ecosystem services of dragonflies. Insects 10(3):62. DOI: 10.3390/insects10030062.
- Meyer CP, Paulay G. 2005. DNA barcoding: Error rates based on comprehensive sampling. PLoS Biology 3(12):e422. DOI: 10.1371/journal.pbio.0030422.
- Paknia O, Bergmann T, Hadrys H. 2015. Some ‘ant’swers: Application of a layered barcode approach to problems in ant taxonomy. Molecular Ecology Resources 15(6):1262–1274. DOI: 10.1111/1755-0998.12395.
- Pierce M. 2019. Filling in the gaps: Adopting ultraconserved elements alongside COI to strengthen metabarcoding studies. Frontiers in Ecology and Evolution 7:469. DOI: 10.3389/fevo.2019.00469.
- Platania L, Vodă R, Dincă V, Talavera G, Vila R, Dapporto L. 2020. Integrative analyses on Western Palearctic Lasiommata reveal a mosaic of nascent butterfly species. Journal of Zoological Systematics and Evolutionary Research 58(4):809–822. DOI: 10.1111/jzs.12356.
- Puillandre N, Brouillet S, Achaz G. 2021. ASAP: Assemble species by automatic partitioning. Molecular Ecology Resources 21(2):609–620. DOI: 10.1111/1755-0998.13281.
- R Core Team. 2020. R: A language and environment for statistical computing. Vienna, Austria: R Foundation for Statistical Computing. Available: https://www.R-project.org/.
- Rach J, Bergmann T, Paknia O, DeSalle R, Schierwater B, Hadrys H. 2017. The marker choice: Unexpected resolving power of an unexplored CO1 region for layered DNA barcoding approaches. PLoS One 12(4):e0174842. DOI: 10.1371/journal.pone.0174842.
- Rach J, DeSalle R, Sarkar IN, Schierwater B, Hadrys H. 2008. Character-based DNA barcoding allows discrimination of genera, species and populations in Odonata. Proceedings of the Royal Society B: Biological Sciences 275(1632):237–247. DOI: 10.1098/rspb.2007.1290.
- Rambaut A, Suchard MA, Drummond AJ 2014. Tracer v1.6. Available from http://beast.bio.ed.ac.uk/Tracer
- Ratnasingham S, Hebert PD. 2007. BOLD: The barcode of life data system. Molecular Ecology Notes 7(3):355–364. DOI: 10.1111/j.1471-8286.2006.01678.x.
- Ratnasingham S, Hebert PD. 2013. A DNA-based registry for all animal species: The Barcode Index Number (BIN) system. PLoS One 8(7):e66213. DOI: 10.1371/journal.pone.0066213.
- Reemer M, Ståhls G. 2013. Phylogenetic relationships of Microdontinae (Diptera: Syrphidae) based on molecular and morphological characters. Systematic Entomology 38(4):661–688. DOI: 10.1111/syen.12020.
- Ribera I, Vogler AP, Balke M. 2008. Phylogeny and diversification of diving beetles (Coleoptera: Dytiscidae). Cladistics 24(4):563–590. DOI: 10.1111/j.1096-0031.2007.00192.x.
- Roe AD, Sperling FA. 2007. Patterns of evolution of mitochondrial cytochrome c oxidase I and II DNA and implications for DNA barcoding. Molecular Phylogenetics and Evolution 44(1):325–345. DOI: 10.1016/j.ympev.2006.12.005.
- Ronquist F, Teslenko M, Van Der Mark P, Ayres DL, Darling A, Höhna S, Larget B, Liu L, Suchard MA, Huelsenbeck JP. 2012. MrBayes 3.2: Efficient Bayesian phylogenetic inference and model choice across a large model space. Systematic Biology 61(3):539–542. DOI: 10.1093/sysbio/sys029.
- Rozas J, Ferrer-Mata A, Sánchez-DelBarrio JC, Guirao-Rico S, Librado P, Ramos-Onsins SE, Sánchez-Gracia A. 2017. DnaSP 6: DNA sequence polymorphism analysis of large data sets. Molecular Biology and Evolution 34(12):3299–3302. DOI: 10.1093/molbev/msx248.
- Salvi D, Berrilli E, D’Alessandro P, Biondi M. 2020. Sharpening the DNA barcoding tool through a posteriori taxonomic validation: The case of Longitarsus flea beetles (Coleoptera: Chrysomelidae). PLoS One 34(5):e0233573. DOI: 10.1371/journal.pone.0233573.
- Schorr M, Paulson D 2021. World Odonata list. Electronic Database. Available: https://www.pugetsound.edu/academics/academic-resources/slater-museum/biodiversity-resources/dragonflies/world-odonata-list2/. Accessed February 2021 1.
- Simon C, Frati F, Beckenbach A, Crespi B, Liu H, Flook P. 1994. Evolution, weighting, and phylogenetic utility of mitochondrial gene sequences and a compilation of conserved polymerase chain reaction primers. Annals of the Entomological Society of America 87(6):651–701. DOI: 10.1093/aesa/87.6.651.
- Solano E, Hardersen S, Audisio P, Amorosi V, Senczuk G, Antonini G. 2018. Asymmetric hybridization in Cordulegaster (Odonata: Cordulegastridae): Secondary postglacial contact and the possible role of mechanical constraints. Ecology and Evolution 8(19):9657–9671. DOI: 10.1002/ece3.4368.
- Stamatakis A. 2014. RAxML version 8: A tool for phylogenetic analysis and post-analysis of large phylogenies. Bioinformatics 30(9):1312–1313. DOI: 10.1093/bioinformatics/btu033.
- Stefanni S, Stanković D, Borme D, De Olazabal A, Juretić T, Pallavicini A, Tirelli V. 2018. Multi-marker metabarcoding approach to study mesozooplankton at basin scale. Scientific Reports 8(1):12085. DOI: 10.1038/s41598-018-30157-7.
- Termaat T, Van Strien AJ, Van Grunsven RHA, De Knijf G, Bjelke U, Burbach K, Conze KJ, Goffart P, Hepper D, Kalkman VJ, Motte G, Prins MD, Prunier F, Sparrow D, Van Den Top GG, Vanappelghem C, Winterholler M, WallisDeVries MF. 2019. Distribution trends of European dragonflies under climate change. Diversity & Distributions 25(6):936–950. DOI: 10.1111/ddi.12913.
- Xia X. 2000. Data analysis in molecular biology and evolution. Boston, USA: Kluver Academic Publishers. DOI: 10.1007/b113439.
- Xia X, Xie Z. 2001. DAMBE: Software package for data analysis in molecular biology and evolution. Journal of Heredity 92(4):371–373. DOI: 10.1093/jhered/92.4.371.
- Zhang J, Kapli P, Pavlidis P, Stamatakis A. 2013. A general species delimitation method with applications to phylogenetic placements. Bioinformatics 29(22):2869–2876. DOI: 10.1093/bioinformatics/btt499.