
Abstract
Although white stork Ciconia ciconia counts go back to the XIX century, making the species a model in population investigations, substantial gaps remain in the knowledge of its large-scale population dynamics. In particular, incomplete past estimates from the core breeding areas leave the long-term changes uncertain. In this paper, we provide the earliest estimation of population size and spatial distribution of the white stork in its main stronghold (Poland) to reconstruct the species long-term trends. Based on original survey data collected during the 2nd (1958, incomplete in Poland) and 3rd (1974, successful) International White Stork Census (IWSC) we compared stork numbers in a random sample of villages surveyed on both occasions. We applied linear models to estimate the population growth rate between 1958 and 1974 and to assess spatial variation in population change across the country. Finally, we collated worldwide stork numbers obtained from all IWSCs and discuss the long-term population trends in light of new data. The stork population in Poland in 1958 was estimated at 46,100 breeding pairs and the nationwide density at 14.7 pairs/100 km2. A strong decline (by 30.2%, 1.88% per year) was noted between 1958 and 1974 across Poland with prominent spatial variation reflecting differences in local densities. The strongest declines in absolute terms affected the most abundant populations in Eastern Poland. Our data show that in the mid-20th century, the stork population in Poland was close to the current level, but it experienced a massive decline during the 1960s–1980s. This decline was consistent with trends in the worldwide and regional European populations, contrary to earlier statements indicating limited, if any, changes in the core European area. Overall, our data expand knowledge on the long-term dynamics in the white stork numbers and show that even massive changes may easily go undetected if based on non-solid data.
Introduction
The white stork Ciconia ciconia (hereafter stork) is one of the few widespread, non-threatened bird species for which it is possible to make a nearly absolute assessment of the population size in areas reaching the size of countries and to track its long-term trends. Among wild animals, it is also one of the earliest-censused species. The first attempt of a large-scale inventory was made in 1876 in the former Galicia (S Poland) (Janota Citation1876), and inventories were then repeated many times in the entire species range. As a result, there are hundreds of census data available, carried out on various spatial and time scales. They show that the stork populations are very diverse in terms of density and population trends (Kaatz et al. Citation2017). The excessive amount of reliable data has also made the white stork a classical model species to investigate population fluctuations and other aspects of avian biology, thus appearing in many influential publications (e.g. Lack Citation1966; Perrins et al. Citation1991; Sæther et al. Citation2002; Chernetsov et al. Citation2006; Flack et al. Citation2018).
The International White Stork Census (IWSC) provides an overview of the regional and worldwide population dynamics of the species. To date, the censuses have been carried out seven times: in 1934, 1958, 1974, 1984, 1994/95, 2004/05 and 2014 (Tryjanowski et al. Citation2006). Unfortunately, despite adequate methodology, thousands of participants and institutions involved as well as substantial financial resources, the national counts were sometimes incomplete, and since 1974, the global population size could only be assessed four times. Interestingly, the last IWSC in 2014 also was not completed, so the current size of the global stork population remains unknown, although an increase is evident (Thomsen et al. Citation2017). For the European population, the first provisional population assessment from 1958 referred to 93,000 breeding pairs (Schüz & Szijj Citation1960). However, it was noted that this was a minimum number rather, since it was based on uncertain or incomplete country estimates, e.g. the largest (Polish) population was assumed to be only 10,000 pairs.
Feeding conditions in both the breeding and wintering areas and on the migration routes are considered responsible for the global and regional changes in the population size of the white stork (Bairlein Citation1991). However, its population dynamics is more complex and depends on a multitude of factors, whose individual impacts are often difficult to disentangle. Droughts and rainfalls in the African wintering quarters (Kanyamibwa et al. Citation1990; Kania Citation2006), weather conditions in the breeding areas in early spring and during the early nestling period (Kosicki Citation2012; Tobolka et al. Citation2018), mortality during migration (Schulz Citation1988; van den Bossche et al. Citation2002), habitat alterations associated with agricultural intensity (Johst et al. Citation2001; Janiszewski et al. Citation2014), industrialization and other anthropogenic influences – are all external factors known to shape stork’s population dynamics. Moreover, the strong density-dependence of the white stork (Sæther et al. Citation2006; Gadenne et al. Citation2014) also links population fluctuations with intra-specific factors, for instance age structure and competitive interactions, both affecting their productivity (Bocheński & Jerzak Citation2006; Kosicki & Kuźniak Citation2006). Data from various parts of the species range indicate that slower changes in abundance concern core areas, with dense populations, while smaller and unsaturated populations, subjected to the Allee effect, are characterized by the greater amplitude of changes in a short time (Schimkat Citation2004; Kaatz et al. Citation2017). One of the intriguing issues in stork population ecology is the unequal fluctuations of the nearby breeding populations, with seemingly similar external conditions (Tryjanowski et al. Citation2005; Sæther et al. Citation2006). The underlying mechanisms of these fluctuations often remain unrecognized; nevertheless, it seems appropriate to look for the reasons in factors that interact locally, e.g. in regional transformations of agricultural land. However, all these processes operate on a long-term perspective and were difficult to document in the past, including in the most densely populated parts of stork distribution, such as Central-Eastern Europe.
With its large area (312,679 km2), diverse habitats and regions of extensively managed farmland, Poland is of global importance for the white stork. Birds breeding in Poland are long-distance migrants, reaching their wintering grounds in East and South Africa via the easterly route along the coast of Levant. Individuals from western populations migrate across Straits of Gibraltar, although both migratory pools are not genetically distinct (Shephard et al. Citation2013) and contact in both breeding and overwintering areas. Ringing data and satellite tracking evidence confirm that individual white storks do show significant nest site philopatry and follow remarkably similar migration paths over many years (Berthold et al. Citation2004; Kania Citation2006). Indeed, in Poland, median dispersal distances from the natal sites are only 26 km (Chernetsov et al. Citation2006), yet an exchange of individuals hatched in Poland with storks from neighboring countries is not uncommon (Wuczyński Citation2005). An extremely distant natal dispersal concerned a bird that hatched in NE Poland and then was recorded breeding in SW France, 1897 km from the natal site (Kania Citation2006).
Poland has participated in each of the IWSC, but only four of them – 1974, 1984, 1994 and 2004 – allowed to assess the size of the Polish stork population. They showed that, compared to other countries, Poland is inhabited by the largest number of breeding pairs, accounting for almost a quarter of the global population and three-fourths of the Central European population (Profus Citation2006). North-eastern Poland is also the region with the highest large-scale densities, exceeding 50 pairs/100 km2 (Tomiałojć & Stawarczyk Citation2003). The census carried out in 1934 contained data concerning only a part (ca 120,000 km2) of the current Polish territory, which did not allow a comprehensive population assessment. Although the next census in 1958 was carried out throughout the territory of Poland and massive amounts of data were obtained, they were incomplete and not processed properly (Wuczyński et al. Citation2019, see below). As a consequence, the results of the 1958 census have never been published, except for a one-page note in a popular school journal (Szczepski Citation1968, referred also by Schüz & Szijj Citation1975). In contrast, the 3rd IWSC in 1974 exceeded all others in its cover and mass participation and is considered to be the most accurate to date. The stork population in Poland was then estimated at 32,200 breeding pairs, detailed regional numbers were also given, including density in each of over 300 counties (Jakubiec Citation1985a). Data from 1974 turned out to be helpful for retrospective estimation of the stork population in 1958.
With data reaching back to the mid-20th century, our study fits into the definition of historical ecology, a growing, but not yet fully established academic discipline (Szabó Citation2015). Since historical ecology is focused on the interconnectedness of nature and human culture, the white stork constitutes an excellent example to develop this new field of scientific endeavor. Covering long-term periods of time, its demography can potentially help understanding the consequences of past historical events for the current structure, function and management of ecosystems (Egan & Howell Citation2005).
The first goal of this work is to estimate, for the first time, the national population of the white stork in 1958 using a sample of survey data collected during the 2nd IWSC. By doing this, we intend to shift the knowledge about the white stork abundance in the past in a key part of its geographical range backwards by 16 years. We also determine spatial variation in densities of the white stork and regional population trends between 1958 and 1974. Differentiation of trends is indicated by more recent data from long-term plots (Tryjanowski et al. Citation2005), as well as contemporary nationwide monitoring data (Chylarecki et al. Citation2018). Therefore, we assume that the changes in numbers were also not uniform within the country in the past. Finally, we collate stork numbers obtained from all consecutive IWSCs conducted in Poland and elsewhere and discuss the long-term population changes in light of our new data. It is widely accepted that stork numbers declined between the 1930s and 1980s, particularly in the west (Schulz Citation2004). However, changes in the eastern source population were less clear due to the lack of reliable data from the main Polish stronghold and were temporarily assumed to be stable or increasing (Bairlein Citation1991). We, therefore, aim to give some new insight into regional long-term trends based on quantitative data.
Material and methods
Methods of the censuses in 1958 and 1974
To estimate the population size of the white stork in Poland in 1958 we used the results of both the 2nd and 3rd IWSC, therefore the methods used in both censuses are presented. The 2nd IWSC in 1958 was carried out by the questionnaire method (Wuczyński et al. Citation2019). The challenge was to reach the largest number of villages out of about 40,000 villages existing in Poland at that time. For this purpose, the questionnaire forms were addressed to the smallest administrative units of the time, called gromada, covering several villages. The direct recipients were teachers of rural schools, asked to provide information on the occurrence of the white storks in the subordinate school area, based on their own knowledge and interviews with pupils. The survey was preceded by press and radio census notices. In July 1958 the questionnaires were sent out to each of 8,339 gromadas, i.e. 94.9% of gromadas in Poland. Most of the questionnaires, i.e. 73.6% (6,139 gromadas) were returned by the end of the year. According to the superior administrative units, i.e. counties, questionnaires were received from 250 (77.6%) out of 322 rural counties existing in the country (Szczepski Citation1968).
Despite the large organizational effort and a fairly high return of questionnaires, the 1958 census failed. The reasons were large gaps in data, too complicated 4-page long questionnaire forms, their delayed distribution (during the school holiday period), and the lack of reference locations to determine the coverage of the questionnaire method. However, the underestimation of the scale of the entire undertaking was probably the main reason for the failure. With a high stork density, scarce organizational capacities of the post-war period, as well as a fledgling ornithological movement in Poland, the execution of a complete census was hardly realistic. As a result, the summary of the 2nd IWSC in Poland included only the number of counted nests, breeding success in these nests and their location (Szczepski Citation1968) but missed an attempt to assess the national stork population.
The experience gained in 1958 was used to improve the next census in 1974. The questionnaire method was also applied, but the forms were greatly simplified and sent in due time, at the end of June. This time, the addressees were leaders of individual villages. In addition, the survey reached them through local state administration bodies, which gave the campaign an official character (Jakubiec Citation1985a). 39,041 questionnaires were sent to all of 2,365 municipalities in Poland, i.e. larger administrative units that replaced gromadas, covering from one to several dozen villages. A high return rate of over 85% was achieved and only two out of 317 counties did not answer at all (Jakubiec Citation1985b).
Along with the questionnaire campaign, in 1974 and also 1975 stork counts were carried out in around 100 counties scattered across Poland, covering about 30% of its area. Dozens of ornithologists and amateur naturalists took part in the counts. The results from the 72 most thoroughly examined counties were compared with the questionnaire indicating its high accuracy (Jakubiec Citation1985b). As expected, the questionnaires underestimated the number of pairs, but the difference amounted to only 4% and was unrelated to the density of the white stork. Jakubiec (Citation1985b) also presented a detailed confrontation of both surveys and applied indicators correcting the questionnaire results, depending on both the percentage of returned questionnaires and stork density. The final effect of the 3rd IWSC in Poland was, among others, the first estimation of the total stork population in the country, as well as the number of breeding pairs and density in each county. The results were summarized in an extensive monograph (Jakubiec Citation1985a). We used these solid data in our retrospective analysis.
Other data on stork numbers
In order to present all the available data on the long-term dynamics of the stork population in Poland, we also used data collected within the national program, Monitoring of Birds of Poland (MBP). At present, this is the only source of information about the current nationwide population size, especially due to the incomplete IWSC in 2014. MBP is a program implemented annually since 2000, resulting from obligations imposed on each EU Member State, based on a consistent methodology of field research and analysis. Specifically, the white stork is monitored under the Flagship Species Monitoring (FSM) project (Chylarecki et al. Citation2018), covering 40–48 randomly distributed plots in Poland, each 100 km2 in size. Within each plot, all the stork nests are checked twice a season, in spring to determine nest occupancy rates and – in summer – to assess breeding success. In this paper, we used stork FSM data to show the most recent population assessment in Poland and to collate it with stork numbers in other countries.
Finally, we reviewed the scattered literature data from all successive IWSCs and showed quantitatively and graphically the changes in the world population as well as national populations of the white stork. The latter was done to compile the available information on stork numbers in 1958 in individual countries within the species range. Further, we compiled national assessments from countries belonging to two European regional sub-populations divided in line with metapopulation theory, i.e. the eastern core population, that also includes Poland, and the north-western peripheral population (Schulz Citation1999). For the last goal, only countries with a complete series of estimates from 1958 to 2014 were included.
Statistical approach
The population size in 1958
The population sizes in 1958 were backestimated using data from 28 counties chosen at random (). Within each selected county, we only included villages that were censused both in 1958 and 1974 and where the original questionnaires have been preserved (Table S1). The counties were thus treated as a random sample of locations, where the local population size was assessed on both occasions. The total area from which the data were used in the study was 27,488 km2 (range of county areas 424–1933 km2), included 784 villages (county range 8–49) and 977 nests counted in 1974 (county range 3–141, ~3% of the national population estimate in 1974) and 1251 in 1958 (county range 3–160).
Figure 1. The area of Poland divided into administrative units: voivodeships (thick lines) and counties (thin lines). Locations of 28 counties in which the white stork numbers of 1958 vs 1974 were compared are marked grey. Grey markings are adjusted to county borders from 1958
Estimation of population size in 1958
We applied linear models to estimate the rate of population growth (or, rate of change) between 1958 and 1974. The log of the ratio of white stork nest numbers in 1974 and 1958 represented the response. This allowed for an easy interpretation and retrospective estimation of population size in 1958 by simply dividing the 1974 census county-level results by the estimated rate. For example, if the number of nests in a hypothetical county was 100 and 70 in 1958 and 1974, respectively, the log of the growth rate was log(70/100) = log(0.7) = –0.357. Since growth rates were modelled as a function of latitude, longitude and density (see below), they were estimable for any given county. Therefore, provided the above value (log(0.7) = –0.357) and the population in a hypothetical county in 1974, e.g. 180 pairs, the expected population size in 1958 is estimated by dividing the population size in 1974 by the growth rate (i.e. 180/exp(–0.357) = 180/0.7 = 257 pairs).
Spatial variation in population growth rate
We modelled spatial variation in the rate of change across the country by allowing clinal (W-E and S-N) trends: geographical coordinates (latitude and longitude) of the county’s centre were included as predictors. Local density (number of pairs per 100 km2 in 1974) was included as the third predictor to reflect county-specific habitat quality and to capture density-dependent deviations from estimated spatial trends. The global model included these three predictors and the three 2-way interactions among them. Simpler (nested) models missed one or more terms and 18 models were fitted in total. All three predictors were scaled prior to analysis to help convergence. To get valid inference from our small sample (28 counties), we used the Bayesian mode of inference with Markov chain Monte Carlo (MCMC) methods to draw samples from the parameter posterior distributions. To express the absence of prior information on model parameters, we used vague, independent priors. Specifically, we chose uniform priors within the {-10, 10} range, which induce no information on parameter estimates. Three parallel chains were simulated in WinBUGS (Spiegelhalter et al. Citation2003) ran in the R environment (R Core Team Citation2018) via R2WinBUGS library (Sturtz et al. Citation2005). Simulations were set conservative with 5 million samples, a burn-in of 1 million and a thinning rate of 8,000 to ensure no autocorrelation in the posterior samples and reliable inference. Chain convergence was monitored visually and by Gelman–Rubin statistics (Ȓ): no issues were detected (all Ȓ values were <1.005), and desired posterior sample sizes (500 draws from each chain, 1,500 samples in total) were obtained. Predictions of population size in 1958 were obtained manually from parameter posterior distributions under each model: county-specific, local densities and geographical coordinates were used as new data to produce the expected rate of change for each county. Then, population sizes known from the 1974 census were divided by the estimated rates to get the county-level population sizes in 1958. We obtained model-averaged predictions by weighting predictions computed from individual models by model weights (obtained from deviance information criterion reported by WinBUGS). Summaries were presented with medians of the posterior distributions and 95% Bayesian credible intervals (95% BCI; Gelman & Hill Citation2007).
The population size in the 21st century
The annual data from the Flagship Species Monitoring (2001–2019; Chylarecki et al. Citation2018) were used to estimate national stork population size during the two recent decades. Since results obtained with FSM are counts (number of breeding pairs within each square), we applied a Poisson generalized linear mixed model with a log link to estimate mean stork numbers per square (100 km2) for each year and each of the two density zones. The zones were predefined based on 2004 IWSC. The high-density zone covered the long-recognized strongholds for the stork in Eastern Poland and contained counties with ≥30 pairs/100 km2 (total area 55 603 km2). The remaining part of the country had lower densities and represented the low-density zone (total area 250 082 km2). We again opted for Bayesian inference and fitted the model with the MCMCglmm package (Hadfield Citation2010) in R (R Core Team Citation2018). The fixed part of the model included effects of zone (two levels: high-density vs low-density) and year, while by including the plot random effect we accounted for non-independence of data points. We again used noninformative priors for all parameters, and because the model was less demanding computationally, we simulated three shorter chains (720,000 iterations each with first 120,000 discarded as a burn-in period, a thinning rate of 600 producing 1,000 samples per chain). Convergence was satisfactory as checked visually and with Gelman–Rubin statistics Ȓ computed with the coda package (Plummer et al. Citation2006; all Ȓ values <1.002). The total population size in Poland for each year was then obtained by multiplying the posterior distributions of stork densities (mean numbers per square) in each zone by the area of a zone and summing up results for both zones.
Results
Population growth rate and population size estimate in 1958
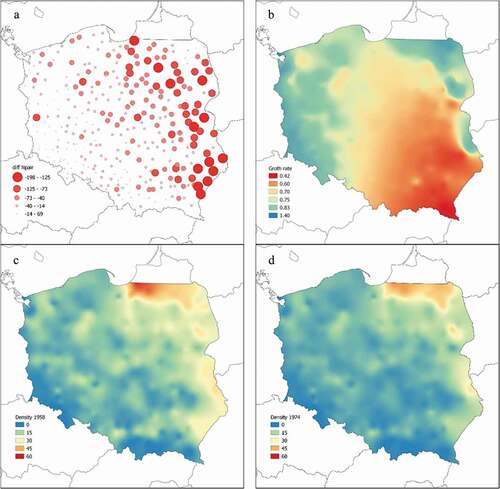
All models fitted to data were successful at predicting local, county-specific population sizes in 1958 () and agreed that the basal (i.e. average for the whole country, with deviations captured by the three predictors and their interactions) growth rates were less than one, clearly indicating a decline between 1958 and 1974. Posterior distributions of the basal growth rates varied only a little among models, peaking around 0.7, and 95% CrI maintained roughly between 0.60 and 0.86 (). This translates to a population decline of 15–40% over 16 years and an average annual growth rate, λ, of 0.978 (CrI: 0.968 to 0.991). In terms of absolute numbers, the strongest declines affected the highly abundant populations distributed widely across the eastern part of the country, where declines by 100–200 pairs per county were common (). The declines became smaller towards the west as most county populations in central and western Poland experienced drops by 15–70 pairs, which is not surprising, due to the smaller size of the local populations. Stable or increasing local populations, with growth rates estimated ≥1, were distributed exclusively along the western border and rarely in the north-eastern corner (). It needs to be stressed that the spatial pattern of decline in absolute numbers () is a product of both the spatial distribution of white stork in the country and the estimated growth rates. The strongest populations inhabit eastern Poland and become smaller towards the west, whereas the lowest estimated growth rates (meaning strongest decline relative to local population size) were noted in the area covering the south-eastern corner, extending north- and westwards to reach the central part of the country (). So, even a low, e.g. a 0.5 rate of change (meaning population was halved, i.e. a strong decline) when applied to a small – say 20 pairs – county population gives a decline by 10 pairs in absolute numbers. A much higher rate of 0.8 applied to a more abundant population of 375 pairs would result in a decline by 75 pairs in absolute numbers. Therefore, changes in absolute numbers and growth rates do not necessarily match () since a very low rate may result in small declines in absolute numbers and vice versa.
Table I. Summary of posterior distributions of model parameters. Means and 95% CrI are given on the log scale (growth rate parameter is also shown on normal scale). The growth rate is the estimated global rate of change between 1958 and 1974 (see Methods). Predictor abbreviations: LON: longitude; LAT: latitude; D: local density in 1974, “×” denotes an interaction term. Parameters non-overlapping with 0 are marked with bold font
Figure 2. Predictions of the 28 county-specific population sizes in 1958. Red crosses are the medians of the model-averaged distributions of the expected population size in 1958, computed for each of the 28 counties, small translucent “x” signs are the posterior estimates (1,500 for each county). The straight line indicates a 1:1 relationship (as if model predictions matched the observed truth ideally)
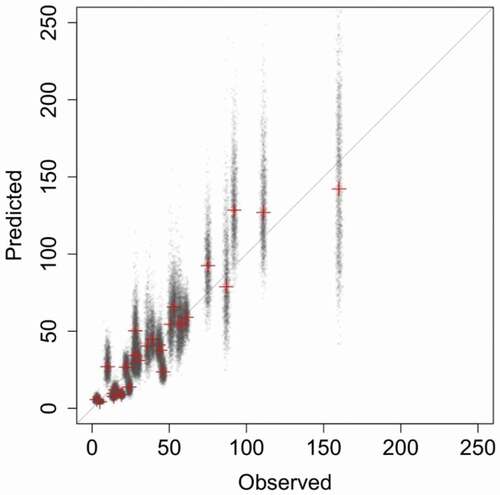
Figure 3. White stork population changes in Poland in absolute numbers (decline size in absolute numbers, pairs per county), (a), spatial distribution of growth rates (b), along with densities (pairs/100 km2) in 1958 (c) and 1974 (d)
The White stork population has been consistently estimated at over 40,000 pairs, depending on the model, with medians varying between 42.9 and 49.0 thousands of pairs, and average population estimates at about 46,100 pairs (). It is worth noting that even the lowest limit of our model-averaged estimate (37,367 pairs) appeared higher than the estimate for 1974 (32,200 pairs) even though the confidence intervals for 1958 were not particularly narrow. Nationwide density in 1958 amounted to 14.7 pairs/100 km2 and was thus higher than in 1974 ().
Table II. Models fitted to explain variation in growth rates of the White Stork population in Poland between 1958 and 1974 and the estimates of White Stork population size in 1958
The Polish stork population in 2001–2019 was at a level similar to 1958. Year-to-year variations were moderate to large, with yearly means estimated between 46.2 (2007) and 61.6 (2004) thousands of pairs (Table S2). The largest year-to-year change was identified between 2004 and 2005 (). The yearly estimates for 2001–2004 were 54.8–61.6 thousands, while in 2005–2019 they declined to 46.2–55.1 thousands of pairs. After the 2004–2005 drop, the population has not fully recovered to the levels noted prior to 2005, and a nearly linear decline was obvious over the last 6 years ().
Figure 4. Changes in the number of breeding pairs in the white stork populations (see , S3 and S4 for source data).Left panel – development of the white stork populations in Poland and worldwide as obtained from consecutive international censuses 1958–2004 (black and pale grey dots) and changes of the Polish population revealed by the Monitoring of Birds of Poland (Chodkiewicz et al. Citation2018; Chylarecki et al. Citation2018) in 2001–2019 (dark grey dots). Dots show means and whiskers 95% CrI. Figures present the earliest (1958, this study) and the most recent (2019) assessments of the Polish population size in thousands of pairs. A star indicates an incomplete census. Right panel – development of the eastern core population (including and excluding number of pairs breeding in Poland) and north-western peripheral population of the white stork (Schulz Citation1999) as obtained from consecutive international censuses. Six countries per each subpopulation are included, i.e. those having complete series of national assessments from the censuses in 1958–2014 and 1934 in NW population
Discussion
Population size in 1958 and its long-term variation in Poland
Our new estimate of the white stork population in Poland for 1958, precedes the series of later estimates and, at the same time, represents the earliest assessment for the country, allowing to follow the dynamics of the species for almost 60 years (). In the middle of the 20th century, the population size of the white stork in Poland was high and close to the same level at the end of the century (Chodkiewicz et al. Citation2018; Chylarecki et al. Citation2018). More importantly, if this is the case, it must have undergone a massive decline since around the 1960s, up to the 1980s. This is a new finding, revealed for the first time in this study.
The size of the Polish white stork population remains unknown prior to 1958. Szczepski (Citation1968) suggested even ≥50% losses between 1934 and 1958, but it was based mainly on intuition, without a sufficient basis in the data. In contrast, the only quantitative comparison based on thorough inspections made in the Milicz county in SW Poland (994 km2) indicated stability between the 1930s and 1950s. In 1933–1934, 119 and 152 pairs bred there, while 144 pairs were found in 1959 (Mrugasiewicz Citation1972). Also, Tomiałojć (Citation1972) considered the stork population stable after evaluation of incomplete field data from several areas examined both in the 1930s and 1960s; however, solid data are lacking. Nonetheless, non-linear changes in numbers cannot be ruled out during this period, i.e. significant post-war decreases, followed by rapid growth reaching the size estimated for 1958 in this work. The decrease due to World War II was likely through direct persecution of storks by soldiers (Schüz & Profus Citation1983), but primarily through loss of suitable agricultural habitats. Cultivation stopped on approximately 7.5 million ha of arable land in Poland and livestock was dramatically reduced: pigs and sheep by ~75%, cattle by ~70% and horses by ~50% (Bański Citation2010).
The strong decreasing trend between 1958 and 1974 in Poland proves rapid population changes that occurred in the most important European refuge of the white stork in the past. A 30% decline over 16 years (1.88% per year) is a fairly high figure for a long-lived, single-brooded bird species with a rather slow reproduction rate. Such fluctuations in large populations of the white stork are rare (Bairlein Citation1991; Sæther et al. Citation2006), but have already been documented. In the same period (1958 to 1974) the decline in Alsace (France) amounted to 93.1% (from 131 to 9 pairs, annual growth rate ~0.85) (Schierer Citation1992), in Denmark to 78.8% (from 189 to 40 pairs, annual growth rate ~0.9) (Skov Citation2016), whereas in Steiermark (SE Austria) the population increased by 104.1% (from 49 to 100 pairs, annual growth rate ~1.045) (Ranner & Tiefenbach Citation1994), and in Estonia by 121.3% (from 479 to 1060 pairs, annual growth rate ~1.051) (Ots Citation2009), but all these populations were much smaller than the Polish one. However, the ongoing spectacular increase of the world population of the white stork, amounting to 66% in 20 years (between 1984 and 2004, Table S3), proves the possibility of rapid population changes also at a large scale.
The causes of these various fluctuations are complex (see Introduction) and changing over time. Recently, Profus and Siekiera (Citation2019) reported an extremely high mortality rate of first-year storks: 83% out of 110 birds equipped with satellite transmitters died within several months, mostly during their first migration. The figure is much higher than earlier estimates of the annual mortality rate (Bairlein Citation1991; Schaub et al. Citation2005). It suggests that the low survival of first-year storks may now be increasingly responsible for downward trends, as it may have been in the past. However, the twentieth-century declines were primarily linked with habitat losses and agricultural intensification. In particular, the coincidence in time between stork declines and the mass applications of organochlorine pesticides, such as DDT (started in the 1940s, banned in the 1970s and 1980s in most developed countries, in 1976 in Poland) may not be casual. Surprisingly, this relationship was poorly emphasized, perhaps due to the lack of scientific evidence regarding the white stork itself. Further contamination studies clearly showed that various stork species (Van Den Bossche et al. Citation2002; Kamiński et al. Citation2008; Strazds et al. Citation2015; Orłowski et al. Citation2019) and other farmland birds (Pinowski et al. Citation1994; Orłowski et al. Citation2014) are susceptible to the adverse effects of agriculturally related chemicals. Therefore, it cannot be ruled out that the contamination with DDT and its breakdown products was an important cause of the past widespread population decline of white stork in Europe.
Finally, the role of intra-specific factors for the population fluctuations should not be underestimated: rather than stemming from local survival rates, productivity and immigration, declines may be due to intense dispersal to better breeding grounds, causing rapid increases there. Such examples, where a rapid growth cannot be explained without strong immigration, have already been documented for colonial waterbirds (Doxa et al. Citation2013; Ledwoń et al. Citation2014), illustrating that massive shifts of breeding range over large areas can occur. They are also exemplified by recent north- and eastward expansion of the core Central European population of the white stork, possibly facilitated by climate changes (Thomsen et al. Citation2017).
Spatial variation in density and population growth rate in Poland
White stork densities in Poland in 1958 increased along an SW-NE gradient, in line with the increase of the species’ main feeding grounds (pastures in particular) and areas with intensive cattle breeding. This pattern is not surprising since it closely matches spatial variation observed in later censuses (Guziak & Jakubiec Citation2006). In absolute numbers, the largest declines matched this distribution, and were smaller towards the west and south, along with smaller local population sizes.
However, spatial variation in the rate of change – i.e. a quantity independent of population size – between 1958 and 1974, was different. The rate of change varied primarily along an NW-SE line, perpendicular to a density gradient, which indicates that different factors than the ones affecting density variation (like habitat suitability in general) could play a role. Regional differences in the rate of change () could result from processes experienced by Polish agriculture during these times. It needs to be noted that strong declines (revealed by red to yellowish areas in ) vs stable or even increasing populations (green to blue areas on ) match the distribution of farm ownership (private vs national) and size (small vs large) quite well. Small-sized, individual farms (which made up ~80% of all in the 1950s), predominated (90–95%) in central and south-eastern Poland, i.e. in areas where the white stork population experienced strong declines. In contrast, small-sized farms of a proportion comparable with national farms were typical for areas with a more stable stork population (Kostrowicki Citation1978). A similar structure in farm size and ownership is still seen today (Bański Citation2016). This can indicate that the population of the white stork was more influenced by processes that took place in the areas of individual agricultural production with small farms (up to a few hectares), human overpopulation and an accumulation of arable lands. Even more importantly, precisely these areas saw the largest changes in land use between the 1950s and 1980s, with the increase of arable lands in particular at the cost of pastures and meadows (Kostrowicki Citation1978). The decline in the area of suitable feeding grounds in central and south-eastern Poland, which were already sparse and small, could affect observed regional differences in white stork population dynamics.
Long-term trends in the Polish, global and regional stork populations
Providing the earliest estimate of the population size in Poland, we filled in the gap that made it difficult to assess the development of the white stork numbers on wider, global and regional scales. Former provisional guesses assumed that 10,000 (Schüz & Szijj Citation1960) or 30,000 pairs (Bairlein Citation1991) bred in Poland in 1958 – both are hardly defendable and turned out to be underestimated. Actually, despite incomplete national estimates, it is clear that the contribution of the Polish population to the world population was significant, constituting approx. 1/4, as in later years (Tab. S3). More importantly, our data show that trends in breeding populations in Poland did not differ from changes in the global population for over half a century. We have shown that the decline in the stork population during 1960–1980, known from other parts of Europe, and the subsequent increase, also concerned the core range of distribution covering Poland. We also found, however, that the recent trends of the Polish and world populations diverge continuously: despite being inadequately assessed, the global trend is increasing, which is particularly prominent on the eastern and western edges of the species’ range. It is however not detectable in the core range of Poland. Although the numbers are still high here (47,300 pairs in 2019 according to FSM), sharp decreases are observed in many study plots checked annually, including the key areas of Northern and Eastern Poland (Peterson & Jakubiec Citation2016; Sikora Citation2017) and are partly visible in the FSM data (, Table S2). For example, in five provinces of S Poland (70,863 km2), a sharp decrease of 36.1% was noted between 2004 (3970 breeding pairs) and 2014 (2538 pairs) (Wuczyński et al. Citationunpublished). During the same time, the Latvian population has increased by c 32% () and Ukrainian by c 20% (Thomsen et al. Citation2017) whereas the numbers in Lithuania doubled between 1994 and 2010 (Vaitkuviene & Dagys Citation2015). This indicates that the former center of the species range, covering Poland, is currently shifting north- and eastwards (Keller et al. Citation2020).
Table III. Number of breeding pairs of the White Stork obtained during consecutive IWSCs from the countries categorized into eastern core population (ECP) and north-western peripheral population (NWPP) according to Schulz (Citation1999). Only countries with complete series of estimates from 1958 to 2014 are included, and results of the first IWSC (1934) are also presented when available. Percentage changes with respect to the previous censuses (in parentheses) along with the totals are shown at the bottom of the table. Countries are arranged according to the decreasing order of numbers in 2014. The data are also visualized in
Secondly, changes in the worldwide stork population were confirmed by regional data, compiled comparatively by two European subpopulations (). Contrary to earlier assumptions (Schulz Citation2004), the central-eastern population was not stable in the period of 1958–1974 but decreased at a rate of 20–30%, comparable with the peripheral north-west population. In a sample of six countries attributed to the eastern core population the rate of change during 1958–1974 was similar regardless of whether Poland was included or not (28–30%, , ). Subsequent changes in both regional populations were also quite similar, up to the twenty-first century. However, the current declines in parts of Central Europe traditionally classified as the eastern core population (Poland, Czech Republic, Hungary, Austria) (Wuczyński et al. Citationunpublished), have not kept up with the rapid growths in the north-western population (54% in 2004–2014), fed by an extremely thriving core population from the Iberia region.
Conclusions
The white stork population dynamics in Poland, now extended by 16 years and superimposed on global and regional fluctuations, can bring a new perspective on the causes of population changes in the white stork. According to the established literature, the sharp decline of the western migratory population in the second half of the twentieth century was mainly associated with unfavorable changes in wintering grounds, while the presumed better state – manifested by the lower rate of decline – in the eastern population has been linked with deterioration of foraging conditions in the breeding grounds (Kanyamibwa et al. Citation1990). Our data suggest that changes in both – western and eastern – populations were similar to a large degree. In turn, it seems likely that the dynamics of the stork numbers were shaped by large-scale processes rather than local ones, similarly affecting birds originating from different breeding populations. Local conditions, e.g. related to agriculture, may have been responsible for the differentiation of regional trends (Senra & Alés Citation1992; Vaitkuviene & Dagys Citation2015, see also ) but unlikely for the rapid changes in the entire stork population.
Regardless of the similarities in large-scale fluctuations, we have shown variation in population changes within Poland, across the density gradient. Also in Germany, the populations in the eastern lands, adjacent to Poland, are now decreasing whereas the western and southern populations increase rapidly (Thomsen et al. Citation2017). This might indicate that the hitherto identification of the European subpopulations of the white stork may need to be reviewed in light of recent spatio-temporal population changes. It also means that stork censuses traditionally based on national data (such as IWSCs) may provide too coarse results, especially in large countries and regions where rapid and clinal changes occur. Although it would be rather difficult to imagine that international actions concerning numerous and widespread species could be conducted differently than at the level of individual countries, the interpretation of the results, especially regarding regional trends, should be made with caution.
Geolocation information
Europe, in particular, Poland
Supplemental Material
Download MS Word (48.8 KB)Acknowledgements
We would like to thank prof. J. Bański and two anonymous Reviewers for giving valuable comments, as well as Tomasz Chodkiewicz and Wiesław Król for help in preparing maps. Daniel O’Connell kindly improved our English. This study was supported by the Institute of Nature Conservation, Polish Academy of Sciences as a statutory activity.
Disclosure statement
No potential conflict of interest was reported by the author(s).
Supplementary material
Supplemental data for this article can be accessed here.
Additional information
Funding
References
- Bairlein F. 1991. Population studies of white storks (Ciconia ciconia) in Europe. In: Perrins CM, Lebreton J-D, M. H. G. J. editors. Bird population studies. Oxford, UK: Oxford University Press. pp. 207–229.
- Bański J, editor. 2010. Atlas of Polish agriculture. Warszawa: Instytut Geografii i Przestrzennego Zagospodarowania PAN (in Polish with English summary).
- Bański J, editor. 2016. Atlas obszarów wiejskich w Polsce. Warszawa: IGiPZ PAN (in Polish).
- Berthold P, Kaatz M, Querner U. 2004. Long-term satellite tracking of white stork (Ciconia ciconia) migration: Constancy versus variability. Journal of Ornithology 145:356–359. DOI:10.1007/s10336-004-0049-2.
- Bocheński M, Jerzak L. 2006. Behaviour of the white stork Ciconia ciconia: A review. In: Tryjanowski P, Sparks T, Jerzak L, editors. The white stork in Poland: Studies in biology, ecology and conservation. Poznań: Bogucki Wydawnictwo Naukowe. pp. 295–324.
- Chernetsov N, Chromik W, Dolata PT, Profus P, Tryjanowski PJ. 2006. Sex-related natal dispersal of white storks (Ciconia ciconia) in Poland: How far and where to? The Auk 123:1103–1109.
- Chodkiewicz T, Neubauer G, Sikora A, Ławicki Ł, Meer W, Bobrek R, Cenian Z, Bzoma S, Betleja J, Kuczyński L, Moczarska J, Rohde Z, Rubacha S, Wieloch M, Wylegała P, Zielińska M, Zieliński P, Chylarecki P. 2018. Monitoring ptaków Polski w latach 2016–2018. Biuletyn Monitoringu Przyrody 17:1–90 (in Polish).
- Chylarecki P, Chodkiewicz T, Neubauer G, Sikora A, Meer W, Woźniak B, Wylegała P, Ławicki Ł, Marchowski D, Betleja J, Bzoma S, Cenian Z, Górski A, Korniluk M, Moczarska J, Ochocińska D, Rubacha S, Wieloch M, Zielińska M, Zieliński P, Kuczyński L. 2018. Trendy liczebności ptaków w Polsce. Warszawa: GIOŚ (in Polish).
- Denac D. 2010. Population dynamics of the white stork Ciconia ciconia in Slovenia between 1999 and 2010. Acrocephalus 31:101–114. DOI:10.2478/v10100-010-0007-4.
- Doxa A, Besnard A, Béchet A, Pin C, Lebreton JD, Sadoul N. 2013. Inferring dispersal dynamics from local population demographic modelling: The case of the slender‐billed gull in France. Animal Conservation 16:684–693. DOI:10.1111/acv.12048.
- Egan D, Howell EA. 2005. The historical ecology handbook: A restorationist’s guide to reference ecosystems. Washington, DC: Island Press.
- Flack A, Nagy M, Fiedler W, Couzin ID, Wikelski M. 2018. From local collective behavior to global migratory patterns in white storks. Science 360:911–914. DOI:10.1126/science.aap7781.
- Fulin M. 2016. White stork in Slovakia in 2014. In: Jerzak L, Shephard J, Aguirre JI, Shamoun-Baranes J, Tryjanowski P, editors. The white stork: Studies in biology, ecology and conservation. Zielona Góra: Uniwersytet Zielonogórski. pp. 59–61.
- Gadenne H, Cornulier T, Eraud C, Barbraud J-C, Barbraud C. 2014. Evidence for density-dependent habitat occupancy at varying scales in an expanding bird population. Population Ecology 56:493–506. DOI:10.1007/s10144-014-0435-4.
- Gelman A, Hill J. 2007. Data analysis using regression and multilevel/hierarchical models. New York: Cambridge University Press.
- Guziak R, Jakubiec Z, editors. 2006. White stork Ciconia ciconia (L.) in Poland in 2004. Wrocław: Results of the VIth International White Stork Census. PTPP “proNatura” (in Polish with English summary).
- Hadfield JD. 2010. MCMC methods for multi-response generalized linear mixed models: The MCMCglmm R package. Journal of Statistical Software 33:1–22. DOI:10.18637/jss.v033.i02.
- Jakubiec Z, editor. 1985a. Population of white stork Ciconia ciconia L. in Poland. Vol. 28. Warszawa – Kraków: Studia Naturae A (in Polish with English summary).
- Jakubiec Z. 1985b. Tentative assessment of credibility of inquiry data in confrontation with results of direct field censuses. Studia Naturae A 28:223–232 (in Polish with English summary).
- Jakubiec Z, Guziak R. 1998. White stork Ciconia ciconia in Poland in 1995 – distribution, numbers, conservation problems. Notatki Ornitologiczne 39:195–209 (in Polish with English summary).
- Janaus M. 2016. Monitoring of breeding success of the white stork in Latvia, 1989-2014. In: Jerzak L, Shephard J, Aguirre JI, Shamoun-Baranes J, Tryjanowski P, editors. The white stork: Studies in biology, ecology and conservation. Zielona Góra: Uniwersytet Zielonogórski. pp. 37–47.
- Janiszewski T, Minias P, Wojciechowski Z, Podlaszczuk P. 2014. Habitat selection by white storks breeding in a mosaic agricultural landscape of central Poland. The Wilson Journal of Ornithology 126:591–599. DOI:10.1676/13-219.1.
- Janota E. 1876. Bocian: Opowiadania, spostrzeżenia i uwagi. Lwów: Przewodnik Naukowy i Literacki (in Polish).
- Johst K, Brandl R, Pfeifer R. 2001. Foraging in a patchy and dynamic landscape: Human land use and the white stork. Ecological Applications 11:60–69. DOI:10.1890/1051-0761(2001)011[0060:FIAPAD]2.0.CO;2.
- Kaatz C, Wallschlager D, Dziewiaty K, Eggers U, editors. 2017. Der Weißstorch Ciconia ciconia. NBB 682. Magdeburg: VerlagsKG Wolf (in German with English summary).
- Kamiński P, Kurhalyuk N, Szady-Grad M, Tkachenko H, Kasprzak M, Jerzak L. 2008. Chemical elements in the blood of white stork Ciconia ciconia chicks in differentiated regions of Poland. Medicine and Biological Science 22:31–37.
- Kania W. 2006. Movement of Polish white storks (Ciconia ciconia) – An analysis of ringing results. In: Tryjanowski P, Sparks TH, Jerzak L, editors. The white stork in Poland: Studies in biology, ecology and conservation. Poznań: Bogucki Wydawnictwo Naukowe. pp. 249–294.
- Kanyamibwa S, Schierer A, Pradel R, Lebreton J-D. 1990. Changes in adult annual survival rates in a western European population of the white stork Ciconia ciconia. Ibis 132:27–35. DOI:10.1111/j.1474-919X.1990.tb01013.x.
- Keller V, Herrando S, Voříšek P, Franch M, Kipson M, Milanesi P, Martí D, Anton M, Klvaňová A, Kalyakin M. 2020. European breeding bird Atlas 2: Distribution, abundance and change. Barcelona: European Bird Census Council & Lynx Edicions.
- Kosicki JZ, Kuźniak S. 2006. Long-term population size and productivity dynamics of a local white stork Ciconia ciconia population in Wielkopolska. In: Tryjanowski P, Sparks T, Jerzak L, editors. The white stork in Poland: Studies in biology, ecology and conservation. Poznań: Bogucki Wydawnictwo Naukowe. pp. 23–33.
- Kosicki JZ. 2012. Effect of weather conditions on nestling survival in the white stork Ciconia ciconia population. Ethology Ecology & Evolution 24:140–148. DOI:10.1080/03949370.2011.616228.
- Kostrowicki J. 1978. Changes in the spatial structure of Polish agriculture 1950–1970. Prace Geograficzne 127:1–512 (in Polish with English summary).
- Lack DL. 1966. Population studies of birds. Oxford: Clarendon Press.
- Ledwoń M, Betleja J, Stawarczyk T, Neubauer G. 2014. The Whiskered Tern Chlidonias hybrida expansion in Poland: The role of immigration. Journal of Ornithology 155:459–470. DOI:10.1007/s10336-013-1027-3.
- Mrugasiewicz A. 1972. White stork, Ciconia ciconia (L.) over the district of Milicz in the years 1959–1968. Acta Ornithologica 13:243–278 (in Polish with English summary).
- Orłowski G, Kasprzykowski Z, Dobicki W, Pokorny P, Wuczyński A, Polechoński R, Mazgajski TD. 2014. Trace-element interactions in rook Corvus frugilegus eggshells along an urbanisation gradient. Archives of Environmental Contamination and Toxicology 67:519–528. DOI:10.1007/s00244-014-0030-x.
- Orłowski G, Siekiera J, Karg J, Tobolka M, Wuczyński A, Kaługa I, Siekiera A, Cyga-Döhner R, Dudzik E. 2019. Calcium and metals are not evenly distributed in avian eggshells over their longitudinal section. The Auk 136:ukz026. DOI:10.1093/auk/ukz026.
- Ots M. 2009. The white stork (Ciconia ciconia) in Estonia till year 2008. Hirundo 22:32–42.
- Perrins CM, Lebreton J-D, Hirons G, editors. 1991. Bird population studies: Relevance to conservation and management. Oxford: Oxford University Press.
- Peterson U, Jakubiec Z. 2016. Long term studies of population dynamics of the white stork Ciconia ciconia in the region of its highest density (NE Poland). In: Jerzak L, Shephard J, Aguirre JI, Shamoun-Baranes J, Tryjanowski P, editors. The white stork: Studies in biology, ecology and conservation. Zielona Góra: Uniwersytet Zielonogórski. pp. 19–35.
- Pinowski J, Barkowska M, Kruszewicz AH, Kruszewicz AG. 1994. The causes of the mortality of eggs and nestlings of Passer spp. Journal of Biosciences 19:441–451. DOI:10.1007/BF02703180.
- Plummer M, Best N, Cowles K, Vines K. 2006. CODA: Convergence diagnosis and output analysis for MCMC. R News 6:7–11.
- Profus P. 2006. Population changes and breeding ecology of the white stork Ciconia ciconia L. in Poland against a background of the European population. Synthesis. Studia Naturae 50: 1–155 (in Polish with English summary).
- Profus P, Siekiera J. 2019. Weißstorch-Forschung in Slask (Schlesien, SW-Polen): Bestandsentwicklung, Reproduktion und Migration ins Winterquartier. 28. Sachsen-Anhaltische Storchentage vom 18.-20. Oktorber 2019 in Loburg und Lübars. Beiträge: 20 ( in German).
- R Core Team. 2018. R: a language and environment for statistical computing. Vienna, Austria: R Foundation for Statistical Computing. Available: http://www.R-project.org.
- Ranner A, Tiefenbach M. 1994. Der Weißstorch - Bestandsentwick-lung, Gefährdungsursachen und Maßnahmenvorschläge. Reports UBA-94-095, BM. f. Umwelt, Jugend u. Familie, Wien: 73 ( in German).
- Sæther B-E, Engen S, Matthysen E. 2002. Demographic characteristics and population dynamical patterns of solitary birds. Science 295:2070–2073. DOI:10.1126/science.1068766.
- Sæther BE, Grøtan V, Tryjanowski P, Barbraud C, Engen S, Fulin M. 2006. Climate and spatio‐temporal variation in the population dynamics of a long distance migrant, the white stork. Journal of Animal Ecology 75:80–90. DOI:10.1111/j.1365-2656.2005.01023.x.
- Schaub M, Kania W, Köppen U. 2005. Variation of primary production during winter induces synchrony in survival rates in migratory white storks Ciconia ciconia. Journal of Animal Ecology 74:656–666. DOI:10.1111/j.1365-2656.2005.00961.x.
- Schierer A. 1992. Population de la Cigogne Blanche en Alsace. Colloque International, Metz 1991: les cigognes d’Europe: 53–58 ( in French with English summary).
- Schimkat J. 2004. Sind die Bestände der ostziehenden Weißstörche Ciconia ciconia stabil? Actitis 39:75–108 (in German with English summary).
- Schulz H. 1988. Weissstorchzug: Ökologie, Gefährdung und Schutz des Weissstorchs in Afrika und Nahost. Jurgen Margraf 3 ( Königslutter-Lelm (in German with English summary)). pp. 459.
- Schulz H. 1999. The world population of the white stork Ciconia ciconia – Results of the 5th International white stork census 1994-95. In: Schulz H, editor. Weißstorch im Aufwind-White storks on the up? Proceedings of the international symposium on the white stork. Hamburg: NABU. pp. 351–365.
- Schulz H. 2004. White stork Ciconia ciconia. BWPi: Birds of the Western Palearctic interactive (DVD-ROM). Sheffield: BirdGuides Ltd.
- Schüz E, Profus P. 1983. Der Weißstorch in Polen. Vogelwarte 32:84–85 (in German with English summary).
- Schüz E, Szijj J. 1960. Vorläufiger Bericht über die Internationale Bestandsaufnahme des Weißstorchs 1958. Die Vogelwarte 20:253–257 (in German with English summary).
- Schüz E, Szijj J. 1975. Bestandsveränderungen beim Weißstorch, fünfte Übersicht: 1959–1972. Die Vogelwarte 28:61–93 (in German with English summary).
- Senra A, Alés EE. 1992. The decline of the white stork Ciconia ciconia population of western Andalusia between 1976 and 1988: Causes and proposals for conservation. Biological Conservation 61:51–57. DOI:10.1016/0006-3207(92)91207-9.
- Shephard JM, Ogden R, Tryjanowski P, Olsson O, Galbusera P. 2013. Is population structure in the European white stork determined by flyway permeability rather than translocation history? Ecology and Evolution 3:4881–4895. DOI:10.1002/ece3.845.
- Sikora A. 2017. Distribution, changes in the number and productivity of white stork Ciconia ciconia in Żuławy Wiślane. Chrońmy Przyr Ojczystą 73:363–378 ( in Polish with English summary).
- Skov H. 2016. Denmark – Once a classic storkcountry. In: Jerzak L, Shephard J, Aguirre JI, Shamoun-Baranes J, Tryjanowski P, editors. The white stork: Studies in biology, ecology and conservation. Zielona Góra: Uniwersytet Zielonogórski. pp. 9–18.
- Spiegelhalter D, Thomas A, Best N, Lunn D. 2003. WinBUGS version 1.4 user manual. Cambridge, UK: MRC Biostatistics Unit.
- Strazds M, Bauer H-G, Väli Ü, Kukāre A, Bartkevičs V. 2015. Recent impact of DDT contamination on black stork eggs. Journal of Ornithology 156:187–198. DOI:10.1007/s10336-015-1244-z.
- Sturtz S, Ligges U, Gelman AE. 2005. R2WinBUGS: A package for running WinBUGS from R. Journal of Statistical Software 12:1–16. DOI:10.18637/jss.v012.i03.
- Szabó P. 2015. Historical ecology: Past, present and future. Biological Reviews 90:997–1014. DOI:10.1111/brv.12141.
- Szczepski B. 1968. Wyniki inwentaryzacji bociana białego. Przyroda Polska 12:6 (in Polish).
- Thomsen K-M, Kaatz C, Kaatz M, Ludwig B. 2017. Verbreitung und Bestand. In: Kaatz C, Wallschläger D, Dziewiaty K, Eggers U editors. Der Weißstorch Ciconia ciconia. NBB 682. Magdeburg: VerlagsKG Wolf. pp. 148–205 ( in German with English summary).
- Tobolka M, Dylewski L, Wozna JT, Zolnierowicz KM. 2018. How weather conditions in non-breeding and breeding grounds affect the phenology and breeding abilities of white storks. Science of the Total Environment 636:512–518. DOI:10.1016/j.scitotenv.2018.04.253.
- Tomiałojć L. 1972. The birds of Poland. Warszawa: Państwowe Wydawn. Naukowe (in Polish with English summary).
- Tomiałojć L, Stawarczyk T. 2003. The avifauna of Poland. Distribution, numbers and trends. Wrocław: PTPP “pro Natura” ( in Polish with English summary).
- Tryjanowski P, Sparks T, Jakubiec Z, Jerzak L, Kosicki J, Kuźniak S, Profus P, Ptaszyk J, Wuczyński A. 2005. The relationship between population means and variances of reproductive success differs between local populations of white stork (Ciconia ciconia). Population Ecology 47:119–125. DOI:10.1007/s10144-005-0217-0.
- Tryjanowski P, Sparks TH, Jerzak L, editors. 2006. The white stork in Poland: Studies in biology, ecology and conservation. Poznań: Bogucki Wydawnictwo Naukowe.
- Vaitkuviene D, Dagys M. 2015. Two-fold increase in white stork (Ciconia ciconia) population in Lithuania: A consequence of changing agriculture? Turkish Journal of Zoology 39:144–152. DOI:10.3906/zoo-1402-44.
- Van den Bossche W, Berthold P, Kaatz M, Nowak E, Querner U. 2002. Eastern European white stork populations: Migration studies and elaboration of conservation measures. BjN - Skripten 66, Bonn.
- Wuczyński A. 2005. The turnover of white storks Ciconia ciconia on nests during spring migration. Acta Ornithologica 40:83–85. DOI:10.3161/068.040.0104.
- Wuczyński A, Betleja J, Jerzak L, Król W, Mielczarek P, Profus P, Siekiera A, Siekiera J, Springer S, Sztwiertnia H, Szymczak J, Tryjanowski P. unpublished. Strong declines of the White Stork Ciconia ciconia population in south-western Poland derived from the 7th International White Stork Census 2014.
- Wuczyński A, Krogulec G, Neubauer G, Profus P. 2019. The first assessment of the number of white storks Ciconia ciconia in Poland in 1958 – Summary of the presentation. Chronmy Przyr Ojczysta 75:336–344 (in Polish with English summary).