
Abstract
In this contribution, we aim at determining the role of climate in shaping the current and historical (Last Glacial Maximum and Middle Holocene) distributions of two parapatric bat species (Myotis daubentonii and Myotis capaccinii) in Europe, using ensemble Habitat Suitability Modelling (HSM). Model projection to current climatic conditions predicted distributions largely coherent with the ones observed for the two species in the study area. Temperature- and precipitation-linked variables well accounted for the observed parapatry of the two target species. Moreover, areas of co-occurrence turned out to be those where the main ecological needs concerning the most important range-limiting variables are met for both species. Model projections to past scenarios allowed us to hypothesize the effects of climatic oscillations over the distribution of the two species during the Late Pleistocene and Holocene. Extreme range contractions during the Last Glacial Maximum and the subsequent expansions during Middle Holocene were predicted, consistently with general patterns of post-glacial recolonization routes of many temperate bat species in Europe. Our findings are largely coherent with recent phylogeographic studies investigating the two target species, thus corroborating the validity of potential distribution scenarios obtained from the models and, more importantly, confirming the great influence that glacial cycles had in shaping the biogeography of the European fauna.
Introduction
Climate is often regarded as the main abiotic factor shaping species’ distributions both at broad (Root Citation1988; Buckley & Jetz Citation2007; Sexton et al. Citation2009; Wiens Citation2011; De Simone et al. Citation2020) and narrow (Iannella et al. Citation2018; Brunetti et al. Citation2019) spatial scales. Big climatic events, such as those that occurred during the Late Pleistocene and Holocene ages, have deeply influenced the distribution patterns of many animal and plant species, leading to large-scale range contractions, range expansions, and extinctions. Therefore, very often, current biogeographic patterns can be explained by analyzing species’ responses to those past climatic oscillations (Graham et al. Citation1996; Taberlet et al. Citation1998; Hewitt Citation2000; Stewart & Lister Citation2001; Prescott et al. Citation2012; Palkopoulou et al. Citation2013).
The effects of climatic oscillations, which took place during the Late Pleistocene and Holocene periods in Europe, are still detectable in many species’ current distribution patterns, and have been studied through fossil analysis, phylogeographic studies and palaeoecological reconstructions (Taberlet et al. Citation1998; Hewitt Citation1999; Sommer & Nadachowski Citation2006; Sommer & Zachos Citation2009; Alexandri et al. Citation2012). However, the distribution of a species in a certain time and space is determined not only by environmental factors but also by its interactions with other extant species (Case & Taper Citation2000; Peterson & Soberón Citation2012). In this context, parapatric species, which are characterized by adjacent ranges with limited overlapping areas, are often regarded as a model system for studying range limits and the factors shaping them. Many studies investigated the relative role of climate and biotic interactions in defining biogeographic boundaries of parapatric species (Huey Citation1979; Case & Taper Citation2000; Lawing et al. Citation2012; Werner et al. Citation2013; Cunningham et al. Citation2016; Iannella et al. Citation2017; Braz et al. Citation2019). When range limits are mainly shaped by abiotic factors, species tend to occupy all their environmentally suitable areas (“ecological parapatry” sensu Key (Citation1981)), except for those geographically inaccessible (“migration” factor of the Biotic-Abiotic-Migration (BAM) diagram, Soberon and Peterson (Citation2005)); usually, this type of parapatry is associated with relatively strong environmental gradients (Khimoun et al. Citation2013). Conversely, when range limits are mainly constrained by biotic factors (e.g. competition), environmentally suitable areas do not fully match the observed distributions and usually one species prevents the other from occupying common suitable areas (“competitive parapatry” sensu Haffer (Citation1986)); in these cases, range margins can form at shallow environmental gradients (Case et al. Citation2005; Bridle & Vines Citation2007).
Habitat Suitability Modelling (HSM) techniques are among the most widely used tools for analyzing species’ distribution related to climatic conditions and, together with phylogeographic analyses based on genetic evidence, they allow a better comprehension of the processes determining species’ evolutionary history and distribution in time (Richards et al. Citation2007; Elith & Leathwick Citation2009; Araújo et al. Citation2019). Based on target species’ occurrence localities and environmental predictors, an HSM calibrates and infers the species’ response to these variables; then, it can project the calibrated scenario to new environmental conditions, which may vary in space and time. By allowing the identification of environmentally suitable areas for multiple species, HSM techniques have been proven to be very useful tools for studying parapatric range limits (Glor & Warren Citation2011; Khimoun et al. Citation2013; Iannella et al. Citation2017, Citation2018). Studies applying HSMs to investigate the factors shaping parapatric range boundaries have been conducted on many animal species, including mammals, birds, reptiles and amphibians (Cunningham et al. Citation2009; Gentilli et al. Citation2011; Glor & Warren Citation2011; Acevedo et al. Citation2012; Engler et al. Citation2013; Werner et al. Citation2013; McQuillan & Rice Citation2015; Iannella et al. Citation2017, Citation2018).
Despite their important ecological role (Ghanem & Voigt Citation2012), parapatry has rarely been studied in bats, and this is even more true if we consider HSM implementation in this context (Davis Citation1973; Baagøe Citation1984; Haffner & Stutz Citation1985; Rutishauser et al. Citation2012; Santos et al. Citation2014). Bats are particularly responsive to climatic and microclimatic changes in their environment as temperature- and precipitation-linked variables deeply affect every stage of their life cycle (Ransome Citation1971; Ibáñez Citation1997; Park et al. Citation2000; Kerth et al. Citation2001; Boyles Citation2007; Wojciechowski et al. Citation2007; Ben-Hamo et al. Citation2013).
In the present study, we assess the role of climate in shaping the current distributions of two parapatric bat species, Myotis daubentonii (Kuhl) and M. capaccinii (Bonaparte), using ensemble modelling (EM) techniques. These two vespertilionids show widely complementary distributions along the latitudinal gradient in Europe, with sympatric overlapping areas at their range limits.
For both target species, we build HSMs under the current climatic conditions using EM techniques to subsequently infer to past climatic conditions, namely the Last Glacial Maximum and the mid-Holocene scenarios, investigating whether the climatic oscillations that occurred in these periods might have influenced the two Myotis species, leading to shape their current distribution. Finally, we couple the HSMs’ outcomes with the current knowledge about genetic diversity aiming at understanding links between the current biogeographic and genetic assets for both species.
Materials and methods
Target species and study area
Two insectivorous bats, Myotis daubentonii (Kuhl, 1817) and M. capaccinii (Bonaparte, 1837), were considered in our analysis. They are among the so-called “trawling bats”, which hunt over waterbodies gleaning insects from the surface. These two species show wide complementary distributions in Europe, with overlapping areas at the edge of their ranges ()) (Hutson et al. Citation2010; Kruskop et al. Citation2020).
Figure 1. Myotis daubentonii and M. capaccinii European distribution following the IUCN Red List data (Kruskop et al. Citation2020; Hutson et al. Citation2010) (a), their occurrence localities in the study area (b), the three-dimensional plot showing the overlap of their Hutchinsonian climatic niche and (c) binarized predictions for the current scenario, also considering the areas of sympatry (d)
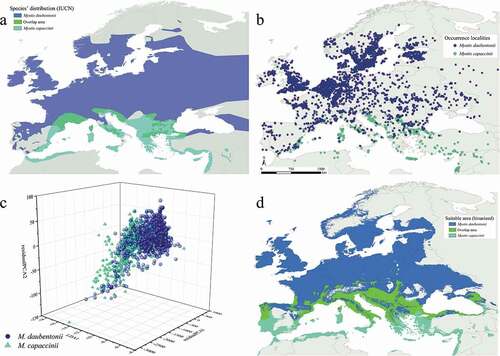
M. daubentonii is widespread in central-northern Europe, whereas in the Mediterranean region, it displays a discontinuous distribution, mainly confined to mountainous areas. Since the environmental factors which might have affected this species in the past, conditioning the accessible area (sensu Barve et al. Citation2011), are explored here for the first time, only the Western Palearctic part of its distribution was considered. This species roosts in summer inside tree hollows, caves, buildings and other artificial structures, while its winter roosts comprise a wide range of underground habitats (Dietz & Kiefer Citation2016).
Conversely, M. capaccinii is a strictly troglophilous species, whose distribution is centered in the Mediterranean basin (Dietz & Kiefer Citation2016).
The study area is delimited by the coordinates 71.43 N-31.70 N, 10.00W-45.03E, covering each species’ known distribution in Europe and North Africa. This territory corresponds to the one considered by Rebelo et al. (Citation2010), except for a slight extension southward (added to better encompass Myotis capaccinii’s distribution range).
Species data and climatic variables
Species’ occurrence localities were collected from the online databases GBIF and iNaturalist and integrated by conducting extensive bibliographic research for the whole study area, namely Western Europe and the Mediterranean basin.
All occurrences showing a coarse spatial resolution, equal or more than an area of 10 × 10 km, were discarded (Sillero & Barbosa Citation2020); further, to assess possible spatial autocorrelation among records, a Moran’s I test was performed in ArcMap 10.0 (ESRI Citation2010).
Bioclimatic variables of current, Mid-Holocene (MOL, ~ 6,000 years ago), and Last Glacial Maximum (LGM, ~ 22,000 years ago) periods were downloaded from the WorldClim.org website (Hijmans et al. Citation2005), version 1.4, at 2.5 arc-minutes resolution. Given their ecological relevance for the target species (Rebelo et al. Citation2010), we selected the following five bioclimatic variables: BIO1 (Annual Mean Temperature, °C*10), BIO2 (Mean Diurnal Range, °C*10), BIO6 (Minimum Temperature of Coldest Month, °C*10), BIO12 (Annual Precipitation, mm), and BIO17 (Precipitation of Driest Quarter, mm). To assess whether possible correlations among these predictors occur, a correlation matrix was built in ArcMap 10.0.
Two Global Climate Models (GCM) were considered for the Mid-Holocene and Last Glacial Maximum scenarios, the CCSM4 (Gent et al. Citation2011) and the MIROC-ESM (Watanabe et al. Citation2011), considering the uncertainties which could result from a single GCM approach (Marmion et al. Citation2009; Stralberg et al. Citation2015). Predictors’ values for current climatic conditions were extracted using the occurrence localities for both species through ArcMap 10.0 (ESRI Citation2010).
Niche overlap
To detect a possible climatic niche overlap between the two target species, we used the “hyperoverlap” package (Brown et al. Citation2020) in R (R Core Team Citation2016), developed on the basis of the n-dimensional Hutchinsonian niche concepts (Hutchinson Citation1957), and recently applied to biogeographic research (Iannella et al. Citation2021). The values of the aforementioned predictors, read on the occurrence localities of the two target species, were used as inputs for both the “hyperoverlap_detect” (kernel = polynomial; kernel.order = 3), and “hyperoverlap_lda” functions, to, respectively, quantify and display the possible niche overlap. The latter function builds a three-dimensional plot based on the linear discriminant analysis and the first two axes of the principal components’ residuals obtained by the former.
Model building and evaluation
To build the EMs, we used the ‘biomod2’ R package (Thuiller et al. Citation2016) in R (R Core Team Citation2016). The “ensemble” approach enables the use of different base modeling algorithms and averages the predictions of each resulting model based on the respective performance, obtaining more accurate and reliable outcomes (Thuiller Citation2003; Guisan et al. Citation2017; Cerasoli et al. Citation2019a; Iannella et al. Citation2019a, Citation2019b).
We generated 10 datasets with 1000 pseudo-absences each using the function ‘BIOMOD_FormatingData’ and “disk” strategy. This algorithm allows pseudo-absences to be randomly selected inside a predefined range of distance from occurrence points; in our case, a minimum distance of 100 km and a maximum distance of 1000 km were chosen (Barbet‐Massin et al. Citation2012; Cerasoli et al. Citation2019b; Thuiller et al. Citation2009), based on the spatial behavior of the target species (Barova & Streit Citation2018).
Three algorithms were selected to build the ensemble HSMs: Generalized Linear Models, Gradient Boosting Machine, and Random Forest, to encompass and take advantage of the different statistical approaches, from regression and classification to machine learning ones (Guisan et al. Citation2017). Every single model’s parametrization is reported in Supplementary file S1. Generalized Linear Models are among the most applied modelling techniques in HSMs (Thuiller Citation2003), while Gradient Boosting Machines (Friedman Citation2001) and Random Forests (Breiman Citation2001) are machine learning methods.
The predictive accuracy of the ensemble models was evaluated using both the area under the curve (AUC) of the receiver operating cCharacteristic (ROC) curve (Hanley & McNeil Citation1982) and True Skill Statistic (TSS) (Allouche et al. Citation2006). A 10-fold cross-validation was conducted, with 80% of occurrence records being used as training data and 20% as testing data. For both species, the percent contribution of each predictor was assessed, and the corresponding partial dependence plots were produced. The ensemble models (EMs) were then created from the single base models using the “BIOMOD_EnsembleModeling” function, selecting single models which performed with AUC > 0.80 and TSS > 0.70, thus obtaining a more “conservative” final EM (Iannella et al. Citation2018; Cerasoli et al. Citation2019a; De Simone et al. Citation2020).
Calibrated EMs were then projected to the LGM and MOL scenarios, by using both the CCSM4 and MIROC-ESM. For these past projections, the Multivariate Environmental Surface Similarity (MESS) (Elith et al. Citation2010) was calculated through the “mess” function of the “dismo” R package (Hijmans & Elith Citation2016), to obtain maps of the environmental dissimilarity (i.e. models’ extrapolation) of the past projections with respect to the calibration (current) scenario. These maps were then used to calculate the Multivariate Environmental Dissimilarity Index (MEDI) (Iannella et al. Citation2017), an algorithm that downweighs each GCM projection in the final averaged model based on the degree of extrapolation.
Habitat suitability maps were created using ArcMap 10.0 (ESRI Citation2010); a threshold value for the predicted suitability was calculated through the maximization of the TSS by the “ecospat.max.tss” function of the “ecospat” R package (Di Cola et al. Citation2017) to outline the two species’ binary distributions for the current scenario. These binarized maps were processed, along with the genetic information obtained from bibliographic sources (Viglino (Citation2012) for M. capaccinii and Nardone (Citation2015) for M. daubentonii), in GIS environment, which has shown to be a useful tool for several biodiversity issues (Iannella etal.Citation2016, Citation2020; Rodríguez-Rodríguez et al. Citation2019; Rudke et al. Citation2020). To this aim, the predictions about haplotype network areas were obtained using the “Split binary SDM by input clade relationship” tool of the SDMtoolbox for ArcMap 10.0 (Brown et al. Citation2017).
Results
A total of 2558 occurrence localities for Myotis daubentonii and 423 occurrences for M. capaccinii were gathered ()); these are, respectively, the 86.1% and 82.4% of the total occurrences obtained by applying a spatial resolution filter (Supplementary Material (Table S1)); no duplicate records were observed. Presence data showed no spatial autocorrelation (Moran’s I = −0.000813, p‐value = 0.395888, z‐score = −0.848988 for Myotis daubentonii and Moran’s I = −0.001402, p‐value = 0.699519, z‐score = 0.385970 for M. capaccinii); variables showed low-to-medium correlation values (max |r| observed = 0.74) (Supplementary Material (Table S2)).
The niche analysis (14% misclassified points, 51 Support Vectors) detected an overlap between the two species, showing a clear nestedness of the points distributed in the three-dimensional space ()).
The models obtained showed good predictive accuracy, with AUC = 0.990 and TSS = 0.888 for M. daubentonii, and AUC = 0.977 and TSS = 0.832 for M. capaccinii. On the other hand, the “ecospat.max.tss” algorithm resulted in TSSMAX = 0.454 for Myotis daubentonii and TSSMAX = 0.467 for M. capaccinii, values used as thresholds to binarize ()) the continuous models ( and ).
Figure 2. Predicted suitable areas for current climatic conditions for Myotis daubentonii (a) and M. capaccinii (b); distribution of the four shared and most contributing current bioclimatic variables for both species (c–f)
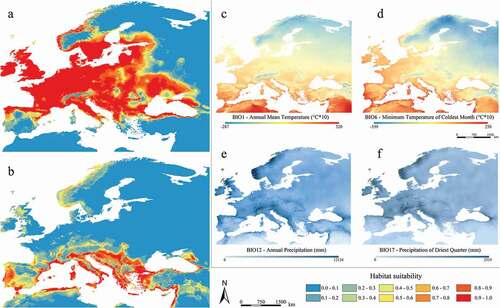
Maps resulting from the projection of the models to the current climatic conditions () and ()) report wide complementary areas, in which each species shows high levels of predicted suitability, as well as “shared” areas, with favorable bioclimatic conditions for both ( and ()). These areas of sympatry mainly fall in the Balkans south of the Carpathian Mountains, in Italy, and along the southern coasts of France.
When comparing the binarized suitable areas ()) with occurrence localities, the 55.1% (179) of the total 325 occurrences falling within the sympatric areas belong to M. capaccinii, while the 44.9% (146) belong to M. daubentonii. Also, this overlapping area represents 13.4% of the total (binarized) distribution of M. daubentonii and 46.1% of the one of M. capaccinii.
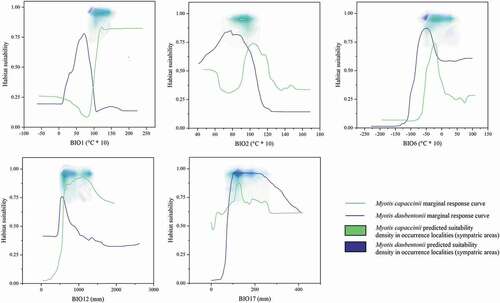
The relative contributions of the predictors used to build the models are reported in for both target species, with some of them showing opposite and possibly discriminating trends in the response curves for the two Myotis species ( and ). In addition, these plots report the predicted suitability densities measured in the occurrence points falling within the sympatric areas: high predicted suitability in these areas is associated with intermediate values of the predictors ().
Table I. Variables’ relative contribution inferred from the Ensemble Modelling process for the two target bat species, with BIO1 (Annual Mean Temperature), BIO2 (Mean Diurnal Range), BIO6 (Minimum Temperature of Coldest Month), BIO12 (Annual Precipitation), BIO17 (Precipitation of Driest Quarter)
Figure 3. Marginal response curves of the five predictors used for the modelling process and the density of predicted suitability read within the sympatric area in the occurrence localities, for Myotis daubentonii and M. capaccinii.
The habitat suitability map for the current scenario and past time-frames (MOL and LGM) are shown in , respectively; to better visualize and compare these trends with the most contributing predictors, we report their respective values for the study area in the corresponding side-panels (c–f) for each. It is observed that the most contributing predictors show marked variation especially at the LGM–MOL transition (), with an apparent association with the contraction and subsequent expansion patterns of predicted suitability modelled for both species.
Figure 4. Predicted suitable areas for the Mid-Holocene climatic conditions for Myotis daubentonii (a) and M. capaccinii (b); distribution of the four shared and most contributing Mid-Holocene bioclimatic variables for both species (c–f)
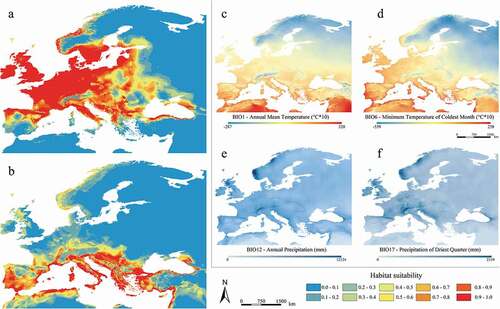
Figure 5. Predicted suitable areas for the Last Glacial Maximum climatic conditions for Myotis daubentonii (a) and M. capaccinii (b); distribution of the four shared and most contributing Last Glacial Maximum bioclimatic variables for both species (c–f)
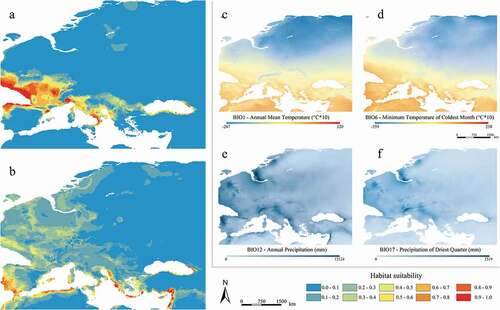
Both temperature- and precipitation-linked variables well account for the observed parapatry of the two target species, defining their range limits (). Meaningfully, the response curves for BIO1 (annual mean temperatures) display an opposite and “selective” pattern, with high suitability values relating to different temperature ranges for the two species. Likewise, the response curves for BIO2 (daily temperature range) reveal that areas of high predicted suitability for M. daubentonii tend to show a smaller diurnal temperature variation, which is typical of temperate-humid climates as defined by Köppen (Köppen Citation1900; Kottek et al. Citation2006), whereas areas of high predicted suitability for M. capaccinii show greater diurnal temperature variation, which is instead typical of the Mediterranean climate.
Concerning the precipitation-linked variables, M. capaccinii displays high values of predicted suitability in areas where annual precipitations (BIO12) reach at least 500 mm (). Observing the BIO12 map for the current climatic conditions ()), it is evident that mean annual precipitations are rather homogeneous in the whole study area, except for continental areas of Turkey and Spain and some coastal areas of southern Spain and northern Morocco. There, mean annual precipitations (and the corresponding suitability) display lower values; indeed, M. capaccinii has a more fragmented distribution in the western Mediterranean and is virtually absent in central Turkey, in line with what was reported from Dietz and Kiefer (Citation2016). Moreover, when observing the predicted suitability and the precipitation of the driest quarter (BIO17), a pattern in the Mediterranean area can be observed for M. daubentonii: environmental suitability appears to be greatly limited where summers are very dry, a condition which is counterbalanced by other variables in mainland Europe ().
The projections of the ensemble models to past climate conditions were made under the assumption of past niche conservatism (Wiens & Graham Citation2005), which has been already tested for bats (Rebelo et al. Citation2012; Razgour et al. Citation2013). These models allow us to hypothesize the effects of climatic oscillations on the distribution of the two Myotis target species during the Late Pleistocene and Holocene.
The Last Glacial Maximum projection reveals a strong decrease of the suitable areas for M. daubentonii, which resulted limited to the south-western portion of its current range, where the most range-limiting variables (i.e. BIO6 and BIO17) display possible appropriate values for the species ()). This is due to enhanced evaporation over the North Atlantic, which in turn caused increased precipitations over southwestern Europe during the LGM (Ludwig et al. Citation2016). Conversely, very low temperatures and scarce precipitations in central-northern Europe, south of the Fennoscandian ice sheet, created adverse conditions to the presence of many temperate species in those areas (Ludwig et al. Citation2016). The predicted suitability for M. daubentonii was also found to be very low in the central and southern parts of the Iberian Peninsula, apparently due to the scarce precipitations of the driest quarter. Suitable areas are detectable also in Italy and the Balkans ()), where temperatures and precipitations of the driest quarter display medium-to-high values ()), thanks to a regional southerly atmospheric circulation which brought humidity from the Mediterranean Sea towards the Italian peninsula during the LGM (Giraudi Citation2011). Some exceptions are referred to the mountainous chains of the central Apennines and Dinaric Alps, where during the Last Glacial Maximum, relevant glaciers formed (Hughes & Woodward Citation2008).
The LGM projection for M. capaccinii reveals environmentally suitable areas limited to the southernmost coastal portions of its current range and to the Mediterranean islands, which are characterized by relatively high mean temperatures and medium values of annual precipitations ()).
A certain degree of complementarity between the suitable areas detected for each species emerges in the LGM projections as well, coherently with variations observed for the most range-limiting variables. Furthermore, possible areas of sympatry emerge in southern Italy and the Balkans ()).
The Middle Holocene projections reveal estimated distributions very similar to the current ones for both species ()). Myotis capaccinii’s projections display high suitability areas slightly more extended, especially in the Iberian Peninsula and along the northern coasts of Africa, where monthly precipitations were more abundant than the current ones ()).
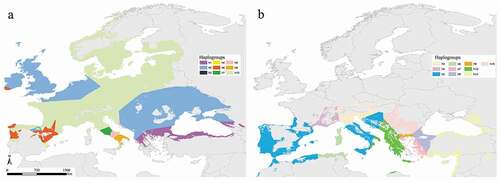
The binarized models obtained for current climatic conditions ()) were used to infer the haplotype network for both species (). With regard to M. daubentonii, a trend of diversity that clearly decreases along the latitudinal gradient south-to-north is found, being especially high in the Italian and Iberian peninsulas ()). Alongside this, the network for M. capaccinii ()) reports the highest density of Voronoi polygons in the Balkans at the Turkish/Greek and Bulgarian borders. This density gradually decreases moving towards the west, with one vast polygon covering the binarized suitable areas in the Iberian Peninsula.
Figure 6. Haplotype network inferred from the binarized current predictions and the genetic information from Nardone (Citation2015) for Myotis daubentonii (a) and Viglino (Citation2012) for Myotis capaccinii (b)
Discussion
Models calibrated for both species showed good performances, with projections to current climate revealing estimated distributions that are largely coherent with the observed distributions of the two species in the study area. Our analysis of the EMs obtained for M. capaccinii and M. daubentonii clearly shows that their current distribution is strongly influenced by both temperature and precipitation-linked variables. This is in line with the responsivity of bats to climatic and microclimatic changes in their environment, as temperature- and precipitation-linked variables deeply affect duration and quality of their hibernation (from 4 to 15°C for M. capaccinii and from 0°C to 10°C for M. daubentonii) and daily torpor, awakening frequency, roost selection, and gestation length (Ransome Citation1971; Ibáñez Citation1997; Park et al. Citation2000; Kerth et al. Citation2001; Boyles Citation2007; Wojciechowski et al. Citation2007; Salari & Kotsakis Citation2011; Ben-Hamo et al. Citation2013). Overall, it appears that M. capaccinii’s distribution is related to the typical Mediterranean climate with hot-to-warm and dry summers, while M. daubentonii’s distribution is related to the temperate-humid climate characterized by warm-to-cool summers and weak seasonality in precipitations (Kottek et al. Citation2006). However, M. capaccinii’s range is primarily limited by mean annual temperature, and less by BIO17, being the species present also in Mediterranean areas where precipitations are more evenly distributed throughout the year and, therefore, summers less dry (as also resulted from the variables’ importance ). On the other hand, M. daubentonii is mainly limited by precipitations of the driest quarter, less by mean annual temperatures, being the species present also in Mediterranean areas with medium-to-high annual temperatures. Thus, common suitable areas turn out to be those where the main requirements relative to the most range-limiting variables are met for both species, high enough annual mean temperatures to ensure M. capaccinii’s presence and, at the same time, wet enough summers for M. daubentonii.
Despite being largely coherent with the observed distributions, the models display some discrepancies, particularly in certain regions of the Iberian Peninsula. In fact, M. daubentonii is marginally present in some areas of southern Spain, where our model predicts very low suitability values; conversely, M. capaccinii is virtually absent in Portugal and inland Andalucia, where our projections display areas of high suitability for this species. As a matter of fact, M. capaccinii’s distribution “anomalies” in the Iberian Peninsula have been already addressed by Garrido-García (Citation2019), who hypothesized that the species’ absence in these environmentally suitable areas is related to changes in its historical distribution, between the Late Pleistocene and Holocene periods (see below).
As previously stated, parapatry between closely related species can be determined by abiotic factors, biotic interactions, or by a combination of both. In this respect, Biscardi et al. (Citation2007) revealed a considerable niche overlap between our two target species due to similar foraging behavior and strategy, diet and, to a certain degree, ecological preferences. However, the question about whether the climatic niche overlap occurring between M. capaccinii and M. daubentonii results in competitive exclusion is still open; in fact, a partial overlap resulted from both HSMs and hypervolume-based analyses, as also observed in other cave-dwelling species in Western Europe (Mammola & Isaia Citation2017; Mammola et al. Citation2021). Compared to M. capaccinii, M. daubentonii is less selective with regards to roost choice, water quality and riparian vegetation’s conditions, making it a potentially stronger competitor. However, the high trophic niche overlap might not lead to competitive exclusion in sympatric areas because their main prey, Chironomids, can be considered an unlimited food resource (Krüger et al. Citation2012). Furthermore, their trophic niches may differ on a finer scale (e.g. distinct predation on adults and pupae, spatial segregation), allowing shared occurrence in the same area as documented by Krüger et al. (Citation2012) for M. daubentonii and another trawling bat species, M. dasycneme Boie.
Given the relatively wide areas of sympatry observed for the two target species, and given the high degree of correspondence between the model-predicted distributions and the observed distributions, we can affirm that the species’ range limits in the study area are likely to be determined by climatic factors. This is also corroborated by the suitability densities measured in occurrence localities found in the sympatric area, graphically shown in . It can be observed that, when responses to environmental predictors for the two target species intersect in a specific range of values, suitability reaches high values for both, as found from case studies on other taxa (e.g. Mammola & Isaia Citation2017; Iannella et al. Citation2017, Citation2018) and historical, macroecological trends (Hewitt Citation1999, Citation2000).
About the projections to the past climate, even though past niche conservatism was reported for some bat species (Rebelo et al. Citation2012; Razgour et al. Citation2013), some plasticity could likely have occurred, thus adding some hidden bias to our predictions.
Our results are coherent with the “refugium theory,” according to which many temperate species survived the glacial maximum in southern refugia and later re-colonized mid-latitude and Northern Europe from the Iberian Peninsula, Italy and the Balkans as confirmed for many other European bat species (Hulva et al. Citation2004; Juste et al. Citation2004; Rossiter et al. Citation2007; Rebelo et al. Citation2012; Razgour et al. Citation2013; Salicini et al. Citation2013). Considering the LGM and MOL projections, similar recolonization routes can be hypothesized also for Myotis daubentonii and M. capaccinii. Apart from southern refugia, our results allowed us to identify potential refugial areas in southwestern France, where LGM projections reveal highly suitable areas for M. daubentonii ()). This hypothesis is also supported by the Late Pleistocene fossil remains found in the Dordogne region (Sevilla & Chaline Citation2011). As for M. capaccinii, we could identify potential refugial areas in the south-western portion of the Iberian Peninsula, northern Africa and along the southern coasts of Greece and Anatolia ()).
Our results are coherent with the preliminary study carried out by Nardone (Citation2015), which confirms that Mediterranean Peninsulas (Italy, Iberia, Balkan) acted as glacial refugia for M. daubentonii and suggests that European populations derived from the postglacial expansions of the Italian and Balkan lineages, while the Iberian lineage remained confined south of the Pyrenees. This is further confirmed by the haplotype network analysis, which reveals a higher haplotype diversity in the Mediterranean peninsulas ()). Moreover, the density of the Voronoi polygons mirrors the predicted suitability levels of the LGM period in these regions: low to medium suitability levels are found in the Balkans, which harbor two haplotypes; high suitability levels are found in the Iberian and especially in the Italian peninsula, where the highest density of Voronoi polygons occurs ()). Central and Northern Europe are almost entirely covered by the ‘h10’ Voronoi polygon which belongs to the Italian lineage, indicating a rapid post-glacial expansion of this northern-Italian haplotype. The ‘h2’ haplotype polygon, which covers the majority of the Balkan Peninsula and Eastern Europe, covers a wide area in Central Europe as well, suggesting its expansion to these regions; however, the presence of this haplotype in the United Kingdom should be further investigated, given that no samples were considered in the research of Nardone (Citation2015). The Iberian Peninsula hosts a high polygon density, including also the ‘h10’ Italian haplotype and the ‘h2’ Balkan haplotype; however, when looking at the map, it is clear that the strictly Iberian haplotype polygons are found only in this region, indicating that no post-glacial expansion beyond the Pyrenees took place (Nardone Citation2015) ()).
About M. capaccinii, molecular analyses carried out by Bilgin et al. (Citation2008) allowed the identification of two glacial differentiation areas in south-eastern Europe, namely the Balkans and Anatolia, corresponding to two distinct haplogroups. The study carried out by Viglino (Citation2012) adds to these haplogroups a third one grouping Sardinian, Spanish and South Italian haplotypes; according to the known M. capaccinii’s fossil records (Garrido-García Citation2019), this common western-Mediterranean haplogroup could be explained by the species’ disappearance in the Iberian Peninsula during the last glacial phase and subsequent recolonization from the Italian peninsula during the Holocene. A support to this last hypothesis results from the suitability predicted by our model on the Iberian Mediterranean coast, which resulted as low during the LGM and medium to high during the MOL period ()). Furthermore, this would also explain M. capaccinii’s current absence from potentially suitable areas in the western part of the Iberian Peninsula (Garrido-García Citation2019).
M. capaccinii’s inferred glacial and post-glacial history is also corroborated as a likely scenario by the haplotype network analysis: the highest density of Voronoi polygons (corresponding to higher haplotype diversity) is found in the Balkans at the Turkish/Greek and Bulgarian borders, where a suture zone of at least two refugia was identified by Bilgin et al. (Citation2008) ()). Considering the LGM map ()), it is likely that these refugia correspond to the southern coasts of Greece and Anatolia, where our models display two distinct areas of high predicted suitability. Fairly high haplotype diversity is found in Italy as well, with a large area in the central and southern parts of the country (including Sicily) harboring haplotype ‘h5’ and Sardinia and Corsica sharing the same haplotype polygon with the northern areas of Algeria and Tunisia. Viglino (Citation2012) hypothesized that the presence of these haplotypes in Italy, both belonging to a unique haplogroup, is due to the movement of individuals from northern Africa to Sardinia and southern Italy, eased by the lowering of sea levels during glaciations. Although samples from northern Africa were not available in Viglino (Citation2012) and, thus, further investigations are to be made, this hypothesis is likely to be true considering the high levels of predicted suitability displayed by our LGM projections in northern Tunisia and Algeria, which suggests the association of a strong refugium with the region. Such connectivity between Italy and the Ibero-Maghrebian region has been detected for several bat species (Bogdanowicz et al. Citation2015).
The Iberian peninsula is entirely covered by the ‘h5’ Voronoi polygon, which is present in central and southern Italy too. The very low haplotype diversity observed in this region would suggest a late post-glacial recolonization, in contrast with both our model projections and Viglino (Citation2012), who identified a potential refugial area in southern Spain, but in agreement with Garrido-García (Citation2019) according to which lack of fossil records dating back to the last glacial phase and the current absence of the species from potentially suitable areas in the western part of the peninsula suggests an Italian post-glacial recolonization ()).
Conclusions
The influence of climate in shaping the distribution of our two target species emerges by the present study, also reinforced by the trends observed in the overlap area. The analysis of these shared areas was confirmed to be of primary importance when dealing with parapatric species, how evidenced also in other researches regarding several case studies on different taxa. The relevance of precipitation- and temperature-related variables was assessed in the co-occurrence areas, with analogous or opposite trends supporting the climate-driven distribution hypothesis, also confirmed by the genetic data. The climate-based HSMs’ current-to-past projections reported biogeographic assets which agree with the general glacial and post-glacial trends found for many species other than bats, thus giving new insights for the interpretation of the current distributions for this taxon. Complementary approaches confirmed our findings, giving interesting insights about the concurrent use and implementation of techniques (Peterson Citation2009; Pahad et al. Citation2020).
Further detailed phylogeographical studies are needed to comprehensively assess the two species’ evolutionary history in the study area; however, considering the acknowledged reliability of HSMs in this field, our results may provide a useful base for future investigations.
Supplemental Material
Download MS Excel (9.8 KB)Supplemental Material
Download MS Excel (99.6 KB)Supplemental Material
Download MS Word (13.4 KB)Disclosure statement
No potential conflict of interest was reported by the author(s).
Supplementary material
Supplemental data for this article can be accessed here.
Additional information
Funding
References
- Acevedo P, Jiménez‐Valverde A, Melo‐Ferreira J, Real R, Alves PC. 2012. Parapatric species and the implications for climate change studies: A case study on hares in Europe. Global Change Biology 18(5):1509–1519. DOI: 10.1111/j.1365-2486.2012.02655.x.
- Alexandri P, Triantafyllidis A, Papakostas S, Chatzinikos E, Platis P, Papageorgiou N, Larson G, Abatzopoulos TJ, Triantaphyllidis C. 2012. The Balkans and the colonization of Europe: The post‐glacial range expansion of the wild boar, Sus scrofa. Journal of Biogeography 39(4):713–723. DOI: 10.1111/j.1365-2699.2011.02636.x.
- Allouche O, Tsoar A, Kadmon R. 2006. Assessing the accuracy of species distribution models: Prevalence, kappa and the true skill statistic (TSS). Journal of Applied Ecology 43(6):1223–1232. DOI: 10.1111/j.1365-2664.2006.01214.x.
- Araújo MB, Anderson RP, Barbosa AM, Beale CM, Dormann CF, Early R, Garcia RA, Guisan A, Maiorano L, Naimi B, O’Hara RB, Zimmermann NE, Rahbek C. 2019. Standards for distribution models in biodiversity assessments. Science Advances 5(1):eaat4858. DOI: 10.1126/sciadv.aat4858.
- Baagøe HJ. 1984. Summer occurrence of Vespertilio murinus Linné-1758 and Eptesicus serotinus (Schreber-1780) (Chiroptera, Mammalia) on Zealand, Denmark, based on records of roosts and registrations with bat detectors. Annalen des Naturhistorischen Museums in Wien. Serie B für Botanik und Zoologie 88/89:281–291.
- Barbet‐Massin M, Jiguet F, Albert CH, Thuiller W. 2012. Selecting pseudo‐absences for species distribution models: How, where and how many? Methods in Ecology and Evolution 3(2):327–338. DOI: 10.1111/j.2041-210X.2011.00172.x.
- Barova S, Streit A. 2018. Action plan for the conservation of all bat species in the European Union 2018–2024. Brussels: European Commission, UNEP and Eurobats. Available: http://ec.europa.eu/environment/nature/conservation/species/action_plans/pdf/EU%20Bats%20Action%20Pl.an.pdf. Accessed Sept 2020 15.
- Barve N, Barve V, Jiménez-Valverde A, Lira-Noriega A, Maher SP, Peterson AT, Soberón J, Villalobos F. 2011. The crucial role of the accessible area in ecological niche modeling and species distribution modeling. Ecological Modelling 222(11):1810–1819. DOI: 10.1016/j.ecolmodel.2011.02.011.
- Ben-Hamo M, Muñoz-Garcia A, Williams JB, Korine C, Pinshow B. 2013. Waking to drink: Rates of evaporative water loss determine arousal frequency in hibernating bats. Journal of Experimental Biology 216(4):573–577. DOI: 10.1242/jeb.078790.
- Bilgin R, Karataş A, Çoraman E, Morales JC. 2008. The mitochondrial and nuclear genetic structure of Myotis capaccinii (Chiroptera: Vespertilionidae) in the Eurasian transition, and its taxonomic implications. Zoologica Scripta 37(3):253–262. DOI: 10.1111/j.1463-6409.2008.00326.x.
- Biscardi S, Russo D, Casciani V, Cesarini D, Mei M, Boitani L. 2007. Foraging requirements of the endangered long‐fingered bat: The influence of micro‐habitat structure, water quality and prey type. Journal of Zoology 273(4):372–381. DOI: 10.1111/j.1469-7998.2007.00337.x.
- Bogdanowicz W, Hulva P, Černá Bolfíková B, Buś MM, Rychlicka E, Sztencel-Jabłonka A, Cistrone L, Russo D. 2015. Cryptic diversity of Italian bats and the role of the Apennine refugium in the phylogeography of the western Palaearctic. Zoological Journal of the Linnean Society 174(3):635–648. DOI: 10.1111/zoj.12248.
- Boyles JG. 2007. Describing roosts used by forest bats: The importance of microclimate. Acta Chiropterologica 9(1):297–303. DOI: 10.3161/1733-5329(2007)9[297:DRUBFB]2.0.CO;2.
- Braz AG, Lorini ML, Vale MM. 2019. Climate change is likely to affect the distribution but not parapatry of the Brazilian marmoset monkeys (Callithrix spp.). Diversity & Distributions 25(4):536–550. DOI: 10.1111/ddi.12872.
- Breiman L. 2001. Random forests. Machine Learning 45(1):5–32. DOI: 10.1023/A:1010933404324.
- Bridle JR, Vines TH. 2007. Limits to evolution at range margins: When and why does adaptation fail? Trends in Ecology & Evolution 22(3):140–147. DOI: 10.1016/j.tree.2006.11.002.
- Brown JL, Bennett JR, French CM. 2017. SDMtoolbox 2.0: The next generation Python-based GIS toolkit for landscape genetic, biogeographic and species distribution model analyses. PeerJ 5:e4095. DOI: 10.7717/peerj.4095.
- Brown MJM, Holland BR, Jordan GJ. 2020. HYPEROVERLAP: Detecting biological overlap in n-dimensional space. Methods in Ecology and Evolution 11(4):513–523. DOI: 10.1111/2041-210X.13363.
- Brunetti M, Magoga G, Iannella M, Biondi M, Montagna M. 2019. Phylogeography and species distribution modelling of Cryptocephalus barii (Coleoptera: Chrysomelidae): Is this alpine endemic species close to extinction? ZooKeys 856:3. DOI: 10.3897/zookeys.856.32462.
- Buckley LB, Jetz W. 2007. Environmental and historical constraints on global patterns of amphibian richness. Proceedings of the Royal Society B: Biological Sciences 274(1614):1167–1173. DOI: 10.1098/rspb.2006.0436.
- Case TJ, Holt RD, McPeek MA, Keitt TH. 2005. The community context of species’ borders: Ecological and evolutionary perspectives. Oikos 108(1):28–46. DOI: 10.1111/j.0030-1299.2005.13148.x.
- Case TJ, Taper ML. 2000. Interspecific competition, environmental gradients, gene flow, and the coevolution of species‘ borders. The American Naturalist 155(5):583–605. DOI: 10.1086/303351.
- Cerasoli F, Iannella M, Biondi M. 2019a. Between the hammer and the anvil: How the combined effect of global warming and the non-native common slider could threaten the European pond turtle. Management of Biological Invasions 10(3):428–448. DOI: 10.3391/mbi.2019.10.3.02.
- Cerasoli F, Thuiller W, Guéguen M, Renaud J, D’Alessandro P, Biondi M. 2019b. The role of climate and biotic factors in shaping current distributions and potential future shifts of European Neocrepidodera (Coleoptera, Chrysomelidae). Insect Diversity and Conservation. DOI: 10.1111/icad.12376.
- Cunningham HR, Rissler LJ, Apodaca JJ. 2009. Competition at the range boundary in the slimy salamander: Using reciprocal transplants for studies on the role of biotic interactions in spatial distributions. Journal of Animal Ecology 78(1):52–62. DOI: 10.1111/j.1365-2656.2008.01468.x.
- Cunningham HR, Rissler LJ, Buckley LB, Urban MC. 2016. Abiotic and biotic constraints across reptile and amphibian ranges. Ecography 39(1):1–8. DOI: 10.1111/ecog.01369.
- Davis BL. 1973. Morphometrics, cytotaxonomy, and evolution of mainland bats of the genus Macrotus (Gray). Lubbock, Texas, US: Texas Tech University.
- De Simone W, Iannella M, D’Alessandro P, Biondi M. 2020. Assessing influence in biofuel production and ecosystem services when environmental changes affect plant–pest relationships. GCB Bioenergy. 12(10):864–877. DOI: 10.1111/gcbb.12727.
- Di Cola V, Broennimann O, Petitpierre B, Breiner FT, D’Amen M, Randin C, Engler R, Pottier J, Pio D, Dubuis A. 2017. ecospat: An R package to support spatial analyses and modeling of species niches and distributions. Ecography 40(6):774–787. DOI: 10.1111/ecog.02671.
- Dietz C, Kiefer A. 2016. Bats of Britain and Europe. London, UK: Bloomsbury Publishing.
- Elith J, Kearney M, Phillips S. 2010. The art of modelling range-shifting species. Methods in Ecology and Evolution 1(4):330–342. DOI: 10.1111/j.2041-210X.2010.00036.x.
- Elith J, Leathwick JR. 2009. Species distribution models: Ecological explanation and prediction across space and time. Annual Review of Ecology, Evolution, and Systematics 40(1):677–697. DOI: 10.1146/annurev.ecolsys.110308.120159.
- Engler J, Rödder D, Elle O, Hochkirch A, Secondi J. 2013. Species distribution models contribute to determine the effect of climate and interspecific interactions in moving hybrid zones. Journal of Evolutionary Biology 26(11):2487–2496. DOI: 10.1111/jeb.12244.
- ESRI. 2010. ArcMap 10.0. Redlands, CA: ESRI.
- Friedman JH. 2001. Greedy function approximation: A gradient boosting machine. Annals of Statistics 29(5):1189–1232.
- Garrido-García JA. 2019. Contextualización en el registro paleontológico de Myotis capaccinii (Bonaparte, 1837) de su presencia en yacimientos íbero-baleares. Journal of Bat Research & Conservation 12(1):33–45. DOI: 10.14709/BarbJ.12.1.2019.05.
- Gent PR, Danabasoglu G, Donner LJ, Holland MM, Hunke EC, Jayne SR, Lawrence DM, Neale RB, Rasch PJ, Vertenstein M. 2011. The community climate system model version 4. Journal of Climate 24(19):4973–4991. DOI: 10.1175/2011JCLI4083.1.
- Gentilli A, Sacchi R, Mangiacotti M, Scali S. 2011. A tribute to Hubert Saint Girons: Niche separation between Vipera aspis and V. berus on the basis of distribution models. Amphibia-Reptilia 32(2):223–233. DOI: 10.1163/017353711X562171.
- Ghanem SJ, Voigt CC. 2012. Increasing awareness of ecosystem services provided by bats. Advances in the Study of Behavior 44:279–302.
- Giraudi C. 2011. Middle Pleistocene to Holocene Glaciations in the Italian Apennines. In: Ehlers J, Gibbard PL, editors. Quaternary glaciations-extent and chronology: Part I: Europe. Vol. 2. Amsterdam: Elsevier. pp. 211–219.
- Glor RE, Warren D. 2011. Testing ecological explanations for biogeographic boundaries. Evolution: International Journal of Organic Evolution 65(3):673–683. DOI: 10.1111/j.1558-5646.2010.01177.x.
- Graham RW, Lundelius EL, Graham MA, Schroeder EK, Toomey RS, Anderson E, Barnosky AD, Burns JA, Churcher CS, Grayson DK. 1996. Spatial response of mammals to late Quaternary environmental fluctuations. Science 272(5268):1601–1606. DOI: 10.1126/science.272.5268.1601.
- Guisan A, Thuiller W, Zimmermann NE. 2017. Habitat suitability and distribution models: With applications in R. Cambridge, UK: Cambridge University Press.
- Haffer J. 1986. Superspecies and species limits in vertebrates. Journal of Zoological Systematics and Evolutionary Research 24(3):169–190. DOI: 10.1111/j.1439-0469.1986.tb00626.x.
- Haffner M, Stutz H. 1985. Abundance of Pipistrellus pipistrellus and Pipistrellus kuhlii foraging at street-lamps. Myotis 23(24):167–172.
- Hanley JA, McNeil BJ. 1982. The meaning and use of the area under a receiver operating characteristic (ROC) curve. Radiology 143(1):29–36. DOI: 10.1148/radiology.143.1.7063747.
- Hewitt G. 1999. Post-glacial re-colonization of European biota. Biological Journal of the Linnean Society 68(1–2):87–112. DOI: 10.1111/j.1095-8312.1999.tb01160.x.
- Hewitt G. 2000. The genetic legacy of the Quaternary ice ages. Nature 405(6789):907–913. DOI: 10.1038/35016000.
- Hijmans RJ, Cameron SE, Parra JL, Jones PG, Jarvis A. 2005. Very high resolution interpolated climate surfaces for global land areas. International Journal of Climatology 25(15):1965–1978. DOI: 10.1002/joc.1276.
- Hijmans RJ, Elith J. 2016. dismo-package: Species distribution modeling with R. R package version 1.1-1.
- Huey RB. 1979. Parapatry and niche complementarity of Peruvian desert geckos (Phyllodactylus): The ambiguous role of competition. Oecologia 38(3):249–259. DOI: 10.1007/BF00345186.
- Hughes PD, Woodward JC. 2008. Timing of glaciation in the Mediterranean mountains during the last cold stage. Journal of Quaternary Science: Published for the Quaternary Research Association 23(6‐7):575–588. DOI: 10.1002/jqs.1212.
- Hulva P, Horáček I, Strelkov PP, Benda P. 2004. Molecular architecture of Pipistrellus pipistrellus/Pipistrellus pygmaeus complex (Chiroptera: Vespertilionidae): Further cryptic species and Mediterranean origin of the divergence. Molecular Phylogenetics and Evolution 32(3):1023–1035. DOI: 10.1016/j.ympev.2004.04.007.
- Hutchinson GE. 1957. Concluding remarks. Cold Spring Harbor Symposia on Quantitative Biology 22:415–427. DOI: 10.1101/SQB.1957.022.01.039.
- Hutson A, Spitzenberger F, Aulagnier S, Juste J, Karatas A, Palmeirim J, Paunovic M. 2010. Myotis capaccinii. The IUCN Red List of threatened species. Downloaded on 6 April 2021.
- Iannella M, Cerasoli F, Biondi M. 2017. Unraveling climate influences on the distribution of the parapatric newts Lissotriton vulgaris meridionalis and L. italicus. Frontiers in Zoology 14(1):55. DOI: 10.1186/s12983-017-0239-4.
- Iannella M, D’Alessandro P, Biondi M. 2018. Evidences for a shared history for spectacled salamanders, haplotypes and climate. Scientific Reports 8(1):16507. DOI: 10.1038/s41598-018-34854-1.
- Iannella M, D’Alessandro P, De Simone W, Biondi M. 2021. Habitat specificity, host plants and areas of endemism for the genera-group Blepharida s.l. in the afrotropical region (Coleoptera, Chrysomelidae, Galerucinae, Alticini). Insects 12(4):299. DOI: 10.3390/insects12040299.
- Iannella M, D’Alessandro P, Longo S, Biondi M. 2019a. New records and potential distribution by ecological niche modelling of the adventive leaf beetle Monoxia obesula Blake in the Mediterranean area (Coleoptera, Chrysomelidae, Galerucinae). Bulletin of Insectology 72(1):135–142.
- Iannella M, De Simone W, D’Alessandro P, Console G, Biondi M. 2019b. Investigating the current and future co-occurrence of Ambrosia artemisiifolia and Ophraella communa in Europe through ecological modelling and remote sensing data analysis. International Journal of Environmental Research and Public Health 16(18):3416. DOI: 10.3390/ijerph16183416.
- Iannella M, Fiasca B, Di Lorenzo T, Biondi M, Di Cicco M, Galassi D. 2020. Jumping into the grids: Mapping biodiversity hotspots in groundwater habitat types across Europe. Ecography 43(12):1825–1841. DOI: 10.1111/ecog.05323.
- Iannella M, Liberatore L, Biondi M. 2016. The effects of a sudden urbanization on micromammal communities: A case study of post-earthquake L’Aquila (Abruzzi Region, Italy). Italian Journal of Zoology 83(2):255–262. DOI: 10.1080/11250003.2016.1149235.
- Ibáñez C. 1997. Winter reproduction in the greater mouse-eared bat (Myotis myotis) in South Iberia. Journal of Zoology 243(4):836–840. DOI: 10.1111/j.1469-7998.1997.tb01981.x.
- Juste J, Ibáñez C, Muñoz J, Trujillo D, Benda P, Karataş A, Ruedi M. 2004. Mitochondrial phylogeography of the long-eared bats (Plecotus) in the Mediterranean Palaearctic and Atlantic Islands. Molecular Phylogenetics and Evolution 31(3):1114–1126. DOI: 10.1016/j.ympev.2003.10.005.
- Kerth G, Weissmann K, König B. 2001. Day roost selection in female Bechstein’s bats (Myotis bechsteinii): A field experiment to determine the influence of roost temperature. Oecologia 126(1):1–9. DOI: 10.1007/s004420000489.
- Key K. 1981. Species, parapatry, and the morabine grasshoppers. Systematic Biology 30(4):425–458. DOI: 10.1093/sysbio/30.4.425.
- Khimoun A, Cornuault J, Burrus M, Pujol B, Thebaud C, Andalo C. 2013. Ecology predicts parapatric distributions in two closely related Antirrhinum majus subspecies. Evolutionary Ecology 27(1):51–64. DOI: 10.1007/s10682-012-9574-2.
- Köppen W. 1900. Versuch einer Klassifikation der Klimate, vorzugsweise nach ihren Beziehungen zur Pflanzenwelt. Geographische Zeitschrift 6(11.H):593–611.
- Kottek M, Grieser J, Beck C, Rudolf B, Rubel F. 2006. World map of the Köppen-Geiger climate classification updated. Meteorologische Zeitschrift 15(3):259–263. DOI: 10.1127/0941-2948/2006/0130.
- Krüger F, Harms I, Fichtner A, Wolz I, Sommer RS. 2012. High trophic similarity in the sympatric North European trawling bat species Myotis daubentonii and Myotis dasycneme. Acta Chiropterologica 14(2):347–356.
- Kruskop S, Godlevska L, Bücs S, Çoraman E, Gazaryan S. 2020. Myotis daubentonii. The IUCN Red List of threatened species. Downloaded on Apr 6 2021.
- Lawing AM, Meik JM, Polly PD. 2012. Climate and competition shape species‘ borders: A study of the Panamint (Crotalus stephensi) and Speckled (Crotalus mitchellii) Rattlesnakes. ISRN Zoology 2012:1–6. DOI: 10.5402/2012/528745.
- Ludwig P, Schaffernicht EJ, Shao Y, Pinto JG. 2016. Regional atmospheric circulation over Europe during the last glacial maximum and its links to precipitation. Journal of Geophysical Research: Atmospheres 121(5):2130–2145.
- Mammola S, Hesselberg T, Lunghi E. 2021. A trade‐off between latitude and elevation contributes to explain range segregation of broadly distributed cave‐dwelling spiders. Journal of Zoological Systematics and Evolutionary Research 59(2):370–375. DOI: 10.1111/jzs.12432.
- Mammola S, Isaia M. 2017. Rapid poleward distributional shifts in the European cave‐dwelling meta spiders under the influence of competition dynamics. Journal of Biogeography 44(12):2789–2797. DOI: 10.1111/jbi.13087.
- Marmion M, Parviainen M, Luoto M, Heikkinen RK, Thuiller W. 2009. Evaluation of consensus methods in predictive species distribution modelling. Diversity & Distributions 15(1):59–69. DOI: 10.1111/j.1472-4642.2008.00491.x.
- McQuillan MA, Rice AM. 2015. Differential effects of climate and species interactions on range limits at a hybrid zone: Potential direct and indirect impacts of climate change. Ecology and Evolution 5(21):5120–5137. DOI: 10.1002/ece3.1774.
- Nardone V. 2015. Ecology and phylogeography of the riparian habitat specialist Myotis daubentonii. Naples, Italy: University of Naples Federico II.
- Pahad G, Montgelard C, van Vuuren BJ. 2020. Phylogeography and niche modelling: Reciprocal enlightenment. Mammalia 84(1):10–25. DOI: 10.1515/mammalia-2018-0191.
- Palkopoulou E, Dalén L, Lister AM, Vartanyan S, Sablin M, Sher A, Edmark VN, Brandström MD, Germonpré M, Barnes I. 2013. Holarctic genetic structure and range dynamics in the woolly mammoth. Proceedings of the Royal Society B: Biological Sciences 280(1770):20131910. DOI: 10.1098/rspb.2013.1910.
- Park KJ, Jones G, Ransome RD. 2000. Torpor, arousal and activity of hibernating Greater Horseshoe Bats (Rhinolophus ferrumequinum). Functional Ecology 14(5):580–588. DOI: 10.1046/j.1365-2435.2000.t01-1-00460.x.
- Peterson AT. 2009. Perspective: Phylogeography is not enough: The need for multiple lines of evidence. Frontiers of Biogeography 1(1):19–25. DOI: 10.21425/F5FBG12232.
- Peterson AT, Soberón J. 2012. Species distribution modeling and ecological niche modeling: Getting the concepts right. Natureza & Conservacao 10(2):102–107. DOI: 10.4322/natcon.2012.019.
- Prescott GW, Williams DR, Balmford A, Green RE, Manica A. 2012. Quantitative global analysis of the role of climate and people in explaining late Quaternary megafaunal extinctions. Proceedings of the National Academy of Sciences 109(12):4527–4531. DOI: 10.1073/pnas.1113875109.
- R Core Team. 2016. R: A language and environment for statistical computing. Vienna, Austria: R Foundation for Statistical Computing. Available: http://www.R-project.org/. Accessed Jul 2016 15.
- Ransome R. 1971. The effect of ambient temperature on the arousal frequency of the hibernating greater horseshoe bat, Rhinolophus ferrumequinum, in relation to site selection and the hibernation state. Journal of Zoology 164(3):353–371. DOI: 10.1111/j.1469-7998.1971.tb01323.x.
- Razgour O, Juste J, Ibáñez C, Kiefer A, Rebelo H, Puechmaille SJ, Arlettaz R, Burke T, Dawson DA, Beaumont M. 2013. The shaping of genetic variation in edge‐of‐range populations under past and future climate change. Ecology Letters 16(10):1258–1266. DOI: 10.1111/ele.12158.
- Rebelo H, Froufe E, Brito JC, Russo D, Cistrone L, Ferrand N, Jones G. 2012. Postglacial colonization of Europe by the barbastelle bat: Agreement between molecular data and past predictive modelling. Molecular Ecology 21(11):2761–2774. DOI: 10.1111/j.1365-294X.2012.05566.x.
- Rebelo H, Tarroso P, Jones G. 2010. Predicted impact of climate change on European bats in relation to their biogeographic patterns. Global Change Biology, 16(2):561–576.
- Richards CL, Carstens BC, Lacey Knowles L. 2007. Distribution modelling and statistical phylogeography: An integrative framework for generating and testing alternative biogeographical hypotheses. Journal of Biogeography 34(11):1833–1845.
- Rodríguez-Rodríguez D, Martínez-Vega J, Echavarría P. 2019. A twenty year GIS-based assessment of environmental sustainability of land use changes in and around protected areas of a fast developing country: Spain. International Journal of Applied Earth Observation and Geoinformation 74:169–179. DOI: 10.1016/j.jag.2018.08.006.
- Root T. 1988. Energy constraints on avian distributions and abundances. Ecology 69(2):330–339. DOI: 10.2307/1940431.
- Rossiter SJ, Benda P, Dietz C, Zhang S, Jones G. 2007. Rangewide phylogeography in the greater horseshoe bat inferred from microsatellites: Implications for population history, taxonomy and conservation. Molecular Ecology 16(22):4699–4714. DOI: 10.1111/j.1365-294X.2007.03546.x.
- Rudke AP, de Souza VAS, Dos Santos AM, Xavier ACF, Rotunno Filho OC, Martins JA. 2020. Impact of mining activities on areas of environmental protection in the southwest of the Amazon: A GIS-and remote sensing-based assessment. Journal of Environmental Management 263:110392. DOI: 10.1016/j.jenvman.2020.110392.
- Rutishauser MD, Bontadina F, Braunisch V, Ashrafi S, Arlettaz R. 2012. The challenge posed by newly discovered cryptic species: Disentangling the environmental niches of long‐eared bats. Diversity & Distributions 18(11):1107–1119. DOI: 10.1111/j.1472-4642.2012.00904.x.
- Salari L, Kotsakis T. 2011. Late Pleistocene and Holocene bats of Latium (Central Italy). Il Quaternario 24:121–129.
- Salicini I, Ibáñez C, Juste J. 2013. Deep differentiation between and within Mediterranean glacial refugia in a flying mammal, the Myotis nattereri bat complex. Journal of Biogeography 40(6):1182–1193. DOI: 10.1111/jbi.12062.
- Santos H, Juste J, Ibáñez C, Palmeirim JM, Godinho R, Amorim F, Alves P, Costa H, De Paz O, Pérez-Suarez G. 2014. Influences of ecology and biogeography on shaping the distributions of cryptic species: Three bat tales in Iberia. Biological Journal of the Linnean Society 112(1):150–162. DOI: 10.1111/bij.12247.
- Sevilla P, Chaline J. 2011. New data on bat fossils from middle and upper Pleistocene localities of France. Geobios 44(2–3):289–297. DOI: 10.1016/j.geobios.2011.01.002.
- Sexton JP, McIntyre PJ, Angert AL, Rice KJ. 2009. Evolution and ecology of species range limits. Annual Review of Ecology, Evolution, and Systematics 40(1):415–436. DOI: 10.1146/annurev.ecolsys.110308.120317.
- Sillero N, Barbosa AM. 2020. Common mistakes in ecological niche models. International Journal of Geographical Information Science 1–14. DOI: 10.1080/13658816.2020.1798968.
- Soberon J, Peterson AT. 2005. Interpretation of models of fundamental ecological niches and species’ distributional areas. Biodiversity Informatics 2:1–10. DOI: 10.17161/bi.v2i0.4.
- Sommer R, Nadachowski A. 2006. Glacial refugia of mammals in Europe: Evidence from fossil records. Mammal Review 36(4):251–265. DOI: 10.1111/j.1365-2907.2006.00093.x.
- Sommer RS, Zachos FE. 2009. Fossil evidence and phylogeography of temperate species:‘glacial refugia’and post‐glacial recolonization. Journal of Biogeography 36(11):2013–2020. DOI: 10.1111/j.1365-2699.2009.02187.x.
- Stewart JR, Lister AM. 2001. Cryptic northern refugia and the origins of the modern biota. Trends in Ecology & Evolution 16(11):608–613. DOI: 10.1016/S0169-5347(01)02338-2.
- Stralberg D, Matsuoka S, Hamann A, Bayne E, Sólymos P, Schmiegelow F, Wang X, Cumming S, Song S. 2015. Projecting boreal bird responses to climate change: The signal exceeds the noise. Ecological Applications 25(1):52–69. DOI: 10.1890/13-2289.1.
- Taberlet P, Fumagalli L, Wust‐Saucy A, Cosson J. 1998. Comparative phylogeography and postglacial colonization routes in Europe. Molecular Ecology 7(4):453–464. DOI: 10.1046/j.1365-294x.1998.00289.x.
- Thuiller W. 2003. BIOMOD–optimizing predictions of species distributions and projecting potential future shifts under global change. Global Change Biology 9(10):1353–1362. DOI: 10.1046/j.1365-2486.2003.00666.x.
- Thuiller W, Georges D, Engler R. 2016. biomod2: Ensemble platform for species distribution modeling. R package version 3.3–7. Available: http://CRAN.R-project.org/package=biomod2. Accessed Jul 2016 20.
- Thuiller W, Lafourcade B, Engler R, Araújo MB. 2009. BIOMOD – A platform for ensemble forecasting of species distributions. Ecography 32(3):369–373. DOI: 10.1111/j.1600-0587.2008.05742.x.
- Viglino A. 2012. Study of variability and genetic structure of European populations of Myotis emarginatus and Myotis capaccinii (Chiroptera, Vespertilionidae). Bologna, Italy: Alma Mater Studiorum University of Bologna.
- Watanabe S, Hajima T, Sudo K, Nagashima T, Takemura T, Okajima H, Nozawa T, Kawase H, Abe M, Yokohata T. 2011. MIROC-ESM 2010: Model description and basic results of CMIP5-20c3m experiments. Geoscientific Model Development 4(4):845. DOI: 10.5194/gmd-4-845-2011.
- Werner P, Lötters S, Schmidt BR, Engler JO, Rödder D. 2013. The role of climate for the range limits of parapatric European land salamanders. Ecography 36(10):1127–1137. DOI: 10.1111/j.1600-0587.2013.00242.x.
- Wiens JJ. 2011. The niche, biogeography and species interactions. Philosophical Transactions of the Royal Society B: Biological Sciences 366(1576):2336–2350. DOI: 10.1098/rstb.2011.0059.
- Wiens JJ, Graham CH. 2005. Niche conservatism: Integrating evolution, ecology, and conservation biology. Annual Review of Ecology, Evolution, and Systematics 36(1):519–539. DOI: 10.1146/annurev.ecolsys.36.102803.095431.
- Wojciechowski MS, Jefimow M, Tęgowska E. 2007. Environmental conditions, rather than season, determine torpor use and temperature selection in large mouse-eared bats (Myotis myotis). Comparative Biochemistry and Physiology Part A, Molecular & Integrative Physiology 147(4):828–840. DOI: 10.1016/j.cbpa.2006.06.039.