
 ?Mathematical formulae have been encoded as MathML and are displayed in this HTML version using MathJax in order to improve their display. Uncheck the box to turn MathJax off. This feature requires Javascript. Click on a formula to zoom.
Abstract
Bottlenose dolphins (Tursiops truncatus) make extensive use of narrowband whistles with individually distinctive frequency modulations to broadcast their identity: the signature whistles. The acoustic structure of the signature whistles tends to be stable over decades. Therefore, these vocalisations have the potential to be used for monitoring individuals over time. Our study investigated the acoustic structure of the signature whistles of the demographic unit of bottlenose dolphins inhabiting the Eastern Ligurian Sea (Italy), within the Pelagos Sanctuary. Through visual categorisation of spectrograms, we identified 941 whistle contours, 469 of them were classified as signature whistles using the SIGnature IDentification (SIG-ID) method. We further grouped these into 19 different categories based on their stereotyped frequency modulation patterns. To support our categorisation, we used a combination of a visual classification task conducted by six naïve judges and an automated analysis, the principal component analysis. Overall, this study characterises the signature whistles of the demographic unit of bottlenose dolphins inhabiting the Ligurian Sea for the first time. Furthermore, when comparing the acoustic features of these whistles with those of other different demographic units available from the literature, we observed differences in the values of the minimum and maximum frequencies. Considering the critical vessel traffic of our study area, we interpreted these variations in light of the high levels of anthropogenic noise. We recommend further investigations to understand the mechanisms underpinning the acoustic variation of bottlenose dolphins’ signature whistles and to elaborate effective management and protection policies for this species.
Introduction
Bottlenose dolphins (Tursiops truncatus Montagu, 1821) live in fission–fusion societies in which different social units can merge into the same group (fusion) or split into smaller groups (fission), thus making the group size and composition dynamic and fluid over time (Connor et al. Citation2000). Dolphins also live in an aquatic environment characterised by a fast transmission of sound and where the turbidity and the light absorption by the water column hindered the vision (Nummela et al. Citation2007). Accordingly, this species has developed one of the most complex and sophisticated acoustic communication systems in the animal kingdom. They use high-frequency broadband clicks for echolocation, whistles for intraspecific communication and burst pulsed sounds for both (Au & Hastings Citation2008; Favaro et al. Citation2013; Finneran Citation2013).
Whistles are narrowband and frequency-modulated sounds, ranging from 1 to 30 kHz and with an average duration between 0.1 and 4.1 s (Buckstaff Citation2004; Sayigh & Janik Citation2010). During the early stages of a bottlenose dolphin’s life, each individual develops an individually distinctive frequency modulation pattern that broadcasts its identity: the signature whistle (SW) (Caldwell & Caldwell Citation1968). All other whistles are defined as non-SWs (Caldwell et al. Citation1990).
Dolphins often emit SWs in bouts, in which the frequency contours – and not the vocal cues – are stereotyped (Sayigh et al. Citation2017). SWs show considerable interindividual variation and much smaller intraindividual variation (Janik et al. Citation1994). Despite this, SWs of the same type (i.e. belonging to the same individual) are characterised by different acoustic features, and can prevent deletion and repetition of certain parts of the whistle. For example, dolphins can emit both the entire contour of their SW or just some of their parts (Tyack Citation1986).
Previous research showed that SWs are essential in the mother–calf relationship. Indeed, during the post-partum, the mother increases her SW emissions, likely to allow the calf to imprint on her whistle (Caldwell & Caldwell Citation1968; Mello & Amundin Citation2005; Gnone & Moriconi Citation2010). Furthermore, within the first 3 months of life, calves develop their own crystallised SW (Caldwell & Caldwell Citation1979). The auditory experience influences the development of SWs (Janik & Slater Citation1997); indeed, calves model their SWs by imitating the community member ones with whom they are not highly related. They probably do this to make their sounds distinguishable from the kin conspecifics (Fripp et al. Citation2005). Social experience, hence, is at the base of the process about the modulation of SWs in dolphins (Janik & Sayigh Citation2013; Favaro et al. Citation2016). Later, with the growth of the calf, the SW is also used for the mother–calf reunion (Smolker et al. Citation1993). Beyond the use in the mother–calf relationship, SWs are exploited by bottlenose dolphins in the maintaining of group cohesion (Janik & Slater Citation1998). Indeed, the distances between individuals at sea are highly variable, and cohesion calls are more efficient than visual cues to maintain contact with the rest of the group.
SWs, once crystallised, are stable over decades (Sayigh et al. Citation1990, Citation2007; Gnone & Moriconi Citation2010). However, variation may occur when males form alliances – social units composed by males that cooperate against other males mainly for reproductive goals – to resemble a whistle of alliance partner (Smolker & Pepper Citation1999).
SWs have been studied since 60s in captive bottlenose dolphins. Instead, studies in the wild environment are scarce. One of the historical methods to match SWs with the emitter is through the isolation of individuals from the rest of the group (Caldwell et al. Citation1990; Janik et al. Citation1994). Such experimental background is easy to achieve in controlled (ex situ) conditions. It is possible to study wild bottlenose dolphins in temporary isolation using capture-release events that allow the matching of an individual with its SW. This method has been used in Sarasota Bay (Florida) as part of the Sarasota Dolphin Research Program since 1970 (Scott et al. Citation1990). However, it requires expensive resources, decade-long expertise, and permits to capture-release the dolphins, so it is rarely used elsewhere.
In 2013, Janik and colleagues showed that bottlenose dolphins tend to deliver SWs within a bout criterion with an inter-whistle interval (IWI) ranging from 1 to 10 seconds. Accordingly, they developed the SIGnature IDentification (SIG-ID) method. This method allows identifying SW types in recorded sounds of unrestrained individuals through the identification of the stereotyped frequency contour and the analysis of IWIs. The SIGI-ID approach is also broadly conservative, excluding the occurrence of false positives while allowing a minimal percentage of false negatives (Janik et al. Citation2013).
To date, most of the literature published about wild bottlenose dolphins’ vocalisations focuses on their whistle repertoire. The comparison of whistles collected from different populations shows the presence of differences in acoustic features of their vocalisations, highlighting the fact of geographic variation in the acoustic signals of this species (Ding et al. Citation1995; May-Collado & Wartzok Citation2008; Papale et al. Citation2013). Other studies explain the acoustic variation of dolphins’ whistles, considering the anthropogenic noise disturbance that leads to an increase in frequency (Buckstaff Citation2004; Heiler et al. Citation2016). However, different approaches between research groups make it difficult to draw comparisons among acoustic data. The current literature examines mostly captive dolphins and long-term studies regarded just one wild population (bottlenose dolphins from Sarasota Bay, Florida). For this reason, in more recent research about SWs of Namibia dolphins, Kriesell et al. (Citation2014) have highlighted the lack of studies about the acoustic characteristics of SWs from wild bottlenose dolphins.
Along the Ligurian coast, there is a demographic unit of bottlenose dolphins composed today of nearly 200 individuals (Manfredini et al. Citation2007). This study aims first to identify and describe the acoustic structure of the SWs emitted by this demographic unit. Most of the studies about that narrowband sounds focused on the whole whistles’ repertoire, without distinction between signature and non-SWs. We choose to focus on SW analysis because this sounds category tends to be stable within individuals over the decades. Therefore, their identification and monitoring across the years will be useful (1) for acoustic monitoring of the demographic unit inhabiting the Ligurian sea and (2) for studying acoustic variations over time and between different populations. Finally, we compared the acoustic parameters of the SWs of the Liguria demographic unit with those available from the literature. The increase in acoustic data collection of wild bottlenose dolphin SWs allows shedding light on the variability of the whistle signalling, providing a better understanding of the different acoustic features that characterise SWs within and between populations.
Materials and methods
Study area
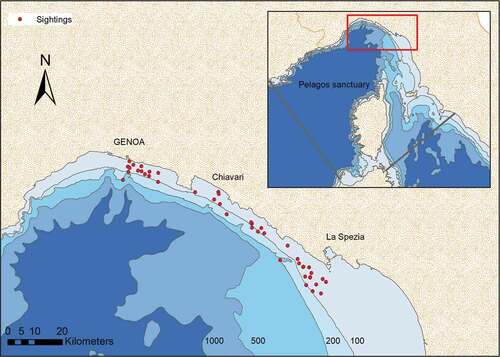
The data collection took place along the Eastern Ligurian coast (Italy), within the Pelagos Sanctuary (). In this area lives a demographic unit of bottlenose dolphins composed of nearly 200 individuals. Their presence is stable over the years and confined to the continental shelf (Manfredini et al. Citation2007; Gnone et al. Citation2011). The project “Delfini Metropolitani” (Caltavuturo et al. Citation2001) founded by Acquario di Genova studied these individuals since 2001 through continuous monitoring and a massive effort of photo-ID, aimed to create a catalogue with all the individuals identified.
Figure 1. Study area. Red dots indicate the areas where the sightings of the bottlenose dolphins occurred during the two field seasons
Data collection
We collected data during two consecutive field seasons (July–October 2018 and May–October 2019). Surveys were conducted during daylight with good weather conditions and calm waters (Douglas scale <3 and Beaufort scale <3), using a 5.1 m inflatable boat with a 40-hp outboard engine.
Once we sighted the dolphins, we followed them, adjusting the speed of the boat according to the swimming speed of the pod, maintaining a distance of about 50 meters. After counting the number of adult individuals and calves, we turned off the engine to reduce boat noise and began collecting acoustic recordings using a HTI-96-MIN marine-mammal hydrophone (2 Hz–30 kHz flat frequency response; sensitivity −164 dB re: 1 V/μPa) lowered to a depth of 5 m. The hydrophone output signal was digitized with a professional Zoom H5 Handy recorder (96-kHz sampling frequency) and saved as an audio file in .wav format (16-bit resolution).
Acoustic analysis
Acoustic recordings were analysed through visual inspection of spectrograms using Praat v. 6.0.54 (Boersma & Weenink Citation2020). For each file, we generated the waveform and the fast Fourier transform spectrogram using the following setting: view range from 0 to 48 kHz, window length = 0.02 s and dynamic range = 80 dB.
The basic unit of this study was the whistle contour identified as any narrowband tonal signal lasting 0.1 s or more with at least part of the fundamental frequency above 3 kHz (Simard et al. Citation2011). Through the inspection of spectrograms, we analysed and classified contours obtaining that every narrowband whistle was classified as non-SWs or as a stereotyped SW. Once we found whistles with stereotyped contours, we analysed the IWIs to apply the SIG-ID method. To be considered a SW every whistle must have (1) at least four stereotyped contours and (2) at least 75% of its IWI range from 1 to 10 s. After using SIG-ID method, we classified every whistle contour collected as a signature or non-SW. We considered every stereotyped whistle that did not pass the SIG-ID criteria as non-SWs for this analysis. Contours interrupted by very short breaks (< 0.03 s) were treated as continuous as suggested by Gridley et al. (Citation2012).
Finally, we extracted the pitch contour of the fundamental frequency of each whistle in MATLAB® using the “Beluga” toolbox (available for download at http://biology.st-andrews.ac.uk/soundanalysis/). We measured the following eight acoustic parameters through a custom-built script: start frequency, end frequency, minimum frequency, maximum frequency, mean frequency, frequency range (the difference between the maximum and minimum frequency), duration, number of inflexions points (i.e. any change of slope from positive to negative or vice versa).
Statistical analysis
To test the reliability of the visual classification performed by the lead author of this study (FT), we followed the classification task performed by Kriesell et al. (Citation2014). We chose six independent judges without experience in the bioacoustics field. They were asked to perform a preliminary task using eight SW types, randomly chosen. For each SW, we selected by chance five contours for a total of 40 SW contours. First, the judges compared the 40 SW contours with each other, rating their similarity (Supplementary Material 1). Second, we proposed to the judges the second task, based on a binary choice: they had to assign every contour to one of the two most similar categories proposed, selected based on the previous task (Supplementary Material 2). On this latter task, the first author of this study (FT), who categorised the whistles, also participated. We calculated the Fleiss’s kappa statistic to test the inter-observer agreement and compared the ratings between the judges. If judges are in complete agreement, the Fleiss’s kappa is equal to 1.
For each encounter, we calculated the emission rate of the SWs per group
We performed a principal component analysis (PCA) using the eight acoustic parameters as independent variables that were reduced to a new set of three independent principal components (PCs). We calculated the loadings of the PCs to interpret the correlation between original variables and the unit-scaled components, reporting a coefficient of correlation that linked old and new variables. Accordingly, we plotted the SWs in a three-dimensional space defined by PC1 – PC2 – PC3. Furthermore, we plotted each SW type to emphasise the stereotype of the frequency modulation pattern.
Results
Overall, during the two data collection fields, we conducted 48 daily boat surveys with a total of 42 sightings of bottlenose dolphins. Group size varies from at least two individuals up to 31. We sighted at least one calf in 83.9% of the encounters. During the encounters, we collected 06:31 hours of audio recording and identified 941 whistle contours emitted during 20 encounters. According to the SIG-ID criteria, 472 were non-SWs and 469 SWs, which we further grouped in 19 frequency modulation types. We identified 14 SW types during the first year of data collection, five during the second year, three of which identified during the second year but recorded during both years (). The number of samples per SW type ranged from 4 to 141 (mean ± SD 25 ± 32).
Figure 2. Pitch contours extracted for the 19 signature whistle types identified using the SIG-ID method
SWs account for 49.84% of the overall identified contours with an emission rate of 1.20 SWs per minute. The acoustic parameters measured for each SW type are presented in .
Table I. Mean ± standard deviation (SD) of acoustic parameters of the 19 signature whistle types
It is important to note that dolphins often emitted their SWs as connected multi-loop (the same unit repeats in time without intervals) and for this reason the flection points of some of them could result with high values.
The inter-observer agreement resulted in a high K-Fleiss statistic either with (K-Fleiss = 0.630, p < 0.001) or without the first author as judge (K-Fleiss = 0.693, p < 0.001).
We found a positive correlation between-group size and the emission of the whistles. Number of individuals is positively correlated with whole whistles (signature + non-SWs) emission rate (Tau = 0.652, p = 0.001), SW emission rate (Tau = 0.442, p = 0.011) and SW type (Tau = 0.490, p = 0.005).
The PCA reduced the eight acoustic parameters measured on SWs to three independent PCs that explained 82.13% of the total variance (PC 1 = 39.87%; PC2 = 25.03%; PC3 = 17.22%). In the three-dimensional space identified by PCs, SWs made different clusters, highlighting an individual frequency modulation pattern among SW type ().
Figure 3. Signature whistle types plotted in the space defined by the first three Principal Components. In the figure are represented four different rotation angles of the 3-D representation
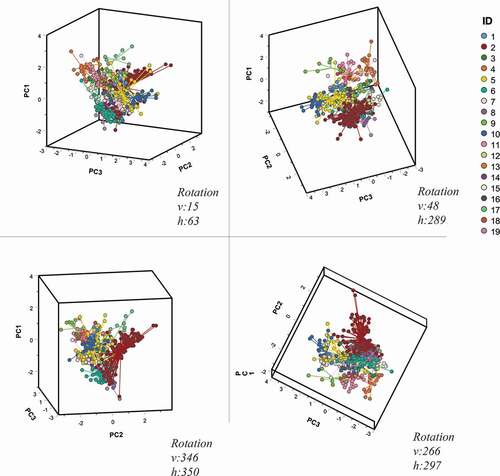
The canonical loadings showed that acoustic parameters most correlated with PC1 are max frequency, min frequency, and mean frequency (). For PC2, the most correlated acoustic parameters are range frequency and duration. Instead, PC3 was most correlated to start frequency and minimum frequency ().
Table II. Mean ± standard deviation (SD) of the parameters for the signature whistles pooled
Table III. Results of the principal component analysis. The table shows the canonical loading of the acoustic parameters of the first three principal components
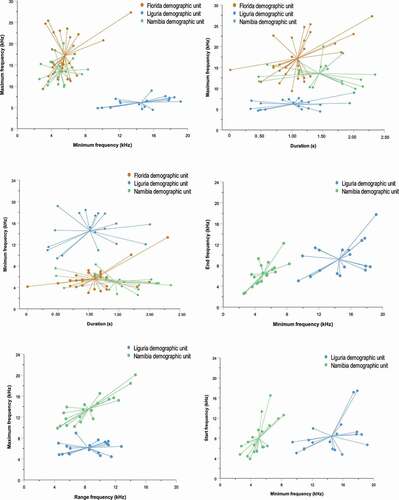
We compared the acoustic parameters of the 19 SW types recorded in the eastern Ligurian Sea with the data available in the literature: Sarasota Bay, Florida (Esch et al. Citation2009), and Walvis Bay, Namibia (Kriesell et al. Citation2014). The mean minimum frequency ranges from 3 to 13.3 kHz in Florida, from 2.59 to 8.29 kHz in Namibia and from 4.43 to 8.94 kHz in dolphins inhabiting the eastern Ligurian Sea. The mean maximum frequency ranges from 9.3 to 27.3 kHz in Namibia, from 9.88 to 20.6 kHz in Florida and from 9.43 to 19.18 kHz in the Ligurian Sea. The comparison showed that the minimum frequency is higher for the SWs of the Ligurian Sea, while the maximum frequency shows higher values in the bottlenose dolphins recorded in Florida and Namibia (). All the other acoustic parameters are similar between demographic units.
Figure 4. Scatterplots showing the comparison between the acoustic parameters of the signature whistles recorded in Namibia (Kriesell et al. Citation2014), Florida (Esch et al. Citation2009), and Liguria (present study). For the Florida population, only the average duration, average minimum frequency, and average maximum frequency were available
Discussion
In this study, we characterised for the first time the acoustic features of the SWs emitted by the demographic unit of bottlenose dolphins inhabiting the Eastern Ligurian Sea.
Through visual categorisation and using SIG-ID method (Janik et al. Citation2013), we identified 469 SWs that were categorised in 19 SW types. It is interesting to note that 95 whistles, initially classified as stereotyped contours, were further considered as non-SWs because they did not match the SIG-ID criteria on IWIs. Despite a clear stereotypy in their frequency contours, we excluded these vocalisations because they did not have an inter-whistle interval ranging from 1 to 10 s. However, the SIG-ID method is highly conservative; therefore, this exclusion could be explained as the presence of false negatives (Janik et al. Citation2013).
Importantly, we cross-confirmed the results of our visual classification using external judges and avoiding automated procedures since SWs are challenging to categorise through computerised procedures. Accordingly, the studies of Janik (Citation1999) and Sayigh et al. (Citation2007) confirmed that for SW classification human observers performed better than computer methods. Indeed, the same SW type could appear as a single unit or as the same unit repeated in time (multi-loop whistles), as well as only presenting the initial or final portion of the signal (Tyack Citation1986; Gnone & Moriconi Citation2010). Those variations made difficult the categorisation through automated methods.
We observed a high inter-observer agreement in the human-based classification of the SW types, and similar to those obtained by Kriesell et al. (Citation2014). Remarkably, the presence of the author as a judge resulted in a lower inter-observer agreement. This means that there are some ratings in which judges agreed with each other but not with the lead author of the study (and then, with her categorisation). Interestingly, from the ratings, it is possible to note that the judges and the author mainly disagreed about SW types 2 and 12. Indeed, both whistles are connected multi-loop with similar frequency modulation contours and naïve judges focused on multi-loop shape not considering the slope of contours. Therefore, one should be careful when proposing multi-loop whistles for classification tasks because these SWs appear to be challenging to categorise by naïve human-observers.
The occurrence of SWs observed in this study (i.e., 49.84% of the total whistles recorded) is consistent with other studies of SW emission in wild bottlenose dolphins. Indeed, in a natural environment, SWs comprise 38–70% of all whistles (Buckstaff Citation2004; Cook et al. Citation2004; Janik & Sayigh Citation2013). Previous studies have demonstrated that group size influences whistles emission: the more individuals are present during the encounters the more stereotyped whistles contours tend to be recorded (Cook et al. Citation2004; Kriesell et al. Citation2014). Whistle rates overall increase with group size but whistle rates per individual increase in group composed up to 15 individuals and decrease in larger groups where the potential for signal masking by other dolphin whistles increases (Jones & Sayigh Citation2002; Quick & Janik Citation2008). Overall, our findings confirm a positive correlation between-group size and whistles emission rate (SWs + non-SWs), group size and SWs emission rate and group size and SW type.
Moreover, in the bottlenose dolphins, whistles emission depends on the behavioural context. Calves were present in 83.9% of encounters; therefore, we can partially explain our results by the fact that separation between mother and calf led to an increase of SW emission to maintain vocal contact with each other (Smolker et al. Citation1993; Gnone & Moriconi Citation2010).
Three SW types (SW 16, SW17, SW19) recorded in the first year of data collection (2018) were recaptured and categorised as SWs in the second field season (2019). Recording the same SW types across multiple years suggests that the acoustic monitoring approach could assist the visual monitoring through photo-ID started for this population in 2001.
The PCA performed on the acoustic parameters extracted on each SW contour explained 82% of the total variance with three PCs showing eigenvalues >1. The PCA also allows us to create a graphic plot of the 19 SW types, graphically showing how these separate in the space defined by the three PCs (). The study of the canonical loadings allowed us to understand the correlation between the original variables and the PCs. Previous research showed that the stereotype of SWs is contained in whistle contour and not in the single acoustic parameters that could change over time (Sayigh et al. Citation2007). However, our results suggest that some frequency features (i.e., maximum frequency, minimum frequency and mean frequency) are more important than others to distinguish among the whistle types.
The values observed in the present study () are within the range of variation of those reported from the other two studies carried out in Florida and Namibia. Despite this, for some acoustic parameters, there are notable differences between geographical units. Indeed, for Ligurian dolphins, the mean minimum frequency of the SW types is higher than the same acoustic parameter recorded in Florida and Namibia (). Furthermore, the mean maximum frequency is higher in SWs emitted by Namibia and Florida bottlenose dolphins. The results arising from this comparison are extremely interesting. The PCA results show the maximum frequency and minimum frequency as the most correlated acoustic values of the PC1 (also mean frequency highly correlates to PC1 but this acoustic parameter is not calculated in SWs of the two other geographical units).
The acoustic variation in the frequency modulation patterns of the bottlenose dolphins has been previously linked to anthropogenic noise (Jensen et al. Citation2009). To date, two studies demonstrated that bottlenose dolphins increase the whistles frequency modulation in the presence of noise (Buckstaff Citation2004; Heiler et al. Citation2016). In particular, Heiler et al. (Citation2016) showed that the presence of boat noise led to an upward shift in whistle frequency. The presence of vessels influenced whistle parameters, with the minimum, maximum, start and end frequencies shifting significantly upwards. Our results show that the bottlenose dolphins inhabiting the eastern Ligurian Sea use higher minimum frequency whistles than those sampled in Florida and Namibia. The areas of residence of the bottlenose dolphins inhabiting the eastern Ligurian Sea are subject to a massive presence of cargos, vessels, and tourist boats, especially in coastal waters near the ports of Genoa and La Spezia (David et al. Citation2011; Venturini et al. Citation2016), and this could explain the above mentioned frequency variations in the acoustic parameters analysed. However, as suggested by Papale et al. (Citation2013), these acoustic variations could also be linked to the different habitat features that characterise the geographical area inhabited by the bottlenose dolphins. Further studies on the whistle repertoire of the same dolphins over time and in different conditions of anthropogenic noise exposure might contribute to shed light on the impact of the human-made sounds on the vocal communication of this species.
Supplemental Material
Download PDF (76 KB)Supplemental Material
Download PDF (3.7 MB)Supplemental Material
Download PDF (3.7 MB)Acknowledgements
We would like to thank Davide Perusco and Laura Pintore for helping with fieldwork and data collection. We are grateful to Lorenzo Betti, Ilaria Fraccaroli, Agata Licciardello, Luigi Terranova, Teresa Terranova, and Sara Traldi for participating as volunteer judges to the spectrographic classification of the signature whistles. The acoustic recording equipment was provided by the University of Turin through a System s.p.a. grant for bioacoustics awarded to Livio Favaro.
Disclosure statement
No potential conflict of interest was reported by the authors.
Supplementary material
Supplemental data for this article can be accessed here.
Related Research Data
References
- Au WWL, Hastings MC. 2008. Principles of marine bioacoustics. New York: Springer. pp. 404–444. DOI: 10.1007/978-0-387-78365-9.
- Boersma P, Weenink D. 2020. Praat: Doing phonetics by computer [Computer program]. Version 6.1.26. Available: http://www.praat.org/. Accessed Oct 2020 5.
- Buckstaff KC. 2004. Effects of watercraft noise on the acoustic behaviour of bottlenose dolphins, Tursiops truncatus, in Sarasota Bay, Florida. Marine Mammal Science 20(4):709–725. DOI: 10.1111/j.1748-7692.2004.tb01189.x.
- Caldwell MC, Caldwell DK. 1968. Vocalisation of naïve captive dolphins in small groups. Science 159:1121–1123. DOI: 10.1126/science.159.3819.1121.
- Caldwell MC, Caldwell DK. 1979. The whistle of the Atlantic bottlenose dolphin (Tursiops truncatus) - Ontogeny. In: Winn HE, Olla BL, editors. Behavior of marine animals: Current spectives in research. New York - London: Plenum Press. pp. 369–401. DOI: 10.1002/iroh.19800650519.
- Caldwell MC, Caldwell DK, Tyack PL, Leatherwood S, Reeves RR. 1990. The bottlenose dolphin. San Diego: Academic. DOI: 10.1016/b978-0-12-440280-5.50014-7.
- Caltavuturo G, Fossa F, Gnone G, Ferrando P. 2001. ‘Delfini Metropolitani’. I Cetacei della fascia costiera genovese. Risultati preliminari. 5° Convegno Nazionale sui Cetacei e sulle Tartarughe Marine del CSC, Comune di Monte Argentario (Italy).
- Connor RC, Wells RS, Mann J, Read AJ. 2000. The bottlenose dolphin: Social relationships in a fission-fusion society. In: Mann J, Connor RC, Tyack PL, Whitehead H, editors. Cetacean societies. Chicago: University of Chicago Press. pp. 91–126.
- Cook MLH, Sayigh LS, Blum JE, Wells RS. 2004. Signature-whistle production in undisturbed free-ranging bottlenose dolphins (Tursiops truncatus). Proceedings of the Royal Society of London B 271:1043–1049. DOI: 10.1098/rspb.2003.2610.
- David L, Alleaume S, Guinet C. 2011. Evaluation of the potential of collision between fin whales and maritime traffic in the north-western Mediterranean Sea in summer, and mitigation solutions. Journal of Marine Animals and Their Ecology 4(1):17–28.
- Ding W, Wursig B, Evans WE. 1995. Whistles of bottlenose dolphins: Comparisons among populations. Aquatic Mammals 21:65–77.
- Esch HC, Sayigh LS, Wells RS. 2009. Quantifying parameters of bottlenose dolphin signature whistles. Marine Mammal Science 25:976–986. DOI: 10.1111/j.1748-7692.2009.00289.x.
- Favaro L, Gnone G, Pessani D. 2013. Postnatal development of echolocation abilities in a bottlenose dolphin (Tursiops truncatus): Temporal organisation. Zoo Biology 32:210–215. DOI: 10.1002/zoo.21056.
- Favaro L, Neves S, Furlati S, Pessani D, Martin V, Janik VM. 2016. Evidence suggests vocal production learning in a cross-fostered Risso’s dolphin (Grampus griseus). Animal Cognition 19(4):847–853. DOI: 10.1007/S10071-016-0961-X.
- Finneran JJ. 2013. Dolphin “packet” use during long-range echolocation tasks. The Journal of the Acoustical Society of America 133(3):1796–1810. DOI: 10.1121/1.4788997.
- Fripp D, Owen C, Quintana-Rizzo E, Shapiro A, Buckstaff K, Jankowski K, Wells R, Tyack P. 2005. Bottlenose dolphin (Tursiops truncatus) calves appear to model their signature whistles on the signature whistles of community members. Animal Cognition 8(1):17–26. DOI: 10.1007/s10071-004-0225-z.
- Gnone G, Bellingeri M, Dhermain F, Dupraz F, Nuti S, Bedocchi D, Moulins A, Rosso M, Alessi J, McCrea RS, Azzellino A, Airoldi S, Portunato N, Laran S, David L, Di Meglio N, Bonelli P, Montesi G, Trucchi R, Fossa F, Wurtz M. 2011. Distribution, abundance, and movements of the bottlenose dolphin (Tursiops truncatus) in the Pelagos Sanctuary MPA (north‐west Mediterranean Sea). Aquatic Conservation: Marine and Freshwater Ecosystems 21(4):372–388. DOI: 10.1002/aqc.1191.
- Gnone G, Moriconi T. 2010. Use and function of distinctive whistle‐like signals in bottlenose dolphin (Tursiops truncatus) mother‐calf pair. In: Perace AG, Corea LM, editors. Dolphins: Anatomy, behavior and threats. Animal science, issues and professions. New York: Nova SciencePublishers. pp. 149–167.
- Gridley T, Berggren P, Cockcroft VG, Janik VM. 2012. Whistle vocalisations of Indo-Pacific bottlenose dolphins (Tursiops aduncus) inhabiting the south-west Indian Ocean. Journal of the Acoustical Society of America 132:4032–4040. DOI: 10.1121/1.4763990.
- Heiler J, Elwen SH, Kriesell HJ, Gridley T. 2016. Changes in bottlenose dolphin whistle parameters related to vessel presence, surface behaviour and group composition. Animal Behaviour 117:167–177. DOI: 10.1121/2.0000312.
- Janik VM. 1999. Pitfalls in the categorization of behaviour: A comparison of dolphin whistle classification methods. Animal Behaviour 57:133–143. DOI: 10.1006/anbe.1998.0923.
- Janik VM, King SL, Sayigh LS, Wells RS. 2013. Identifying signature whistles from recordings of groups of unrestrained bottlenose dolphins (Tursiops truncatus). Marine Mammal Science 29:109–122. DOI: 10.1111/j.1748-7692.2011.00549.x.
- Janik VM, Sayigh LS. 2013. Communication in bottlenose dolphins: 50 years of signature whistle research. Journal of Comparative Physiology A 199(6):479–489. DOI: 10.1007/s00359-013-0817-7.
- Janik VM, Slater PJB. 1997. Vocal learning in mammals. Advances in the Study of Behavior 26:59–99. DOI: 10.1016/s0065-3454(08)60377-0.
- Janik VM, Slater PJB. 1998. Context-specific use suggests that bottlenose dolphin signature whistles are cohesion calls. Animal Behaviour 56:829–838. DOI: 10.1006/anbe.1998.0881.
- Janik VM, Todt D, Dehnhardt G. 1994. Signature whistle variations in a bottlenose dolphin, Tursiops truncatus. Behavioral Ecology and Sociobiology 35:243–248. DOI: 10.1007/s002650050094.
- Jensen FH, Bejder L, Wahlberg M, Aguilar Soto N, Johnson M, Madsen PT. 2009. Vessel noise effects on delphinid communication. Marine Ecology Progress Series 395:161–175. DOI: 10.3354/meps08204.
- Jones GJ, Sayigh LS. 2002. Geographic variation in rates of vocal production of free-ranging bottlenose dolphins. Marine Mammal Science 18(2):374–393. DOI: 10.1111/j.1748-7692.2002.tb01044.x.
- Kriesell HJ, Elwen SH, Nastasi A, Gridley T. 2014. Identification and characteristics of signature whistles in Wild Bottlenose Dolphins (Tursiops truncatus) from Namibia. PLoS ONE 9(9):e106317. DOI: 10.1371/journal.pone.0106317.
- Manfredini E, Frau F, Fossa F, Bellingeri M, Gnone G, Saporiti F. 2007. Presence and abundance of bottlenose dolphin along the east Ligurian coast in relation to the pleasure boating. 21st Annual Conference of the European Cetacen Society, 22–25 April 2007, San Sebastián, Spain.
- May-Collado LJ, Wartzok D. 2008. A comparison of bottlenose dolphin whistles in the Atlantic Ocean: Factors promoting whistle variation. Journal of Mammalogy 89(5):1229–1240. DOI: 10.1644/07-mamm-a-310.1.
- Mello I, Amundin M. 2005. Whistle production pre- and post-partum in bottlenose dolphins (Tursiops truncatus) in human care. Aquatic Mammals 31(2):169e175. DOI: 10.1578/am.31.2.2005.169.
- Nummela S, Thewissen JGM, Bajpai S, Hussain T, Kumar K. 2007. Sound transmission in archaic and modern whales: Anatomical adaptations for underwater hearing. The Anatomical Record: Advances in Integrative Anatomy and Evolutionary Biology 290(6):716–733. DOI: 10.1002/ar.20528.
- Papale E, Azzolin M, Cascão I, Gannier A, Lammers MO, Martin VM, Oswald J, Perez-Gil M, Prieto R, Silva MA, Giacoma C. 2013. Acoustic divergence between bottlenose dolphin whistles from the Central–Eastern North Atlantic and Mediterranean Sea. Acta Ethologica 17(3):155–165. DOI: 10.1007/s10211-013-0172-2.
- Quick NJ, Janik VM. 2008. Whistle rates of wild bottlenose dolphins (Tursiops truncatus): Influences of group size and behavior. Journal of Comparative Psychology 122(3):305–311. DOI: 10.1037/0735-7036.122.3.305.
- Sayigh LS, Esch HC, Wells RS, Janik VM. 2007. Facts about signature whistles of bottlenose dolphins, Tursiops truncatus. Animal Behaviour 74(6):1631–1642. DOI: 10.1016/j.anbehav.2007.02.018.
- Sayigh LS, Janik VM. 2010. Dolphin signature whistles. In: Breed MD, Moore J, editors. Encyclopedia of animal behavior. Elsevier. pp. 553–561. DOI: 10.1016/b978-0-08-045337-8.00016-4.
- Sayigh LS, Tyack PL, Wells RS, Scott MD. 1990. Signature whistles of free-ranging bottlenose dolphins, Tursiops truncatus: Mother- offspring comparisons. Behavioral Ecology and Sociobiology 26:247–260. DOI: 10.1007/bf00178318.
- Sayigh LS, Wells RS, Janik VM. 2017. What’s in a voice? Dolphins do not use voice cues for individual recognition. Animal Cognition 20(6):1067–1079. DOI: 10.1007/s10071-017-1123-5.
- Scott MD, Wells RS, Irvine AB. 1990. A long-term study of bottlenose dolphins on the west coast of Florida. In: Leatherwood S, Reeves RR, editors. The bottlenose dolphin. San Diego: Academic Press. pp. 235–244. DOI: 10.1016/b978-0-12-440280-5.50015-9.
- Simard P, Lace N, Gowans S, Quintana-Rizzo E, Kuczaj SA, Wells RS, Mann DA. 2011. Low frequency narrowbandnarrow-band calls in bottlenose dolphins (Tursiops truncatus): Signal properties, function, and conservation implications. The Journal of the Acoustical Society of America 130(5):3068–3076. DOI: 10.1121/1.3641442.
- Smolker R, Pepper JW. 1999. Whistle convergence among allied male bottlenose dolphins (Delphinidae, Tursiops sp.). Ethology 105:595–617. DOI: 10.1046/j.1439-0310.1999.00441.x.
- Smolker RA, Mann J, Smuts BB. 1993. Use of signature whistles during separations and reunions by wild bottlenose dolphin mothers and infants. Behavioral Ecology and Sociobiology 33:393–402. DOI: 10.1007/bf00170254.
- Tyack P. 1986. Whistle repertoires of two bottlenosed dolphins, Tursiops truncatus: Mimicry of signature whistles? Behavioral Ecology and Sociobiology 18:251–257. DOI: 10.1007/bf00300001.
- Venturini S, Massa F, Castellano M, Costa S, Lavarello I, Olivari E, Povero P. 2016. Recreational boating in Ligurian marine protected areas (Italy): A quantitative evaluation for a sustainable management. Environmental Management 57(1):163–175. DOI: 10.1007/s00267-015-0593-y.