
Abstract
When an alien species is introduced in a new area, the new population may be genetically and phenotypically different from the parent population because of the population bottleneck, increased inbreeding rate and adaptation to the new environment. In this study we investigated the variation in shape and size of the mandible among and within three populations of the invasive Pallas’s squirrel introduced in Italy, Belgium and France. Significant differences in both size and shape of the mandible were found among all population pairs, with France being the most distinct. French squirrels showed a larger and slenderer mandible with a broad angular process, a restricted condyle, and a backward-oriented coronoid process. The Italian and the Belgian population also differed significantly but to a lesser extent, the Italian squirrels having a lower coronoid process, a broader angular apophysis, and a restricted condyle. Size explained 15% of the total shape variation, but the slope of allometric trajectories did not reveal any significant difference among populations. A significantly high fluctuating and directional asymmetries were found respectively in the French and the Italian squirrels. Results are discussed in terms of different selective pressures in the invaded areas and possible effects of developmental instability.
Introduction
The introduction and subsequent range expansion of invasive alien species (IAS) is the second most important cause of biodiversity loss worldwide (Cadotte Citation2006; Genovesi et al. Citation2012). The first stage in the development of a species invasion is the introduction, colonization, and establishment in a new area. In this process the small number of founding individuals are subjected to a high inbreeding rate that may result in a new population that will likely differ, both genetically and phenotypically, from the parent population from which it is derived (Simberloff et al. Citation2000; Melero et al. Citation2007; Firmat et al. Citation2012). Moreover, the introduction may also result in an adaptation of the alien species to the new environment and subsequent morphological changes related to adaptive shift and initial environmental stress (Sidorovich et al. Citation1999; Phillips et al. Citation2006; Parker et al. Citation2013). Despite phenotypic shift is a complementary and relevant aspect of invasions, phenotypic changes associated to invaded ranges by IAS have been poorly investigated in mammals, and the few studies were focused on differences in size and body mass between populations in the non-native and natural ranges (Melero et al. Citation2007; Zalewski & Bartoszewicz Citation2012; but see Phillips et al. Citation2006; Parker et al. Citation2013).
In this study, we explored the mandible size and shape in three introduced populations of Pallas’s squirrel Callosciurus erythraeus Pallas 1779 in Europe (Belgium, France and Italy), by means of geometric morphometrics. Pallas’s squirrel is an invasive species native to South-East Asia that was introduced and established in seven countries around the world (Argentina, France, Belgium, Italy, the Netherlands, Japan and China, Hong Kong) (Bertolino & Lurz Citation2013). Besides quantifying shape changes among groups, Geometric Morphometrics Methods (GMM) offer the possibility to investigate on the ontogeny of traits, on trait covariation (modularity), deviations from asymmetry, and on the relationships between traits and ecogeographic factors (Cardini et al. Citation2009; Magrini & Scoppola Citation2010; Viscosi & Cardini Citation2011; Adams et al. Citation2013; Klingenberg & Marugán-Lobón Citation2013). In fact, the mammalian mandible is a highly informative structure as it is developmentally a complex structure but a functionally integrative whole bone (Klingenberg et al. Citation2003; Meloro et al. Citation2011; Prevosti et al. Citation2012). The growth and morphogenesis of mandible components have different embryonic origins during ontogeny, and respond to different controlling factors, such as genetic and environmental pressure (Atchley et al. Citation1992; Trotta et al. Citation2005; Zelditch et al. Citation2008). Thus, modularity and traits covariation of adult mandibular shape can shed the light on genetic, developmental, functional and evolutionary processes acting within and among species (Michaux et al. Citation2007; Vinyard et al. Citation2011; Casanovas-Vilar & van Dam Citation2013).
Even though no document ascertains the origin of the Pallas’s squirrel in Italy and Belgium, where the first sightings were recorded in 2007 and early 2000s, respectively (Mazzamuto et al. Citation2016), we know that a very small number of squirrels were imported directly in France from Asia by a single person in the 1960s (Chapuis & Pisanu, pers. comm.). In a previous genetic and morphological investigation the French specimens were identified as belonging to the Taiwan population of C. erythraeus, whereas the origin of the Belgian and Italian populations remained unknown (Mazzamuto et al. Citation2016). As invasions were likely stated from few founders, we could expect that the three populations express some effects of inbreeding and drift. Small and isolated populations with high level of inbreeding are supposed to produce genotypes unable to buffer against external/internal forces, due to the breakup of regulating gene networks leading to developmental instability (Rott Citation2003). In a bilateral symmetric individual, developmental stability can produce fluctuating asymmetry (FA) (Gilligan et al. Citation2000; Klingenberg Citation2003, Citation2005; Badyaev Citation2005; DeLeon Citation2007). The degree of FA in a trait depends on how developmental stability processes are able to reduce this noise, ensuring an optimal level of correlation between two replicas (left and right side) of the same development process. Indeed, FA can be viewed as a specific case of morphological integration, specifically a developmental integration, i.e. the co-variation of traits during development (Klingenberg Citation2003; Klingenberg & Marugán-Lobón Citation2013). Morphological integration is found when different traits have the tendency to vary jointly in the organism (Klingenberg Citation2008). The covariation of integrated traits is the result of genetic and epigenetic interactions and anatomical structures. Again, the departure from a normal level of trait covariance can be expected in population that underwent severe bottleneck and experienced high level of inbreeding (Bryant & Meffert Citation1988; Whitlock et al. Citation2002; Phillips et al. Citation2006; Jarvis et al. Citation2011). Thus, morphological integration is of relevant interest when the focus of the research is on the alteration of the developmental and genetic architecture of a population, as in the case of isolated and inbreed populations (Klingenberg & Marugán-Lobón Citation2013).
The aims of this study were specifically to use GMM to (1) assess any difference in the mandibular morphology among introduced populations, considering variation in size, shape and static allometry; (2) identify any adaptive trait that could be related to the new invaded niche, including directional asymmetry; (3) assess any evidence from fluctuating asymmetry that stress factors could be acting differently on the three isolated populations, thus informing on their probability of survival in the introduced ranges.
Material and methods
Specimen collection
In Italy and Belgium, the introduced squirrels were captured using Tomahawk live-traps (model 202, Tomahawk Live Trap, Wisconsin, USA) baited with apples and hazelnuts. Traps were set in the morning and checked at least twice a day to minimize stress during trapping (Mazzamuto et al. Citation2016). While lactating females were immediately released, all males and non-reproductive females were euthanized by CO2 inhalation following EC and AVMA guidelines (Close et al. Citation1996, Citation1997; Leary et al. Citation2013). In France, all live-trapped individuals were immediately euthanized by cranial shock according to the current French ethics statements (Ethics Committee Cuvier: MNHN, Sorbonne Universities, agreement No. 68–012) and following the European Union recommendations (Annex IV Directive 63 EU). In particular, qualified official agents applied the French National Plan of Control against the Pallas’s squirrel under the authorization given by the Prefectoral Orders n° 2012–356 and n° 2015–205. In Italy, live-trapping and removal were carried out under the Regional Decree n° 11,190 of November, 292,013, issued following the Note n° 45,181 of November, 112,013, as provided by the Italian Law n° 157/1992 and the Regional Law (Lombardy Region) n° 26/1993, following the above cited EU recommendations as well. In Belgium, animals were caught with permission of the site owner and the municipality under the general exemption of the Flemish Species Decree for trapping and manipulating animals (Decision of the Flemish Government of May 15, 2009 on species protection and species management) issued by the Agency for Nature and Forest (ANB) for the Research Institute for Nature and Forest (INBO).
Data acquisition and transformation
We collected the left and right mandibles from 109 adult specimens (with complete dentition) from three populations in France, Belgium and Italy ().
Table I. Details of specimens analysed
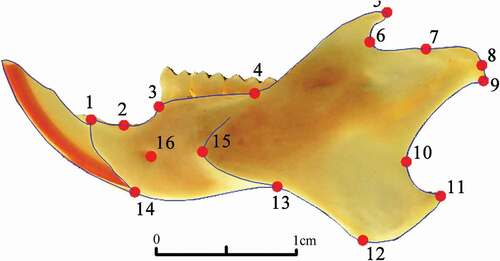
To reduce measurement errors, each mandible (both left and right) was placed on a custom-built frame, holding an horizontal glass plane with fixed scale in millimetres and photographed by mean of a Canon EOS 7D camera with prime (fixed focal) lens mounted below the glass plane and connected to a personal computer. The camera was mounted so that the camera CMOS sensor was parallel to the glass plane above. Each hemi-mandible was photographed twice (at 2592 × 1728 pixels resolution) in two sessions by the same operator. The two pictures were directly stored on the personal computer using the standard camera software to remotely operate the camera (EOS Utility Software, issued by Canon company) so that the camera was never touched or moved during the whole process. On each left and right mandible, we recorded a set of 16 anatomical landmarks (LM) on the labial side (), using tpsDig2 software (Rohlf Citation2015), as follows: (1) Antero-dorsal border of the incisor alveolus; (2) Extreme of the diastema invagination; (3) Anterior edge of the molar tooth-row; (4) Maximum of curvature between molar alveolar and horizontal ramus; (5) Tip of the coronoid process; (6) Maximum of curvature between the coronoid and condylar processes; (7) Anterior edge of the articular surface of the condyle; (8) Posterior-most edge of the articular surface of the condyle; (9) Tip of mandibular condyle; (10) Most anterior point on the curvature between condyle and angular process; (11) Posterior tip of angular process; (12) Most ventral point on ventral border of angular process; (13) Most dorsal point on ventral border of the ramus; (14) Antero-ventral border of incisive alveolus; (15) Anterior limit of masseteric ridge; (16) Mental foramen.
Figure 1. Location of the 16 landmarks digitized on a labial view of C. erythraeus mandible. (1) Antero-dorsal border of the incisor alveolus; (2) Extreme of the diastema invagination; (3) Anterior edge of the molar tooth-row; (4) Maximum of curvature between molar alveolar and horizontal ramus; (5) Tip of the coronoid process; (6) Maximum of curvature between the coronoid and condylar processes; (7) Anterior edge of the articular surface of the condyle; (8) Posterior-most edge of the articular surface of the condyle; (9) Tip of mandibular condyle; (10) Most anterior point on the curvature between condyle and angular process; (11) Posterior tip of angular process; (12) Most ventral point on ventral border of angular process; (13) Most dorsal point on ventral border of the ramus; (14) Antero-ventral border of incisive alveolus; (15) Anterior limit of masseteric ridge; (16) Mental foramen
All landmarks were recorded twice to account for the measurement error. Original landmark configurations were superimposed by Generalized Procrustes Analysis (GPA) to remove the influences of scaling, orientation and position (Rohlf & Slice Citation1990). Centroid Size (CS) and Procrustes coordinates were then used for subsequent univariate and multivariate analyses of size and shape variation, trait covariation, and asymmetry (Rohlf & Slice Citation1990).
Size and shape variation in the introduced populations
Size variation. ANOVA was used to test the null-hypothesis (H0) that populations do not differ in size, expressed by log centroid size using the R software (R Development Core Team Citation2018).
Shape variation. To evaluate measurement errors, we run a Procrustes ANOVA considering the effects of images and digitizing replicates (Palmer & Strobeck Citation1986). A Procrustes ANOVA was run to test the effects of population, sex and their interactions to allow further pooling of males and females for the analyses of geographic variation. Differences in the symmetric component of the shape were investigated among and within populations in both Kendall’ space (ANOVA on Procrustes distances) and in the Euclidean tangent space (multivariate analyses on the weight matrix of the aligned coordinates). Most analyses were run using the R-package geomorph (Adams et al., 2021). Specifically, we used the function gm.prcomp() to run a Principal Components Analysis on the aligned shape coordinates. Considering the balanced sample sizes and the serious critics raised by Bookstein (Citation2017) on the use of between-group PCA, phenotypic relationships among populations were further analysed through a Canonical Variate Analysis using the function CVA() implemented in the R-package morpho (Schlager Citation2017). The package geomorph was also used to measure the morphological disparity among groups through the function morphol.disparity().
Static allometry of introduced populations was investigated by multivariate regression of shape against size to evaluate any divergent trajectory among populations. Differences among allometric trends in the three populations were tested through the function procD.allometry implemented in the R package geomorph (Adams et al. Citation2017), using the aligned shape coordinates and natural log transformed centroid size (lnCS) as the covariate predictor. This was done by performing an ANOVA for homogeneity of slopes. Shape changes related to size variation were visualized through warped outline drawings. We used the function morphol.disparity() of R-package geomorph.
Asymmetry
Directional (DA) and Fluctuating Asymmetry (FA) in both size and shape were evaluated in each population to detect any indication of adaptive trait (DA) or developmental instability (FA) (Palmer & Strobeck Citation1986; Klingenberg Citation2003, Citation2015). DA and FA were computed for each population separately by Procrustes ANOVA run on the left and right mandible of each individual and using the coordinates of the two digitizing replicas, by considering the effect of individual, side (as right and left mandible of each individual, expressing DA), individual × side (expressing FA) and the measurement error expressed by the replicas (Savriama & Klingenberg Citation2006). Analyses were implemented using the function bilat.symmetry() in geomorph. Coordinates of the FA component of each populations were pooled then entered the function procD.lm() gm.prcomp() in geomorph to evaluate difference of FA among groups. Differences in DA were evaluated by comparing the angles between DA vectors of population pairs and angles between pairs of three random vectors, using the angle() function implemented in R package matlib (Friendly Citation2020).
The main traits responsible for directional asymmetry in each group were shown by lollipop graphs produced in MorphoJ (Klingenberg Citation2011), and graphically overlapped to highlight differences in asymmetric traits among populations.
Results
Sexual dimorphism
Mandibles did not significantly differ between males and females in size (F = 0.37, df = 1, 108, p = 0.54) nor in shape (F = 0.31, df = 1, 108, p = 0.14). The analyses provided no evidence of sexual dimorphism in the interaction between population and sex (F = 0.77, df = 2, p = 0.46), similarly to the evidence found by Cardini (Cardini Citation2003; Cardini & O’higgins Citation2004) for the mandible shape of another Sciurid, the Alpine marmot. Therefore, geographic variation was further explored on pooled samples of both sexes.
Shape and size differences within and among populations
Size
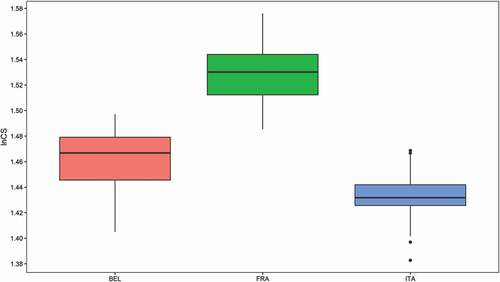
Levene’s test for homogeneity of variance was not significant (p = 0.24), meaning that size variation was comparable among populations. ANOVA on lnCS with permutations evidenced a significant difference in the size of the mandible among populations (mean ± SD: Belgian 1.460 ± 0.022; French 1.529 ± 0.020; Italian 1.433 ± 0.019; F = 189.1, df = 2, p < 0.001). The French squirrels were the largest in size, followed by the Belgian and the Italian (). Post-hoc pairwise comparisons based on the Tukey–Kramer test confirmed significant differences between each population pair (all p < 0.0001, Supplementary material S1).
Figure 2. Box plots of lnCS for the three populations (BEL = Belgium, FRA = France; ITA = Italy)
Shape
The first two PCs extracted from the symmetric component of shape variables accounted for 46.6% of the total variance. Populations were clearly distinct along the first axis (34.2% of variance, )), with the French population at the negative extreme, the Belgian at the opposite extreme, and the Italian at intermediate values.
Figure 3. Scatter plot of the first two principal component scores (a) and canonical variate scores (b) for the three populations of Pallas’s squirrel obtained from shape variables. Shape changes related to extremes of variation along PC1, PC2, CV1 and CV2 are displayed along the axes
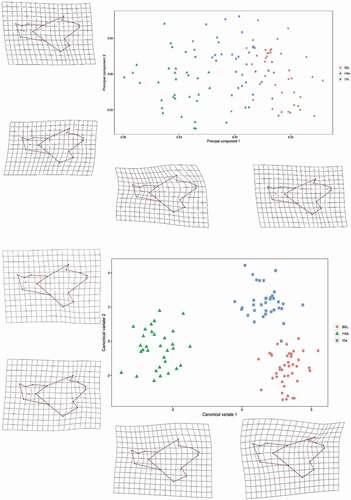
Both Procrustes ANOVA performed on Procrustes distances and Mahalanobis distances from shape coordinates showed significant differences between all population pairs (p always < 0.0001, Supplementary material S2) and confirmed France as the most distinct population.
The high discrimination among populations was also supported by the high percentage of correctly classified cases after cross validation. The functions provided the highest degree of correct classification for the French vs the Belgian population (100%), followed by the Italian population vs the Belgian (94.3%) and the French population vs the Italian (88.2%). Scatter plot of the first two CV scores highlighted the divergence of the French population from the Italian and the Belgian samples along the first canonical axis (85.2% variance of CV scores) (). Deformation grids produced from the extremes of the axes in both PCA and DFA indicate that morphological differences between the Italian – Belgian specimens and the French ones are concentrated in the ramus and in the orientation of the coronoid process (). The Italian and Belgian specimens are discriminated along the second CV axis (14.8% of variance of CV scores), that represents the variation from a mandible with a low coronoid process, a broader angular apophysis and a restricted condyle (the Italian sample) to a high mandible with a long, dorsally directed coronoid process, a restricted angular process and a projecting condyle (the Belgian population). Morphological disparity shown by Procrustes variance revealed significant differences among populations, with highest variance shown by the French population, and highest difference between the French and the Italian squirrels (Supplementary material S3).
Static allometry
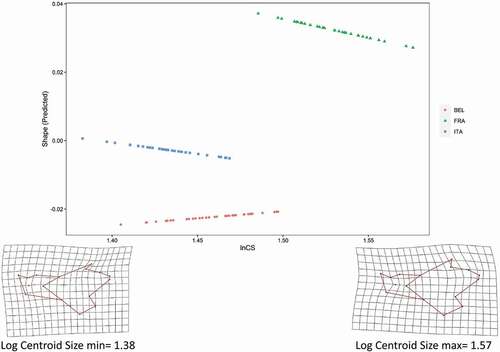
A significant association was detected between size (lnCS) and shape in the whole sample, with size explaining 15% of the total shape variation (df = 1; SS = 0.029; MS = 0.029; R2 = 0.145; F = 18.834; z = 12.942; p < 0.001). The null hypothesis of parallel slopes among populations was supported based on a significance criterion of alpha = 0.05 (group allometries: df = 107; SSE = 0.128; SS = 0.002; R2 = 0.011; F = 0.936; z = 0.910; p = 0.47), suggesting that static allometry did not differ significantly among populations. shows allometric trajectories as the first principal component of predicted shape values (regression scores) on lnCS (Adams & Nistri Citation2010; Adams et al. Citation2013), and shape traits associated to size variation.
Figure 4. Allometric trajectories for the three population of Pallas’s squirrels, shown as the first principal component of predicted shape values vs log-transformed centroid size (lnCS). Shape changes related to variation of size are shown as deformation grids for the minimum and maximum lnCS
Asymmetry
Directional asymmetry was significant for the shape of the right and left mandibles in all populations, whereas it was not significant for the size. Instead, FA was significant for both the shape and the size of right and left mandibles in the three populations. Measurement error was negligible and always at least one degree of magnitude less than both DA and FA ().
Table II. Results from ANOVA run on size and shape of the right and left mandible separately in the three populations, expressing directional asymmetry (DA, expressed by side) and fluctuating asymmetry (FA, expressed by ind*side)
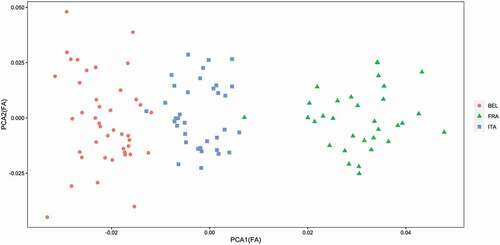
Values of DA in shape were comparable in the three populations (). Angles between DA vectors were very small, ranging from 1.70 to 3.09, and much lower compared to couples of random vectors (85.03 to 106.98). FA in mandible size showed highest value for the French population, whereas FA in shape was highest for the Belgian one. A PCA run on the FA component of shape variation still showed a clear distinction among the populations (), and Procrustes ANOVA confirmed a significant difference in population FA among populations (F = 20.78, df = 2, p = 0.001).
Figure 5. Scores for the first two PCs for the fluctuating asymmetry component of shape
It is interesting to note as traits involved in DA were more similar in Italian and Belgian populations compared to France (). The main regions involved in DA are the corpus excluding the tooth row (especially LM 13), and the coronoid process (LM 5). Moreover, compared to the French, the Italian and Belgian populations showed more similar asymmetric traits ().
Discussion
In this study, we investigated the variation in shape and size of the mandible of three populations of Pallas’s squirrel introduced in Italy, Belgium and France. Our results confirmed the high diagnostic value of the mandible form in detecting even a small amount of divergence among closely related lineages (Michaux et al. Citation2007; Casanovas-Vilar & van Dam Citation2013).
Geographic variation
The three introduced populations differed significantly in both the size and the shape of the mandible. The French sample was the most divergent in both aspects of morphology, showing the largest and the most divergent mandible. These outcomes are in agreement with a mtDNA exploration suggesting the French population belongs to a different lineage with respect to the Belgian and Italian ones (Mazzamuto et al. Citation2016). Our results are also in agreement with a common origin of the Italian and Belgian squirrels hypothesized by Mazzamuto et al. (Citation2016), who suggested a first introduction in Belgium followed by a translocation of some individuals to Italy. However, we also detected significant differences between the mandibles of Belgian and Italian populations. If the two populations were founded by the same individuals from Belgium, their significant differences in shape could suggest a high phenotypic plasticity and rapid divergence rates, likely related to different selective pressures in the two invaded areas (Sakai et al. Citation2001; Klenovšek & Kryštufek Citation2013; but see Korablev et al. Citation2011). The Italian squirrels show a slender ramus, a less projecting condyle, a larger angular process, and a ventrally oriented coronoid process compared to the Belgian squirrels. These features are likely related to muscular changes that are the main drivers of bite performance, as recently evidenced in Myomorphous rodents by Ginot et al. (Citation2018).
The mandibular processes are more subject to phenotypic variability due to extrinsic biomechanical stress (Atchley et al. Citation1985; Anderson et al. Citation2014), and could likely reflect a shift in feeding adaptation and/or aggressive behaviour (Rohlf & Corti Citation2000). In a wider taxonomical context, inclusive of 44 species and genera, Casanovas-Vilar and van Dam (Citation2013) found that the mandible shape of squirrels reflects both the phylogeny of a clade and different dietary specializations. In their framework, the Callosciurinae retained the highest degree of morphological diversity, reflecting their ability to adapt to new habitats by rapidly evolving new morphologies (Casanovas-Vilar & van Dam Citation2013). Compared to the mandibular shape of the Belgian population, the Italian squirrels have a smaller and lower mandible with reduced coronoid and condylar processes, and a broader angular one. As underlined by Casanovas-Vilar and van Dam (Citation2013), these features correspond to a reduced mechanical advantage of both the masseter and the temporalis muscles. Assuming an origin from a common lineage of the Belgian and the Italian populations, these features could imply a shift in the dietary specialization or toward a less aggressive behaviour in the squirrels introduced to Italy compared to the Belgian ones. Different selective pressures acting on the Italian population could also explain the highest directional asymmetry found in this population. In fact, DA is usually related to specific mechanic selective forces acting on the bones rather than the result of developmental instability like FA (Leamy et al. Citation1999; Lens & Dongen Citation2000). Thus, the highest degree of directional asymmetry found in the Italian squirrel mandible could reinforce the hypothesis of a rapid response to directional selective pressures acting on this population. No information is available on feeding adaptations of the three populations in the invaded areas, and a study of their diet would likely help in explaining the causes of these differences as it is likely that vegetation or fruit availability might differ, especially between Belgium and Italy. Unfortunately, since those populations have been eradicated (or are close to being) following the European Regulation n. 1143/2014, a future study is unlikely. Moreover, the significant differences in size found among the three introduced populations of Pallas’s squirrels suggest that size variation is a common feature in this species, as shown by Heaney (Citation1984) in Callosciurus prevostii. If the hypothesis of Italian and Belgian populations sharing a common ancestor is correct, our results could also demonstrate that Bergmannian size and shape changes might occur quite rapidly in this species, as the northern Belgian population is significantly larger and with more robust configuration than the Italian one (Bergmann Citation1848).
An alternative hypothesis may be that the Italian and Belgian populations share the same native lineage but originated from independent introduction events. Even if the D-loop marker shows high mutation rates, which is essential to better identify similarities and differences among populations, the lack of a difference in the DNA sequence may be related to the specific portion of the genome investigated, referring just to the mitochondrion. Extending the investigation to nuclear markers could likely contribute to solve this issue as recently evidenced for the highly divergent phenotype of the marsican bear Ursus arctos marsicanus Altobello, 1921 (Loy et al. Citation2008; Colangelo et al. Citation2012; Meloro et al. Citation2017; Benazzo et al. Citation2017). Static allometry accounted for the 15% of the total shape variation, while the orientation of allometric trajectories did not reveal any significant difference among populations. This result is in accordance with the small amount of shape variation explained by allometric patterns in tree squirrels and in New World squirrels (Velhagen & Roth Citation1999; Swiderski & Zelditch Citation2010), and of a low power of this factor to direct evolutionary changes (Swiderski Citation2003). Larger squirrels have elongated coronoid process, broader articular surface, more robust angular process, and a forward displacement of the anterior limit of the masseteric ridge in the ascending ramus, the site of muscle attachment. In the horizontal ramus, the dorsal part of alveolar region is inclined to shrink upward slightly, which makes the tip of the incisor a proximal shift. Inferably, this common pattern of shape variation leads to a reasonable shape paradigm for stronger biting force when body size increases, according to the Bergmann’s rule (Bergmann Citation1848), and similarly to what is also found in carnivores (Meloro et al. Citation2008; Ginot et al. Citation2018). So far, the lack of information available on taxonomic origin and introduction history of alien Callosciurus squirrels occurring in Europe (Bertolino & Lurz Citation2013) does not allow to clearly disentangle factors affecting their current pattern of morphological variation, and the current lack of specimens from the native distribution area did not allow so far any comparisons with morphometric data, feeding adaptations and behavioural traits from the original distribution area.
Asymmetry
Our results showed a significant degree of both DA in shape and FA in both size and shape of the left and right mandible for each of the three introduced populations. While DA is related to specific selective pressure and largely attributable to differential mechanical loading during bone growth (Özener Citation2010), FA may be influenced by environmental and genetic stress encountered during development (Kharlamova et al. Citation2010).
Directional asymmetry has been reported for differences in the metrics of skeletal structures in fish (e.g., Shapiro et al. Citation2004, Citation2006; Bell & Sih Citation2007), reptiles and amphibians (e.g., Robins & Rogers Citation2002; Seligmann Citation2006), birds (e.g., Lens & Dongen Citation2000) and mammals, including humans (e.g., Falk et al. Citation1988; Galatius & Jespersen Citation2005; Auerbach & Ruff Citation2006; Kujanová et al. Citation2008; Özener Citation2010). Among rodents, DA was demonstrated to be partially heritable since it was associated to three Quantitative Trait Loci in the mandible of the mouse (Leamy et al. Citation2000).
Although some caution should be put in the functional interpretation of traits involved in DA as landmarks 13 is of type 3, and might be subject to recording error (Bookstein Citation1991), it is interesting to note that traits involved in DA are more similar in Italian and Belgian populations compared to France. The main regions involved in DA are the corpus excluding the tooth row (LMs 2, 13 and 14), and the coronoid process (LM 5). However, caution should be put in the functional interpretation of these traits as landmarks 2 and 13 might be subject to high recording error (type 3 landmarks according to Bookstein Citation1991).
Fluctuating asymmetry explained 11.54% of shape variation when considering the whole sample. This value is comparable to those reported by other studies on rodents, in which it explained approximately 10% of the total variation. For instance, Jojić et al. (Citation2012) reported 10.1% in a study on yellow-necked mice (Apodemus flavicollis Melchior, 1834), while Zelditch et al. (Citation2009) reported 7.9% in a New World tree squirrel, the fox squirrel (Sciurus niger Linnaeus, 1758). FA was still significant when analysed separately within each population. This evidence might indicate that the introduced populations are subject to stress conditions likely leading to developmental instability. Stress could either be derived from inbreeding depression related to a small founder size or to environmental factors (Clarke et al. Citation1986; Leary & Allendorf Citation1989; Wauters et al. Citation1996). Bertolino (Citation2009) reported that the likelihood ratio for a couple (male and female) of Callosciurus sp. to successfully establish a viable population in a new environment is 0.73, and it reaches 0.90 if four animals are released. Our results seem to confirm that inbreeding depression is acting on the three population, claiming for further investigations on the amount of genetic variation retained by each introduced population.
Conclusions
Knowledge on invasive species is important because it can help in the identification of the major introduction pathways, thus reducing the risk of new releases, and can help in identifying factors responsible for their ability to establish, spread and become invasive, or to highlight evidence of stress that might limit this ability. The three populations of the invasive Pallas’s squirrel studied here have been previously investigated through phylogegraphic analyses that showed that Italy and Belgium shared the same haplotype and were different from the French population. These phylogenetic relationships have been confirmed by the shape and size of the mandible. However, morphometric analyses of the mandible also detected relevant differences in both size and shape between the closely related Belgian and Italian samples. According to the hypothesis of a common origin of the two populations, this finding may suggest a high phenotypic plasticity in Callosciurus erythraeus, and rapid phenotypic divergence rates likely related to different selective pressures in the invaded areas. The higher DA in the Italian squirrels would also confirm this hypothesis. This would also underline the ability of a fast adaptation of C. erythraeus to a different environment, key feature for the classification of a species as invasive (Palmer et al. Citation2007). Another explanation, despite the genetic results, could instead suggest an independent origin of the two populations and the impossibility of seeing these differences at the level of mitochondrial sequences. Evidences of FA also highlighted a possible role of either environmental stress or genetic drift in the probability of survival in the invaded area. Because of the limited available information about the studied populations, our research was hampered by the lack of comparison with the source populations of the species.
Future comparisons with samples from the original distribution area could help shed light on the origin and adaptive shift of these populations.
Supplemental Material
Download MS Word (17.1 KB)Acknowledgements
The authors would like to thank Benoît Pisanu, Jean-Louis Chapuis and Jan Stuyck for the samples collected in France and Belgium. We also thank the students involved in fieldwork in Italy. This work is paper number 14 of LIFE09NAT/IT/000095 EC-SQUARE project. We also thank the anonymous referees for their relevant and constructive comments that helped to raise the quality and clarity of this manuscript. Last, but not least, we are sincerely grateful to Dean C. Adams for his valuable and generous advices for computation and evaluation of directional and fluctuating asymmetry among populations.
Disclosure statement
No potential conflict of interest was reported by the author(s).
Supplementary material
Supplemental data for this article can be accessed here.
Additional information
Funding
Related Research Data
References
- Adams DC, Collyer M, Kaliontzopoulou A, Sherratt E. 2017. Geomorph: Geometric Morphometric Analyses of 2D/3D Landmark Data. R package version 3.0.5.
- Adams DC, Nistri A. 2010. Ontogenetic convergence and evolution of foot morphology in European cave salamanders (Family: Plethodontidae). BMC Evolutionary Biology 10(1):216. DOI:10.1186/1471-2148-10-216.
- Adams DC, Rohlf FJ, Slice DE. 2013. A field comes of age: Geometric morphometrics in the 21st century. Hystrix, the Italian Journal of Mammalogy 24:7–14.
- Anderson PS, Renaud S, Rayfield EJ. 2014. Adaptive plasticity in the mouse mandible. BMC Evolutionary Biology 14(1):85. DOI:10.1186/1471-2148-14-85.
- Atchley WR, Cowley DE, Vogl C, McLellan T. 1992. Evolutionary divergence, shape change, and genetic correlation structure in the Rodent Mandible. Systematic Biology 41(2):196–221. DOI:10.1093/sysbio/41.2.196.
- Atchley WR, Plummer AA, Riska B. 1985. Genetics of Mandible form in the mouse. Genetics 111(3):555–577. DOI:10.1093/genetics/111.3.555.
- Auerbach BM, Ruff CB. 2006. Limb bone bilateral asymmetry: Variability and commonality among modern humans. Journal of Human Evolution 50(2):203–218. DOI:10.1016/j.jhevol.2005.09.004.
- Badyaev AV 2005. Stress-induced variation in evolution: From behavioural plasticity to genetic assimilation. Proceedings of the Royal Society B: Biological Sciences 272:877–886.
- Bell AM, Sih A. 2007. Exposure to predation generates personality in threespined sticklebacks (Gasterosteus aculeatus). Ecology Letters 10(9):828–834. DOI:10.1111/j.1461-0248.2007.01081.x.
- Benazzo A, Trucchi E, Cahill JA, Delser PM, Mona S, Fumagalli M, Bunnefeld L, Cornetti L, Ghirotto S, Girardi M, Ometto L, Panziera A, Rota-Stabelli O, Zanetti E, Karamanlidis A, Groff C, Paule L, Gentile L, Vilà C, Vicario S, Boitani L, Orlando L, Fuselli S, Vernesi C, Shapiro B, Ciucci P, Bertorelle G. 2017. Survival and divergence in a small group: The extraordinary genomic history of the endangered Apennine brown bear stragglers. Proceedings of the National Academy of Sciences 114(45):E9589–E9597. DOI:10.1073/pnas.1707279114.
- Bergmann C. 1848. Über die Verhältnisse der Wärmeökonomie der Thiere zu ihrer Größe. Göttingen, Germany: Vandenhoeck & Ruprecht.
- Bertolino S. 2009. Animal trade and non-indigenous species introduction: The world-wide spread of squirrels. Diversity & Distributions 15(4):701–708. DOI:10.1111/j.1472-4642.2009.00574.x.
- Bertolino S, Lurz PWW. 2013. Callosciurus squirrels: Worldwide introductions, ecological impacts and recommendations to prevent the establishment of new invasive populations. Mammal Review 43(1):22–33. DOI:10.1111/j.1365-2907.2011.00204.x.
- Bookstein FL. 1991. Morphometric tools for landmark data: Geometry and biology. Cambridge, England: Cambridge University Press.
- Bookstein FL. 2017. A newly noticed formula enforces fundamental limits on geometric morphometric analyses. Evolutionary Biology 44(4):522–541. DOI:10.1007/s11692-017-9424-9.
- Bryant EH, Meffert LM. 1988. Effect of an experimental bottleneck on morphological integration in the housefly. Evolution 42(4):698–707. DOI:10.1111/j.1558-5646.1988.tb02488.x.
- Cadotte MW. 2006. Darwin to Elton: Early ecology and the problem of invasive species. In: Mw C, Sm M, Fukami T, editors. Conceptual ecology and invasion biology: reciprocal approaches to nature. Dordrecht, Netherlands: Springer. pp. 15–33.
- Cardini A. 2003. The geometry of the Marmot (Rodentia: Sciuridae) Mandible: Phylogeny and patterns of morphological evolution. Systematic Biology 52(2):186–205. DOI:10.1080/10635150390192807.
- Cardini A, Nagorsen D, O’Higgins P, Polly PD, Thorington RWT, Tongiorgi P. 2009. Detecting biological distinctiveness using geometric morphometrics: An example case from the Vancouver Island marmot. Ethology Ecology & Evolution 21(3–4):209–223. DOI:10.1080/08927014.2009.9522476.
- Cardini A, O’higgins P. 2004. Patterns of morphological evolution in Marmota (Rodentia, Sciuridae): Geometric morphometrics of the cranium in the context of marmot phylogeny, ecology and conservation. Biological Journal of the Linnean Society 82(3):385–407. DOI:10.1111/j.1095-8312.2004.00367.x.
- Casanovas-Vilar I, van Dam J. 2013. Conservatism and adaptability during squirrel radiation: What is Mandible shape telling us? (A Goswami, Ed.). PLoS ONE 8(4):e61298. DOI:10.1371/journal.pone.0061298.
- Clarke GM, Brand GW, Whitten MJ. 1986. Fluctuating asymmetry: A technique for measuring developmental stress caused by inbreeding. Australian Journal of Biological Sciences 39(2):145–154. DOI:10.1071/BI9860145.
- Close B, Banister K, Baumans V, Bernoth E-M, Bromage N, Bunyan J, Erhardt W, Flecknell P, Gregory N, Hackbarth H. 1996. Recommendations for euthanasia of experimental animals: Part 1. Laboratory Animals 30(4):293–316. DOI:10.1258/002367796780739871.
- Close B, Banister K, Baumans V, Bernoth E-M, Bromage N, Bunyan J, Erhardt W, Flecknell P, Gregory N, Hackbarth H, Morton D, Warwick MC. 1997. Recommendations for euthanasia of experimental animals: Part 2. Laboratory Animals 31(1):1–32. DOI:10.1258/002367797780600297.
- Colangelo P, Loy A, Huber D, Gomerčić T, Vigna Taglianti A, Ciucci P. 2012. Cranial distinctiveness in the Apennine brown bear: Genetic drift effect or ecophenotypic adaptation?. Biological Journal of the Linnean Society 107(1):15–26. DOI:10.1111/j.1095-8312.2012.01926.x.
- DeLeon VB. 2007. Fluctuating asymmetry and stress in a medieval Nubian population. American Journal of Physical Anthropology 132(4):520–534. DOI:10.1002/ajpa.20549.
- Falk D, Pyne L, Helmkamp RC, DeRousseau CJ. 1988. Directional asymmetry in the forelimb ofMacaca mulatta. American Journal of Physical Anthropology 77(1):1–6. DOI:10.1002/ajpa.1330770102.
- Firmat C, Schliewen UK, Losseau M, Alibert P. 2012. Body shape differentiation at global and local geographic scales in the invasive cichlid Oreochromis mossambicus. Biological Journal of the Linnean Society 105(2):369–381. DOI:10.1111/j.1095-8312.2011.01802.x.
- Friendly M. 2020. Matrix functions for teaching and learning linear algebra and multivariate statistics. Version 0.9.4. http://friendly.github.io/matlib/.
- Galatius A, Jespersen A. 2005. Bilateral directional asymmetry of the appendicular skeleton of the harbor porpoise (phocoena Phocoena). Marine Mammal Science 21(3):401–410. DOI:10.1111/j.1748-7692.2005.tb01240.x.
- Genovesi P, Carnevali L, Alonzi A, Scalera R. 2012. Alien mammals in Europe: Updated numbers and trends, and assessment of the effects on biodiversity. Integrative Zoology 7(3):247–253. DOI:10.1111/j.1749-4877.2012.00309.x.
- Gilligan DM, Woodworth LM, Montgomery ME, Nurthen RK, Briscoe DA, Frankham R. 2000. Can fluctuating asymmetry be used to detect inbreeding and loss of genetic diversity in endangered populations?. Animal Conservation 3(2):97–104. DOI:10.1111/j.1469-1795.2000.tb00234.x.
- Ginot S, Herrel A, Claude J, Hautier L. 2018. Skull size and biomechanics are good estimators of In Vivo bite force in Murid Rodents. The Anatomical Record 301(2):256–266. DOI:10.1002/ar.23711.
- Heaney LR. 1984. Mammalian species richness on islands on the Sunda Shelf, Southeast Asia. Oecologia 61(1):11–17. DOI:10.1007/BF00379083.
- Jarvis JP, Cropp SN, Vaughn TT, Pletscher LS, King‐Ellison K, Adams‐Hunt E, Erickson C, Cheverud JM. 2011. The effect of a population bottleneck on the evolution of genetic variance/covariance structure. Journal of Evolutionary Biology 24(10):2139–2152. DOI:10.1111/j.1420-9101.2011.02347.x.
- Jojić V, Blagojević J, Vujošević M. 2012. Two-module organization of the mandible in the yellow-necked mouse: A comparison between two different morphometric approaches. Journal of Evolutionary Biology 25(12):2489–2500. DOI:10.1111/j.1420-9101.2012.02612.x.
- Kharlamova AV, Trut LN, Chase K, Kukekova AV, Lark KG. 2010. Directional asymmetry in the limbs, skull and pelvis of the silver fox (V. vulpes). Journal of Morphology 271(12):1501–1508. DOI:10.1002/jmor.10890.
- Klenovšek T, Kryštufek B. 2013. An ontogenetic perspective on the study of sexual dimorphism, phylogenetic variability, and allometry of the skull of European ground squirrel, Spermophilus citellus (Linnaeus, 1766). Zoomorphology 132(4):433–445. DOI:10.1007/s00435-013-0196-1.
- Klingenberg CP. 2003. A developmental perspective on developmental instability: Theory, models and mechanisms. In: Polak M , editor. Developmental instability: Causes and consequences. New York: Oxford University Press. pp. 14–34.
- Klingenberg CP. 2005. Developmental constraints, modules, and evolvability. In: Hallgrímsson B, Hall BK, editors. Variation: A central concept in biology. Burlington: Academic Press. pp. 219–247.
- Klingenberg CP. 2008. Morphological integration and developmental modularity. Annual Review of Ecology, Evolution, and Systematics 39(1):115–132. DOI:10.1146/annurev.ecolsys.37.091305.110054.
- Klingenberg CP. 2011. MorphoJ: An integrated software package for geometric morphometrics. Molecular Ecology Resources 11(2):353–357. DOI:10.1111/j.1755-0998.2010.02924.x.
- Klingenberg CP. 2015. Analyzing fluctuating asymmetry with geometric morphometrics: Concepts, methods, and applications. Symmetry 7:843–934.
- Klingenberg CP, Marugán-Lobón J. 2013. Evolutionary covariation in geometric morphometric data: Analyzing integration, modularity, and allometry in a phylogenetic context. Systematic Biology 62(4):591–610. DOI:10.1093/sysbio/syt025.
- Klingenberg CP, Mebus K, Auffray J-C. 2003. Developmental integration in a complex morphological structure: How distinct are the modules in the mouse mandible?. Evolution & Development 5(5):522–531. DOI:10.1046/j.1525-142X.2003.03057.x.
- Korablev NP, Korablev MP, Korablev PN. 2011. Introduction of alien species and microevolution: The European beaver, raccoon dog, and American mink. Biology Bulletin 38(2):146–155. DOI:10.1134/S1062359011020051.
- Kujanová M, Bigoni L, Velemínská J, Velemínský P. 2008. Limb bones asymmetry and stress in medieval and recent populations of Central Europe. International Journal of Osteoarchaeology 18(5):476–491. DOI:10.1002/oa.958.
- Leamy LJ, Doster MJ, Huet-Hudson YM. 1999. Effects of methoxychlor on directional and fluctuating asymmetry of mandible characters in mice. Ecotoxicology 8(2):63–71. DOI:10.1023/A:1008921501005.
- Leamy LJ, Pomp D, Eisen EJ, Cheverud JM. 2000. Quantitative trait loci for directional but not fluctuating asymmetry of mandible characters in mice. Genetical Research 76(1):27–40. DOI:10.1017/S0016672300004559.
- Leary RF, Allendorf FW. 1989. Fluctuating asymmetry as an indicator of stress: Implications for conservation biology. Trends in Ecology & Evolution 4(7):214–217. DOI:10.1016/0169-5347(89)90077-3.
- Leary S, Underwood W, Anthony R, Cartner S, Corey D, Grandin T, Greenacre CB, Gwaltney-Bran S, McCrackin MA, Meyer R, Miller D, Shearer J, Yanong R. 2013. AVMA guidelines for the Euthanasia of animals: 2013 edition. Schaumburg, IL: American Veterinary Medical Association.
- Lens L, Dongen SV. 2000. Fluctuating and directional asymmetry in natural bird populations exposed to different levels of habitat disturbance, as revealed by mixture analysis. Ecology Letters 3(6):516–522. DOI:10.1046/j.1461-0248.2000.00181.x.
- Loy A, Genov P, Galfo M, Jacobone MG, Taglianti AV. 2008. Cranial morphometrics of the Apennine brown bear (Ursus arctos marsicanus) and preliminary notes on the relationships with other southern European populations. Italian Journal of Zoology 75(1):67–75. DOI:10.1080/11250000701689857.
- Magrini S, Scoppola A. 2010. Geometric morphometrics as a tool to resolve taxonomic problems: The case of Ophioglossum species (ferns). In: Nimis PL, Vignes Lebbe R, editors. Tools for identifying biodiversity: Progress and problems. Trieste: Edizioni Università di Firenze. pp. 251–256.
- Mazzamuto MV, Galimberti A, Cremonesi G, Pisanu B, Chapuis J-L, Stuyck J, Amori G, Su H, Aloise G, Preatoni DG, Wauters LA, Casiraghi M, Martinoli A. 2016. Preventing species invasion: A role for integrative taxonomy?. Integrative Zoology 11(3):214–228. DOI:10.1111/1749-4877.12185.
- Mazzamuto MV, Panzeri M, Wauters L, Preatoni D, Martinoli A. 2016. Knowledge, management and optimiozation: The use of live traps in control of non-native squirrels. Mammalia 80(3):305–311.
- Melero Y, Palazón S, Gosàlbez J. 2007. Morphological adaptation of an invasive American mink population in Mediterranean areas of Spain. Acta Zoologica 89(1):47–51. DOI:10.1111/j.1463-6395.2007.00290.x.
- Meloro C, Guidarelli G, Colangelo P, Ciucci P, Loy A. 2017. Mandible size and shape in extant Ursidae (Carnivora, Mammalia): A tool for taxonomy and ecogeography. Journal of Zoological Systematics and Evolutionary Research 55(4):269–287. DOI:10.1111/jzs.12171.
- Meloro C, Raia P, Carotenuto F, Cobb SN. 2011. Phylogenetic signal, function and integration in the subunits of the carnivoran mandible. Evolutionary Biology 38(4):465–475. DOI:10.1007/s11692-011-9135-6.
- Özener B. 2010. Fluctuating and directional asymmetry in young human males: Effect of heavy working condition and socioeconomic status. American Journal of Physical Anthropology 143(1):112–120. DOI:10.1002/ajpa.21300.
- Meloro C, Raia P, Piras P, Barbera C, O’higgins P. 2008. The shape of the mandibular corpus in large fissiped carnivores: Allometry, function and phylogeny. Zoological Journal of the Linnean Society 154(4):832–845. DOI:10.1111/j.1096-3642.2008.00429.x.
- Michaux J, Chevret P, Renaud S. 2007. Morphological diversity of Old World rats and mice (Rodentia, Muridae) mandible in relation with phylogeny and adaptation. Journal of Zoological Systematics and Evolutionary Research 45(3):263–279. DOI:10.1111/j.1439-0469.2006.00390.x.
- Palmer AR, Strobeck C. 1986. Fluctuating asymmetry: Measurement, analysis, patterns. Annual Review of Ecology and Systematics 17(1):391–421. DOI:10.1146/annurev.es.17.110186.002135.
- Palmer GH, Koprowski J, Pernas T. 2007. Tree squirrels as invasive species: Conservation and management implications. In: Witmer GW, Pitt WC, Fagerstone KA, editors. Managing vertebrate invasive species: Proceedings of an international symposium. Fort Collins, Colorado, USA: USDA/APHIS Wildlife Services, National Wildlife Research Center.
- Parker JD, Torchin ME, Hufbauer RA, Lemoine NP, Alba C, Blumenthal DM, Bossdorf O, Byers JE, Dunn AM, Heckman RW. 2013. Do invasive species perform better in their new ranges?. Do Invasive Species Perform Better in Their New Ranges? Ecology 94(5):985–994. DOI:10.1890/12-1810.1.
- Phillips BL, Brown GP, Webb JK, Shine R. 2006. Invasion and the evolution of speed in toads. Nature 439(7078):803. DOI:10.1038/439803a.
- Prevosti FJ, Turazzini GF, Ercoli MD, Hingst-Zaher E. 2012. Mandible shape in marsupial and placental carnivorous mammals: A morphological comparative study using geometric morphometrics. Zoological Journal of the Linnean Society 164(4):836–855. DOI:10.1111/j.1096-3642.2011.00785.x.
- R Development Core Team. 2018. R: A language and environment for statistical computing. Vienna, Austria: R Foundation for Statistical Computing.
- Robins A, Rogers LJ. 2002. Limb preference and skeletal asymmetry in the cane toad, Bufo marinus (Anura: Bufonidae). Laterality: Asymmetries of Body, Brain and Cognition 7(3):261–275. DOI:10.1080/13576500244000049.
- Rohlf F. 2015. The tps series of software. Hystrix, the Italian Journal of Mammalogy 26:9–12.
- Rohlf FJ, Corti M. 2000. Use of two-block partial least-squares to study covariation in shape. Systematic Biology 49(4):740–753. DOI:10.1080/106351500750049806.
- Rohlf FJ, Slice D. 1990. Extensions of the procrustes method for the optimal superimposition of landmarks. Systematic Biology 39:40–59.
- Rott H. 2003. Developmental instability: Causes and consequences. Oxford, England: Oxford University Press.
- Sakai AK, Allendorf FW, Holt JS, Lodge DM, Molofsky J, With KA, Baughman S, Cabin RJ, Cohen JE, Ellstrand NC, McCauley DE, O’Neil P, Parker IM, Thompson JN, Weller SG. 2001. The population biology of invasive species. Annual Review of Ecology and Systematics 32(1):305–332. DOI:10.1146/annurev.ecolsys.32.081501.114037.
- Savriama Y, Klingenberg C. 2006. Geometric morphometrics of complex symmetric struc-tures: Shape analysis of symmetry and asymmetry with Procrustes methods. Evolution 56(10):1909–1920. DOI:10.1111/j.0014-3820.2002.tb00117.x.
- Schlager S. 2017. Morpho and Rvcg – Shape analysis in R: R-packages for geometric morphometrics, shape analysis and surface manipulations. In: Zheng G, Li S, Székely G, editors. Statistical shape and deformation analysis. Cambridge, Massachusetts, USA: Academic Press. pp. 217–256.
- Seligmann H. 2006. Evidence that minor directional asymmetry is functional in lizard hindlimbs. Journal of Zoology 245:205–208. DOI:10.1111/j.1469-7998.1998.tb00088.x.
- Shapiro MD, Bell MA, Kingsley DM 2006. Parallel genetic origins of pelvic reduction in vertebrates. Proceedings of the National Academy of Sciences 103:13753–13758.
- Shapiro MD, Marks ME, Peichel CL, Blackman BK, Nereng KS, Jónsson B, Schluter D, Kingsley DM. 2004. Genetic and developmental basis of evolutionary pelvic reduction in threespine sticklebacks. Nature 428(6984):717–723. DOI:10.1038/nature02415.
- Sidorovich V, Kruuk H, Macdonald D. 1999. Body size, and interactions between European and American mink (Mustela lutreola and M. vison) in Eastern Europe. Journal of Zoology 248(4):521–527.
- Simberloff D, Dayan T, Jones C, Ogura G. 2000. Character displacement and release in the small Indian mongoose, Herpestes javanicus. Ecology 81(8):2086–2099. DOI:10.1890/0012-9658(2000)081[2086:CDARIT]2.0.CO;2.
- Swiderski DL. 2003. Separating size from allometry: Analysis of lower jaw morphology in the fox squirrel, Sciurus niger. Journal of Mammalogy 84(3):861–876. DOI:10.1644/BRB-025.
- Swiderski DL, Zelditch ML. 2010. Morphological diversity despite isometric scaling of lever arms. Evolutionary Biology 37(1):1–18. DOI:10.1007/s11692-010-9081-8.
- Trotta V, Calboli FCF, Garoia F, Grifoni D, Cavicchi S. 2005. Fluctuating asymmetry as a measure of ecological stress in Drosophila melanogaster (Diptera: Drosophilidae). European Journal of Entomology 102:195–200. DOI:10.14411/eje.2005.031.
- Velhagen WA, Roth VL. 1999. Scaling of the mandible in squirrels. Journal of Morphology 232(2):107–132. DOI:10.1002/(SICI)1097-4687(199705)232:2<107::AID-JMOR1>3.0.CO;2-7.
- Vinyard CJ, Williams SH, Wall CE, Doherty AH, Crompton AW, Hylander WL. 2011. A preliminary analysis of correlations between chewing motor patterns and mandibular morphology across mammals. Integrative and Comparative Biology 51(2):260–270. DOI:10.1093/icb/icr066.
- Viscosi V, Cardini A. 2011. Leaf morphology, taxonomy and geometric morphometrics: A simplified protocol for beginners (C Lalueza-Fox, Ed.). PLoS ONE 6(10):e25630. DOI:10.1371/journal.pone.0025630.
- Wauters LA, Dhondt AA, Knothe H, Parkin DT. 1996. Fluctuating asymmetry and body size as indicators of stress in red squirrel populations in woodland fragments. The Journal of Applied Ecology 33(4):735. DOI:10.2307/2404944.
- Whitlock MC, Phillips PC, Fowler K. 2002. Persistence of changes in the genetic covariance matrix after a bottleneck. Evolution 56(10):1968–1975. DOI:10.1111/j.0014-3820.2002.tb00122.x.
- Zalewski A, Bartoszewicz M. 2012. Phenotypic variation of an alien species in a new environment: The body size and diet of American mink over time and at local and continental scales. Biological Journal of the Linnean Society 105(3):681–693. DOI:10.1111/j.1095-8312.2011.01811.x.
- Zelditch ML, Wood AR, Bonett RM, Swiderski DL. 2008. Modularity of the rodent mandible: Integrating bones, muscles, and teeth. Evolution & Development 10(6):756–768. DOI:10.1111/j.1525-142X.2008.00290.x.
- Zelditch ML, Wood AR, Swiderski DL. 2009. Building developmental integration into functional systems: Function-induced integration of mandibular shape. Evolutionary Biology 36(1):71–87. DOI:10.1007/s11692-008-9034-7.