
Abstract
The development of technology contributes to the increase in the exposure of living organisms to the E-field. While searching for food in the environment, the honeybee is exposed to the influence of this factor. The aim of our research was to determine the E-field effect with a frequency of 50 Hz at various intensities and exposure times on the concentration of protein, glucose, and triglycerides in the honeybee hemolymph. The analysis was carried out on hemolymph taken from at the age of 2 days old worker honeybees. The research showed changes in the tested parameters. Change related to exposure time and field intensity was noticed. The lowest protein concentration in the hemolymph of worker honeybee was observed in all control groups (0.13 mg/mL). The highest in the experimental groups were 23.0 kV/m and 34.5 kV/m with 12 h exposure time (1.04 mg/mL and 1.25 mg/mL). In all experimental groups, statistically significant lower values of glucose concentration in the hemolymph of worker honeybee were observed than in the control groups (23.43–23.55 mmol/l). The highest concentration of triglycerides was observed in the control groups (1.55 mmol/l). Lower but not statistically significant values were observed in the 5.0 kV/m 1 h, 11.5 kV/m 1 and 3 h, and 23.0 kV/m 3 h groups, while the differences were statistically significant in the other groups. The results of the research confirm our earlier observations that the E-field can induce similar reactions in the body to the pathogen. Changes in these important indicators of the body’s nutritional status such as protein, glucose, and triglyceride levels can have long-term effects.
Introduction
The development of technology and telecommunications is a global phenomenon. This generates the need to develop long distance energy transmission and increases the demand for its production. Every year, transmission lines cross the natural environment more densely and reach further corners. These lines generate an electromagnetic field at frequency 50 Hz or 60 Hz that affects the surrounding environment. This field is classified as Extremely Low Frequency (ELF) and is generated by domestic distribution lines, domestic appliances, electric engines in cars, trains, and tramways, and welding devices (Ahlbom et al. Citation2005). These frequencies are the most popular part of the polluting electromagnetic spectrum. For ELF fields we are practically always dealing with a near field, in which an electric field can be treated independently from the magnetic one. It can be assumed that the intensity of the electric field depends on the voltage and the magnetic field from the current flowing in the circuit (Al-Bassam et al. Citation2016). Due to the construction of overhead high-voltage lines, the electric field strength under the lines may vary from 1 kV/m, even to 10 kV/m at a height of 2–3 m on the ground surface, reaching over 20 kV/m at a height of 5–10 m depending on the height of the wires above the ground and the operating voltage of the line and it is constant over time. The magnetic field depends directly on the load on the line and its intensity may change even several times over time.
The quality of life of honeybees is determined by the surrounding environment. If there are changes in the living environment of honeybees, it affects their reactions and functioning. After exposure to an electric field (E-field) with a frequency of 50 Hz of varying intensity, a disturbance in the behavior and physiology of honeybees is observed (Migdał et al. Citation2021). This may reduce the effectiveness of honeybees as pollinators (Migdał et al. Citation2018). The honeybee to function properly, like other animals, needs a varied diet containing proteins, carbohydrates, and fats in addition to a sustainable environment.
Proteins and amino acids are components of the cytoskeleton, enzymes, receptors, tissues, immune proteins, etc. (Azvedo et al. Citation2016). It is necessary to deliver them to the body and maintain an appropriate level of body fluid. Both their deficiency and their too high concentration indicate malfunctions in the functioning and nutrition of the body. In the case of honeybees, proteins are considered one of the main components of the hemolymph. The protein concentration ranges from 1 to 10% of the hemolymph. The season of the year, the availability of feed in the environment, and environmental pollution affect the protein concentration. Low protein level occurs in the larval period and increases during the molting period (Sokół Citation2003). When exposed to environmental stressors, the concentration of proteins in the honeybees’ hemolymph decreases. Among the hemolymph proteins, immune proteins constitute an essential group. The increase in their concentration indicates the body’s defensive reactions. The decrease in their concentration proves their degradation (Sokół Citation2003; Evans et al. Citation2006).
The basic source of energy in the body of a honeybee is carbohydrates. Their appropriate concentration in the hemolymph determines the activity of honeybees. The hemolymph, circulating through the body, nourishes all tissues and cells. At the same time, it provides information on the nourishment of the body, which contributes to the regulation of appetite (Thompson Citation2003). The most important sugars in the hemolymph of honeybees are glucose, fructose, and trehalose. Fructose is quickly converted into glucose, which can be metabolized or stored as trehalose or glycogen (Blatt & Roces Citation2001). The demand for carbohydrates depends on the activities performed by the honeybee. The demand increases during flight and decreases at rest. Moreover, during starvation, trehalose is catabolized to maintain a stable glucose level to provide energy to cells for vital functions (Mayack & Naug Citation2010).
Triglycerides are organic compounds belonging to simple fats, which are esters of glycerol and three fatty acids (Nelson & Cox Citation2000). In the case of honeybees, triglycerides are mainly stored in the fat body. They constitute an energy reserve and are used especially in periods of hunger and overwintering. Their concentration decreases in the fat body and increases in the hemolymph during the season (Hahn & Denlinger Citation2007). They are also used during the long flight and spring development of honeybee colonies.
Our research was focused on checking the effect of an artificial E-field with a frequency of 50 Hz at varying intensities and exposure times on the total protein content and the concentration of glucose, and triglycerides in the hemolymph of worker honeybee
Materials and methods
Research material –worker Honeybee
One-frame insulators with an empty Dadant honey comb (435 × 300 mm) were placed in 5 honeybee colonies. After 3 days, one queen were placed in each of them for 24 hours and then released. The frames were marked and left in the hives until the 20th day of brood development. The comb with brood was then collected from the colonies and placed in an incubator with a controlled temperature of 34.4°C ± 0.5°C and 70% ± 5%. In the incubator worker honeybees had ensured honey and bee bread ad libitum. 1-day-old worker honeybees were placed in wooden cages (200 × 150 × 70 mm), each containing 100 workers and two inner feeders with sucrose solution at a concentration of 1 mol/dm3 ad libitum. Each group (experimental and control) consisted of 10 cages. The research material consisted of 2 days old worker honeybees. The method according to Migdał et al. (Citation2020a).
Exposure time
In our research, we used different exposure times, including 1, 3, 6 and 12 h. Honeybees spend different times obtaining nectar and pollen in the environment, which also affects the time of exposure to the electromagnetic field. Duration on average can be assumed that: 1 h - the average time that worker honeybees spend in the environment while searching of nectar or pollen - during a single flight; 3 h - the time spent by the worker honeybee on bringing large and heavy portions of nectar or pollen from distant sources - during a single flight; 6 h - the maximum average time that a worker honeybee can devote to searching for nectar or pollen - during a single flight (Bradbear Citation2009). For showing the linear increase, we used 12 h exposition time.
E-field generating
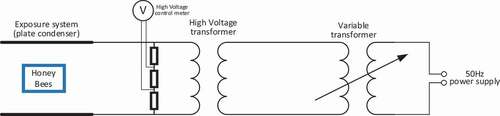
A homogeneous stable and continuous 50 Hz E-field was generated in the exposure system in the form of a plate capacitor powered by a regulated high voltage transformer system like in the method of Migdał et al. (Citation2020a). The plate capacitor was constructed from two electrodes made as square 100 × 100 cm dimension wire mesh with a 10 × 10 m grid. A constant distance of 20 cm was kept between electrodes (). The field intensity was fixed to 5.0 kV/m, 11.5 kV/m, 23.0 kV/m, and 34.5 kV/m. The heterogeneity and instability of the field strength in the entire test area did not exceed 5% in relation to the field strength in the center of the exposure area. The control group was not treated to the artificial E-field (electromagnetic field <1.00 kV/m). Changes in homogeneity and stability of E-field intensity were no higher than ±5% to the emitter, to which the honeybees were exposed during the whole experiment. Field intensity and homogeneity in the test area were verified by the measurements made by an LWiMP accredited testing laboratory using the ESM-100-meter No. 972153 with calibration certificate LWiMP/W/070/2017 dated 15/02/2017 issued by the accredited calibration laboratory PCA AP-078. The measurements were done in the points of a 10 × 10 × 5 cm3 mesh inside an empty emitter (without experimental cages). The stability of the electric field was maintained by permanently monitoring the voltage applied to the exposure system using a control circuit (Migdał et al. Citation2020a).
Schema 1. Exposure of bees to the E-field at 50 Hz and variable intensities in laboratory conditions
Hemolymph analyses
Hemolymph was taken from 100 alive worker honeybees from each group immediately after exposure to E-field, by removing the antennae with sterile tweezers. Hemolymph was conserved in a 20 µl glass capillary. Hemolymph from the control honeybees were collected after 1, 3, 6 and 12 h. The test tubes were placed on the cooling block during operation. After collecting, samples were stored at −80°C (Migdał et al. Citation2020b). Total protein content was determined using the Lowry method modified by Schacterle and Pollack (Citation1973) and Łoś and Strachecka (Citation2018) as follows: 10 µl of copper reagent were added to 10 µl solution/hemolymph samples for a ten-minute incubation at 25°C. Subsequently, 40 µl of Folin reagent was added (1:17) for a five-minute incubation at 55°C. The resultant samples were analyzed spectrophotometrically (Eppendorf BioPhotometer) to measure the absorbance at 650 nm. The concentrations of triglycerides and glucose were measured with the colorimetric method using Cormay monotests (Lublin, Poland) according to the manufacturer’s procedure.
Statistical analysis
The statistical significance of data within groups and between groups was determined by the Kruskal Wallis test with Bonferroni correction. For all tests, RStudio and a significance level of α = 0.05 were used.
Results
Total protein concentration in the hemolymph
The lowest protein concentration in the hemolymph of worker honeybee was observed in all control groups. The highest in the experimental groups were 23.0 kV/m and 34.5 kV/m with 12 h exposure time (). In the case of the control groups, no statistically significant differences concerning different exposure times were observed. In the experimental groups, the protein concentration increased statistically significantly in relation to the control groups, except for the group of 11.5 kV/m with 1 h of exposure. In all experimental groups, an increase in protein concentration was observed with increasing exposure time ().
Figure 1. Average protein concentration in the hemolymph of honeybees from individual groups. The name of the group combines the E-field intensity to which the honeybees were exposed and the duration of the factor’s action. Control groups are marked with letter C. The letter: A, B, C, … on the figure indicate statistical differences within and between groups at the level of p ≤ 0.05
Table I. The average level of selected parameters in the hemolymph of honeybee workers and standard deviation of these parameters
The concentration of glucose in the hemolymph
The control groups were characterized by uniform results regardless of the exposure time and no statistically significant differences were found (). In all experimental groups, statistically significant lower values of glucose concentration in the hemolymph of worker honeybee were observed than in the control groups. Additionally, within the selected intensities, a decrease in glucose concentration was observed with increasing exposure time. There were no statistically significant differences between the experimental groups at 1 and 3 h exposure, the exception being the 34.5 kV/m 3 h group ().
Figure 2. Average concentration of glucose in the hemolymph of honeybees from individual groups. The name of the group combines the E-field intensity to which the honeybees were exposed and the duration of the factor’s action. Control groups are marked with letter C. The letter: A, B, C, … on the figure indicate statistical differences within and between groups at the level of p ≤ 0.05
The concentration of triglycerides in the hemolymph
The highest concentration of triglycerides was observed in the control groups (). Lower but not statistically significant values were observed in the 5.0 kV/m 1 h, 11.5 kV/m 1 and 3 h, and 23.0 kV/m 3 h groups, while the differences were statistically significant in the other groups. The lowest values were observed in the 23.0 kV/m and 34.5 kV/m groups with 12 h exposure time. In the 5.0 kV/m and 11.5 kV/m groups, a decrease in triglyceride concentration can be seen with prolonged exposure times. In the remaining 2 groups, no direct relationship was observed between the prolonged exposure time and the changes in the triglyceride concentration in the worker honeybee hemolymph ().
Figure 3. Average concentration of triglycerides in the hemolymph of honeybees from the individual groups. The name of the group combines the E-field intensity to which the honeybees were exposed and the duration of the factor’s action. Control groups are marked with letter C. The letter: A, B, C, … on the figure indicate statistical differences within and between groups at the level of p ≤ 0.05
Discussion
Total protein concentration in the hemolymph
The increase in the protein content in the hemolymph observed in our research may indicate a disorder of its distribution in the body. The appropriate level of protein in the hemolymph contributes to the maintenance of homeostasis and the activity of proteolytic enzymes in the middle intestine (Sagili et al. Citation2005; Zheng et al. Citation2014). Its deficiency in the diet may reduce the functioning of the throat glands in worker honeybees and shorten the life of honeybees (Zheng et al. Citation2014). Basualdo et al. (Citation2013) in studies on the honeybee diet, obtained lower baseline values than those presented in their research. This may result from differences in the preparation of honeybees for research. Similar values for the control group obtained in our research were presented in the work of Sokół (Citation2003), who investigated the effect of levamisole on colonies infested with Varroa destructor. The protein content in the hemolymph of honeybees at one age and fed similarly should be stable (Sokół Citation2003; Basualdo et al. Citation2013). Own research showed changes in protein content under the influence of an E-field with a frequency of 50 Hz with varying exposure time and intensity. In our research, an increase in protein concentration in the honeybees’ hemolymph was observed. The increase in protein concentration was observed in the work of Randolt et al. (Citation2008), honeybees were exposed to damage to the body surface. The increase in the activity of proteolytic and antioxidant enzymes was observed in the work of Migdał et al. (2020). In both cases, these increases were associated with the stimulation of proteins that are part of the immune system. The increase in protein concentration was also observed in the authors’ research.
The concentration of glucose in the hemolymph
Changes in sugar concentration in the honeybee hemolymph are associated with many factors, such as the age of workers, their body condition, and environmental conditions (Blatt & Roces Citation2001). Values similar to those obtained in our research for the studied groups were obtained in the analysis of honeybees 10 times older, at the age of 21 days (Bajda et al. Citation2014). A decrease in the glucose content in the hemolymph was observed in honeybees infected with Varroa destructor (Yang & Cox-Foster Citation2005). Similar trends in the decrease in glucose levels to those shown in the authors’ research in the hemolymph of workers were observed during the parasitization of Nosema cerenae (Mayack & Naug Citation2010). This may indicate the reaction of the honeybees to the E-field as in the case of a disease attack. Additionally, the glucose content in the hemolymph is strongly correlated with the metabolic rate of honeybees (Blatt & Roces Citation2001). Too low concentration may reduce the honeybees’ ability to fly and make it difficult for them to return to the nest. The decrease in glucose concentration observed in our study may cause a reduction in the metabolic rate. Similar observations were shown in the work of Blatt and Roces (Citation2001) and Mayack and Naug (Citation2010) analyzing food preferences and metabolic rate of worker honeybees. Such disturbances in the glucose level in the hemolymph, observed after honeybees exposure to the 50 Hz electric field at various intensities, may indicate an increase in their energy demand.
The concentration of triglycerides in the hemolymph
Triglycerides are one of the non-enzymatic markers of the state of the body. Their disturbance may indicate pathological situations in the organisms of honeybees. The change in the concentration of triglycerides in the human blood indicates metabolic disorders (Jeppesen et al. Citation2000). In our study, statistically significant differences in the level of triglycerides compared to the control samples were observed, it was particularly visible at 6 and 12 h exposure. Disturbances in the management of triglycerides were also observed in the work of Bajda et al. (Citation2014) during the treatment of honeybees with amphotericin - B. Lower levels of triglycerides in the hemolymph than in our study were observed in female Osmia rufa (Strachecka et al. Citation2017). The difference is due to the specificity of the species. The decrease in triglyceride content was also observed in honeybees infested with Varroa destructor, it was especially visible in the groups intensively infested (Aronstein et al. Citation2012). In the author’s research, changes in triglyceride levels were observed, similar to those in the case of infection with diseases obtained by other authors.
Our results show that an E-field changed the level of total protein concentration, glucose and triglycerides in honeybee hemolymph. We do not know if the changes in biochemical markers activity of the honeybee after E-field exposure persist and for how long. It would be important to investigate biochemical markers at different time intervals after the end of exposure to an E-field. It can be helpful to provide a better understanding of the response of the honeybee organism exposing to environmental stressors.
Conclusion
The results of the research confirm our earlier observations that the E-field can induce similar reactions in the body to the pathogen. Changes in these important indicators of the body’s nutritional status such as protein, glucose, and triglyceride levels can have long-term effects. Currently, it is difficult to unequivocally explain the mechanism of E-field influence on the insect organism. It can be stated that it causes disturbances of some physiological indicators. More research is needed on E-field as one of the threats to the honeybee.
Author contributions
P.M. – conceptualization, formal analysis, development of methodology, writing-original draft; P.M and A.M. – writing-review & editing and data curation, development visualization, P.M. and A.M. – carrying out the experiment; P.M. and A.S. – consultation; P.B. – designed E-field exposure system and development of the E-field parameters used in experiments. A.R. –consultation.
Disclosure statement
No potential conflict of interest was reported by the author(s).
Data availability statement
The datasets generated during and/or analysed during the current study are available from the corresponding author on reasonable request.
Additional information
Funding
References
- Ahlbom A, Bridges J, de Seze R, Hillert L, Juutilainen J, Mattsson MO, Neubauer G, Schuz J, Simko M, Bromen K. 2005. Scientific Committee on Emerging and Newly Identified Health Risks, SCENIHR, possible effects of Electromagnetic Fields (EMF) on human health. Toxicology.
- Al-Bassam E, Elumalai A, Khan A, Al-Awadi L. 2016. Assessment of electromagnetic field levels from surrounding high-tension overhead power lines for proposed land use. Environmental Monitoring and Assessment 188(5). DOI: 10.1007/s10661-016-5318-z.
- Aronstein KA, Saldivar E, Vega R, Westmiller S, Douglas AE. 2012. How Varroa parasitism affects the immunological and nutritional status of the honey bee, Apis mellifera. Insects 3:601–615. DOI: 10.3390/insects3030601.
- Azvedo DO, de Paula SO, Zanuncio JC, Martinez LC, Serrao JE. 2016. Juvenile hormone downregulates vitellogenin production in Ectatomma tuberculatum (Hymenoptera: Formicidae) sterile workers. Journal of Experimental Biology 219:103–108.
- Bajda M, Łoś A, Merska M. 2014. Effect of amphotericin B on the biochemical markers in the haemolymph of honey bees. Medycyna Weterynaryjna 70(12):766–768.
- Basualdo M, Barragan S, Vanagas L, Garcia C, Solana H, Rodriguez EM, Bedascarrasbure E. 2013. Conversion of high and low pollen protein diets into protein in worker honey bees (Hymenoptera: Apidae). Journal of Economic Entomology 106(4):1553–1558. DOI: 10.1603/EC12466.
- Blatt J, Roces F. 2001. Haemolymph sugar levels in foraging honeybees (Apis mellifera carnica): Dependence on metabolic rate and in vivo measurement of maximal rates of trehalose synthesis. Journal of Experimental Biology 204:2709–2716. DOI: 10.1242/jeb.204.15.2709.
- Bradbear N. 2009. Bees and their role in forest livelihoods, A guide to the services provided by bees and the sustainable harvesting, processing and marketing of their products; Food and Agriculture Organization of the United Nations, Rome, Italy. Environmental Monitoring and Assessment 188:316. DOI: 10.1007/s10661-016-5318-z.
- Evans JD, Aronstein K, Chen YP, Hetru C, Imler JL, Jiang H, Kanost M, Thompson GJ, Zou Z, Hultmark D. 2006. Immune pathways and defence mechanisms in honey bees Apis mellifera. Insect Molecular Biology 15(5):645–656. DOI: 10.1111/j.1365-2583.2006.00682.x.
- Hahn DA, Denlinger DL. 2007. Meeting the energetic demands of insect diapause: Nutrient storage and utilization. Journal of Insect Physiology 53:760–773. DOI: 10.1016/j.jinsphys.2007.03.018.
- Jeppesen J, Hein HO, Suadicani P, Gyntelberg F. 2000. High triglycerides and low HDL cholesterol and blood pressure and risk of ischemic heart disease. Hypertension 36:226–232. DOI: 10.1161/01.HYP.36.2.226.
- Łoś A, Strachecka A. 2018. Fast and cost-effective biochemical spectrophotometric analysis of solution of insect “blood” and body surface elution. Sensors 18:1494. DOI: 10.3390/s18051494.
- Mayack C, Naug D. 2010. Parasitic infection leads to decline in hemolymph sugar levels in honeybee foragers. Journal of Insect Physiology 56(11):1572–1575. DOI: 10.1016/j.jinsphys.2010.05.016.
- Migdał P, Murawska A, Bieńkowski P, Berbeć E, Roman A. 2021. Changes in honeybee behavior parameters under the influence of the E-Field at 50 Hz and variable intensity. Animals 11:247. DOI: 10.3390/ani11020247.
- Migdał P, Murawska A, Roman A. 2020b. A modified standardized method to extract and store insect hemolymph with use of a glass capillary. Journal of Apicultural Science 64:1. DOI: 10.2478/jas-2020-0004.
- Migdał P, Roman A, Popiela-Pleban E, Kowalska-Góralska M, Opaliński S. 2018. The impact of selected pesticides on honey bees. Polish Journal of Environmental Studies 27(2):787–792. DOI: 10.15244/pjoes/74154.
- Migdał P, Roman A, Strachecka A, Murawska A, Bieńkowski P. 2020a. Changes of selected biochemical parameters of the honeybee under the influence of an electric field at 50 Hz and variable intensities. Apidologie 51:956–967. DOI: 10.1007/s13592-020-00774-1.
- Nelson DL, Cox MM. 2000. Lehninger, principles of biochemistry. 3rd ed. New York: Worth Publishing.
- Randolt K, Gimple O, Geissendörfer J, Reinders J, Prusko C, Mueller MJ, Albert S, Tautz J, Beier H. 2008. Immune‐related proteins induced in the hemolymph after aseptic and septic injury differ in honey bee worker larvae and adults. Archives of Insect Biochemistry and Physiology 69(4):155–167. DOI: 10.1002/arch.20269.
- Sagili RR, Pankiw T, Zhu-Salzman K. 2005. Effects of soybean trypsin inhibitor on hypopharyngeal gland protein content, total midgut protease activity and survival of the honey bee (Apis mellifera L.). Journal of Insect Physiology 51:953–957. DOI: 10.1016/j.jinsphys.2005.04.003.
- Schacterle G, Pollack R. 1973. Simplified method for quantitative assay of small amounts of protein in biological material. Analytical Biochemistry 51:654–655. DOI: 10.1016/0003-2697(73)90523-X.
- Sokół R. 2003. Wpływ lewamizolu na poziom białka całkowitego w hemolimfie pszczół z rodzin zarażonych roztoczem Varroa destructor. Wiadomosci Parazytologiczne 49:219–224.
- Strachecka A, Chobotow J, Paleolog J, Łoś A, Schulz M, Teper D, Kucharczyk H, Grzybek M. 2017. Insights into the biochemical defence and methylation of the solitary bee Osmia rufa L: A foundation for examining eusociality development. PloS One 12:4. DOI: 10.1371/journal.pone.0176539.
- Thompson SN. 2003. Trehalose—the insect ‘blood’ sugar. Advances in Insect Physiology 31:205–285.
- Yang X, Cox-Foster DL. 2005. Impact of an ectoparasite on the immunity and pathology of on invertebrate: Evidence for host immunosuppression and viral amplification. Proceedings of the National Academy of Sciences of the United States of America 102:7470–7475. DOI: 10.1073/pnas.0501860102.
- Zheng B, Wu Z, Xu B. 2014. The effects of dietary protein levels on the population growth, performance, and physiology of honey bee workers during early spring. Journal of Insect Science 14:191. DOI: 10.1093/jisesa/ieu053.