
 ?Mathematical formulae have been encoded as MathML and are displayed in this HTML version using MathJax in order to improve their display. Uncheck the box to turn MathJax off. This feature requires Javascript. Click on a formula to zoom.
Abstract
The adaptive adjustments in the capacity for metabolic thermogenesis are critical for the survival in many small mammals that are acclimated to cold winter conditions. In this study the striped hamsters (Cricetulus barabensis) were subjected to repeated cycles of cold (5°C) and warm (23°C) temperatures. Resting metabolic rate (RMR), nonshivering thermogenesis (NST) and energy intake, as well as the expression of uncoupling protein 1 (UCP1) of brown adipose tissue (BAT) and serum thyroid hormone levels were measured. Both RMR and NST were significantly increased in striped hamsters subjected to repeated cycles of short-term cold (5°C, 72 h) – warm (23°C, 4 days) temperatures compared to that of the hamsters consistently kept at 23°C. In these cycled hamsters, BAT UCP1 expression was significantly upregulated, whereas serum T3 and T4 concentration did not change significantly. Moreover, gross energy intake was considerably increased during both cold exposure and warm phases, whereas fat deposition was significantly decreased in these cycled hamsters compared to those consistently kept at 23°C. This indicates that small mammals may both increase energy intake and mobilize fat depots to cope with frequent cold exposure. Thyroid hormone may be not involved in the BAT UCP1-mediated thermogenesis and fat mobilization.
1. Introduction
In endothermic animals, ability to survive in cold environment requires proper physiological and behavioral strategy, and efficient thermoregulatory mechanisms (Jefimow et al. Citation2004a). The adaptive changes in the capacity for non-shivering thermogenesis (NST) are critical for the survival in many small mammals, such as rodents, when they are exposed to cold (Heldmaier et al. Citation1990; Jansky Citation1973; Haim & Izhaki Citation1993; Nespolo et al. Citation2001a; Woodley & Buffenstein Citation2002). The main advantage gained by using NST is the ability to generate heat over a short period of time to deal with acute cold exposure, therefore results in the widening of the thermal tolerance of a species without the need to maintain a high resting metabolic rate (RMR) (Heldmaier et al. Citation1990; Haim & Zisapel Citation1999). However, the animals that are chronically exposed to cold temperatures or acclimatized to a seasonal cold environment usually develop both high RMR and NST (Scantlebury et al. Citation2003; Song & Wang Citation2003; Wang et al. Citation2006; Jefimow Citation2007; Terrien et al. Citation2010). It has been proposed that RMR determines the metabolic scope and hence capacity for thermogenesis, and therefore RMR influences fitness by maximizing access to resources and winter survival (Bozinovic & Rosenmann Citation1989; Bozinovic Citation1992; Hinds et al. Citation1993; Woodley & Buffenstein Citation2002; Lovegrove Citation2003; Wang et al. Citation2006).
The whole body RMR can be estimated from the sum of weight of tissues and organs multiplied by their specific metabolic rate, suggesting that RMR would be determined by the weight of various organs and tissues of the body (Even et al. Citation2001). The NST is an adaptive form of thermogenesis that can be acutely induced by norepinephrine injection (i.e. an adrenergic thermogenesis). In mammals, the facultative NST is achieved mainly in brown adipose tissue (BAT), where the heat production occurred in the mitochondria as a consequence of a regulated uncoupling process mediated by uncoupling protein 1 (UCP1) (Nicholls Citation1976; Cannon & Nedergaard Citation2004). Animals usually increase food intake to meet the energy expenditure for increased RMR and NST (Cannon & Nedergaard Citation2004; Jefimow et al. Citation2004a, Citation2004b). It has been proposed that leptin signals reflecting nutritional state are sensed by the hypothalamus, which, in turn, modulates food intake and energy expenditure (Kennedy Citation1953; Friedman & Halaas Citation1998; Park & Ahima Citation2014). Leptin mediates its effects by binding to the long isoform of leptin receptor (ObRb) expressed in the hypothalamus (Park & Ahima Citation2014). Leptin promotes the gene expression and secretion of anorexigenic peptides of proopiomelanocortin (POMC) and cocaine-and-amphetamine-regulated-transcript (CART), but inhibit orexigenic peptides of neuropeptide Y (NPY) and agouti-related peptide (AgRP) expression in hypothalamus, thereby reducing food intake, increasing energy expenditure (Park & Ahima Citation2014; Xu et al. Citation2019). Leptin-mediated neuropeptides have been previously reported to regulate food intake and thermogenesis in small mammals acclimated to cold temperatures, whereas its role in the animals that were frequently exposed to cold condition remained uncertain (Lisboa et al. Citation2003).
It is by now an historical notion that thyroid hormones (THs) are unique in their ability to stimulate basal thermogenesis, that is BMR or RMR (Lannia et al. Citation2003). But it’s now known that THs are also involved in cold-induced BAT thermogenesis (Silva & Rabelo Citation1997). For example, hypothyroid rats do not survive cold well and fail to increase BAT recruitment (measured as UCP1 concentration and activation) in response to noradrenaline (Silva & Rabelo Citation1997; Lannia et al. Citation2003). In a variety of small mammals in the field, the seasonal enhancement of either RMR or NST in cold winter conditions are associated with an increased THs secretion and production (Freake & Oppenheimer Citation1995; Lannia et al. Citation2003; Kim Citation2008; Silva Citation2011; Li et al. Citation2019). The absence of T3 blocks UCP1 synthesis, leading to hypothermia (Zaninovich Citation2001). However, BAT thermogenesis in hypothyroid rats did not change after acclimation to a chronic cold condition compared to that in normal controls (Zaninovich et al. Citation2002). These hypothyroid rats subjected to long-term cold exposure had normal body temperature, and had gained more weight than normal controls, suggesting that cold adaptation can be maintained in the absence of THs (Zaninovich et al. Citation2002).
To examine the roles of THs-mediated metabolic thermogenesis in burrowing mammals that are frequently subjected to cold exposure, we investigated energy budgets, metabolic thermogenesis, and serum THs concentrations in striped hamsters (Cricetulus barabensis) that were experimentally exposed to repeated cycles of cold and warm temperatures. The striped hamster is a common rodent in northern China, Russia, Mongolia and Korea (Zhang & Wang Citation1998; Song & Wang Citation2003). Striped hamsters show considerable seasonal fluctuations in their energy budget and metabolic thermogenesis. We previously documented a significant increase in the RMR and/or NST of striped hamsters under cold conditions when UCP1-based BAT thermogenesis was activated (Zhao et al. Citation2010a; Zhao Citation2011). Here, we presented the results of experiments designed to determine the effects of repeated exposure to alternating cold (5°C) and warm (23°C) temperature cycles on the energy intake, metabolic thermogenesis, UCP1 expression in BAT, body composition and serum THs concentrations, of striped hamsters. We hypothesized that the striped hamsters would increase NST after repeated exposure to these temperature cycles. Furthermore, we hypothesized that THs-mediated up-regulation of BAT UCP1 would contribute to this increase in metabolic thermogenesis, which was possibly different from these animals that were chronically acclimated to cold temperatures.
2. Results
2.1. Body mass
There was no significant difference in the body mass of the three groups before the start of the experiment (day 0, F2,25 = 0.21, P > 0.05, )). The hamsters did not show significant changes in body mass throughout the experiment, during which body mass did not differ significantly among the three groups on any day (day 8, F2,25 = 0.16, P > 0.05; day 49, F2,25 = 0.19, P > 0.05).
Figure 1. Body mass (a) and food intake (b) of striped hamsters subjected to repeated cold (5°C) and warm (23°C) temperature cycles. 23oC, animals maintained at room temperature (23°C) throughout the experiment. Cold-24 h and Cold-72 h, animals exposed to 6 cold and warm temperature cycles (24 h at 5°C followed by 6 days at 23°C, and 72 h at 5°C followed by 4 days at 23°C) from the 2nd to 7th week of the experiment. Data are means ± s.e.m.; **P < 0.01.
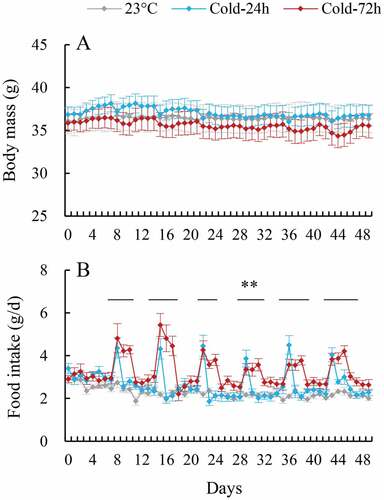
2.2. Food intake
Food intake did not significantly differ among three groups before the start of the experiment (day 0, F2,25 = 1.95, P > 0.05, )). The food intake of Cold-24 h and cold-72 h hamsters fluctuated considerably throughout the experiment, increasing during the cold, and decreasing during the warm, phase of each cold and warm cycle. The food intake of Cold-24 h and Cold-72 h hamsters was significantly higher during the cold phase of each cycle than that of the Con group. For example, Cold-24 h and cold-72 h hamsters consumed 58.9% and 75.3% more food on the cold day during the first cycle than those in the 23°C group (day 8, F2,25 = 4.61, P < 0.01).
2.3. Gross energy intake (GEI) and digestibility
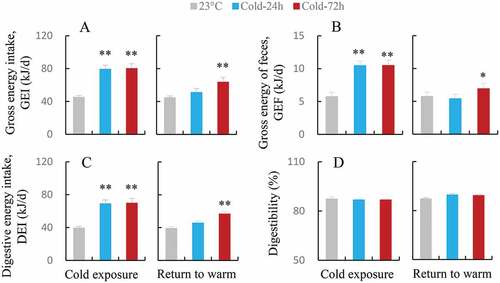
The GEI of Cold-24 h and Cold-72 h hamsters was higher by 75.8% and 77.8% during the phase of cold exposure than that of the hamsters kept at 23°C (F2,24 = 18.17, P < 0.01, ). The GEI of Cold-24 h hamsters did not differ significantly from that of 23°C hamsters during the warm phase, whereas that of Cold-72 h hamsters was significantly higher than that of 23°C hamsters (F2,24 = 17.47, P < 0.01). Both Cold-24 h and Cold-72 h hamsters showed significantly higher GEF than 23°C hamsters during the phase of cold exposure, indicating that they produced significantly more feces (F2,24 = 12.70, P < 0.01, ). There was no significant difference in GEF between Cold-24 h and 23°C groups during the warm phase, but the Cold-72 h group produced significantly more feces than the other two groups (F2,24 = 4.55, P < 0.05). Consistently, the Cold-24 h and Cold-72 h hamsters had significantly higher DEI during the cold phase (F2,24 = 16.40, P < 0.01, ), and only Cold-72 h hamsters showed significantly higher DEI during the warm phase than the 23°C hamsters (F2,24 = 17.74, P < 0.01). There was no significant difference in digestibility among the three groups during either the cold (F2,24 = 0.09, P > 0.05) or warm phase of the temperature (F2,24 = 2.59, P > 0.05, ).
Figure 2. Gross energy intake (GEI, a), gross energy of feces (GEF, b), digestive energy intake (DEI, c) and digestibility (d) in striped hamsters subjected to repeated cold (5°C) and warm (23°C) temperature cycles. 23oC, animals maintained at room temperature (23°C) throughout the experiment. Cold-24 h and Cold-72 h, animals exposed to 6 cold and warm temperature cycles (24 h at 5°C followed by 6 days at 23°C, and 72 h at 5°C followed by 4 days at 23°C) from the 2nd to 7th week of the experiment. Data are means ± s.e.m.; *P < 0.05, **P < 0.01.
2.4. RMR, NST and NSTr
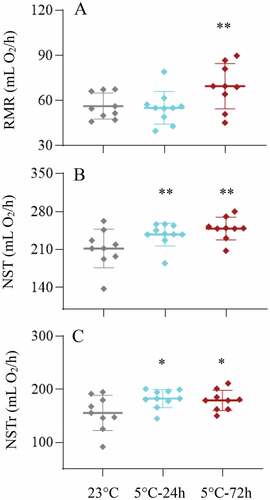
The RMR of Cold-24 h hamsters did not significantly differ from that of the hamsters kept at 23°C, whereas that of Cold-72 h hamsters was significantly higher than of Con hamsters (23.7%, F2,24 = 5.81, P < 0.01, ). NST was significantly different among the three groups, and that of Cold-24 h and Cold-72 h hamsters had 12.2% and 17.4% higher than that of 23°C group (F2,24 = 5.84, P < 0.01, ). Consistently, NSTr of Cold-24 h and Cold-72 h hamsters was significantly higher than that of 23°C group (F2,24 = 3.66, P < 0.05, ).
Figure 3. Resting metabolic rate (RMR, a) and non-shivering thermogenesis (NST, b) and regular NST (NSTr, C) in striped hamsters subjected to repeated cold (5°C) and warm (23°C) temperature cycles. 23 oC, animals maintained at room temperature (23°C) throughout the experiment. Cold-24 h and Cold-72 h, animals exposed to 6 cold and warm temperature cycles (24 h at 5°C followed by 6 days at 23°C, and 72 h at 5°C followed by 4 days at 23°C) from the 2nd to 7th week of the experiment. Data are means ± SD with individual data points; *P < 0.05, **P < 0.01.
2.5. Fat deposition
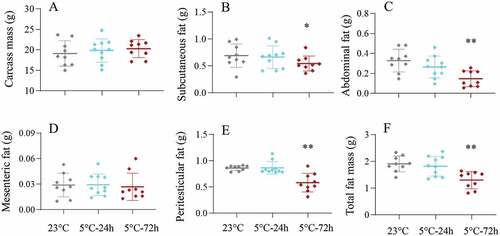
There was no significant difference in the carcass mass among the three groups (F2,25 = 0.43, P > 0.05, ). Cold-24 h hamsters did not significantly differ in subcutaneous fat or abdominal fat mass from the 23°C group, whereas cold-72 h hamsters had 21.1% and 55.4% less subcutaneous fat and abdominal fat, respectively, than the 23°C groups (subcutaneous fat, F2,24 = 5.67, P < 0.05, ; abdominal fat, F2,24 = 17.54, P < 0.01, ). The mesenteric fat mass was not significantly different among the three groups (F2,24 = 0.13, P > 0.05, ). There was no significant difference in the peritesticular fat or total body fat mass between the Cold-24 h and 23°C groups, but the cold-72 h group showed 32.3% and 32.5% less peritesticular fat and total body fat mass, respectively, than the 23°C groups (peritesticular fat, F2,24 = 16.02, P < 0.01, ; total fat mass, F2,24 = 25.73, P < 0.01, ).
Figure 4. Mass of carcass (a), subcutaneous fat (b), abdominal fat (c), mesenteric fat (d), peritesticular fat (e) and total body fat (f), in striped hamsters subjected to repeated cold (5°C) and warm (23°C) temperature cycles. 23 oC, animals maintained at room temperature (23°C) throughout the experiment. Cold-24 h and Cold-72 h, animals exposed to 6 cold and warm temperature cycles (24 h at 5°C followed by 6 days at 23°C, and 72 h at 5°C followed by 4 days at 23°C) from the 2nd to 7th week of the experiment. Data are means ± SD with individual data points; *P < 0.05, **P < 0.01.
2.6. Organs mass
Liver mass was significantly different among the three groups, and that of Cold-24 h and Cold-72 h groups were higher by 19.4% and 18.3% than that of 23°C group (). Consistently, the Cold-24 h and Cold-72 h groups had significantly heavier heart and kidneys than 23°C group (). The stomach mass did not significantly differ among the three groups, whereas the mass of small and large, and caecum were significantly higher in either Cold-24 h or Cold-72 h group, than that of 23°C group (). The mass of total gastrointestinal tracts of the Cold-24 h and Cold-72 h groups was higher by 12.6% and 18.0% than that of 23°C group ().
Table I. Body composition of striped hamsters subjected to cold and warm temperature cycles
There were significantly positive correlations between RMR and liver and lung mass (supplementary materials, Figure S1A and S1B). NST was positively correlated with the mass of liver, heart, and kidneys (Figure S1F, S1G and S1J). The gastrointestinal tracts were positively correlated with RMR (Figure S2). For example, significantly positive correlations were observed between RMR and small intestine (Figure S2B), and between NST and small, caecum, and total tracts (Figure S2G, S2I, and S2J), as well as between NSTr and total tracts (Figure S2O).
2.7. Serum T3 and T4, and leptin concentrations
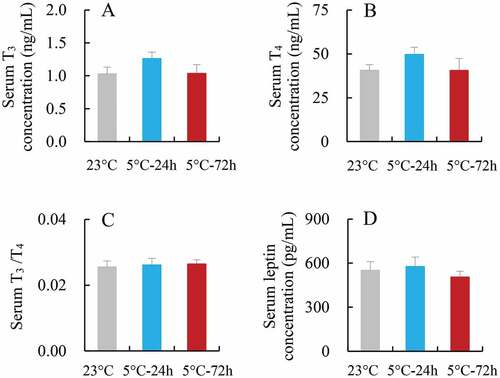
Neither serum T3 nor T4 concentration differed significantly among the three groups (T3, F2,25 = 1.37, P > 0.05, ; T4, F2,25 = 1.17, P > 0.05, ). The ratio of T3/T4 was also not statistically different among the three groups (F2,25 = 0.06, P > 0.05, ). Serum leptin concentration did not differ significantly among the 23°C, 5°C-24 h and 5°C-72 h groups (F2,21 = 0.43, P > 0.05, ). There were no significant correlations between metabolic thermogenesis (RMR, NST and NSTr) and serum T3 or T4 concentrations (8(a)-(f)).
Figure 5. Serum T3 (a) and T4 concentration (b), and the ratio of T3/T4 (c), and serum leptin concentration (d) in striped hamsters subjected to repeated cold (5°C) and warm (23°C) temperature cycles. 23 oC, animals maintained at room temperature (23°C) throughout the experiment. Cold-24 h and Cold-72 h, animals exposed to 6 cold and warm temperature cycles (24 h at 5°C followed by 6 days at 23°C, and 72 h at 5°C followed by 4 days at 23°C) from the 2nd to 7th week of the experiment. Data are means ± s.e.m.
2.8. Neuropeptides mRNA expression of hypothalamus
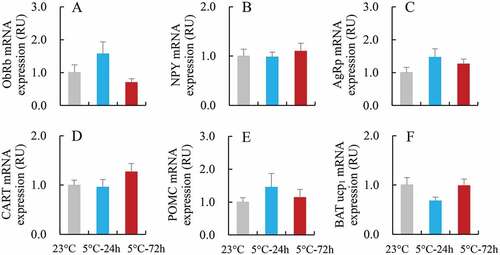
The ObRb mRNA expression of hypothalamus was not significantly different among the 23°C, 5°C-24 h and 5°C-72 h groups (F2,21 = 2.81, P > 0.05, ). Neither the orexigenic peptide nor anorexigenic peptide were significantly different among the three groups (NPY, F2,21 = 0.22, P > 0.05, ; AgRP, F2,21 = 1.36, P > 0.05, ; CART, F2,21 = 1.30, P > 0.05, ; POMC, F2,21 = 0.62, P > 0.05, ).
Figure 6. The mRNA expression of neuropeptides of hypothalamus and of BAT UCP1 in striped hamsters subjected to repeated cold (5°C) and warm (23°C) temperature cycles. (a) Long isoform of leptin receptor, ObRb; (b) Neuropeptide Y, NPY; (c) agouti-related protein, AgRP; (d) cocaine- and amphetamine-regulated transcript, CART; (e) pro-opiomelanocortin, POMC; (f) uncoupling protein 1 of brown adipose tissue, BAT UCP1. in striped hamsters subjected to repeated cold (5°C) and warm (23°C) temperature cycles. 23 oC, animals maintained at room temperature (23°C) throughout the experiment. Cold-24 h and Cold-72 h, animals exposed to 6 cold and warm temperature cycles (24 h at 5°C followed by 6 days at 23°C, and 72 h at 5°C followed by 4 days at 23°C) from the 2nd to 7th week of the experiment. Data are means ± s.e.m.
2.9. BAT UCP1 mRNA and protein expression
BAT UCP1 mRNA expression did not significantly differ among the three groups (F2,21 = 2.15, P > 0.05, ). BAT UCP1 protein expression of Cold-24 h and Cold-72 h was increased by 29% and 34%, respectively, compared to that of 23°C group (F2,25 = 8.36, P < 0.01, ), whereas the difference between Cold-24 h and Cold-72 h was not statistically significant (post hoc, P > 0.05). BAT UCP1 expression was not significantly correlated to RMR (), whereas it was positively correlated to NST and NSTr () and (I)).
Figure 7. The protein expression of uncoupling protein 1 of brown adipose tissue (BAT UCP1) in striped hamsters subjected to repeated cold (5°C) and warm (23°C) temperature cycles. 23 oC, animals maintained at room temperature (23°C) throughout the experiment. Cold-24 h and Cold-72 h, animals exposed to 6 cold and warm temperature cycles (24 h at 5°C followed by 6 days at 23°C, and 72 h at 5°C followed by 4 days at 23°C) from the 2nd to 7th week of the experiment. Data are means ± s.e.m. ** P<0.01.
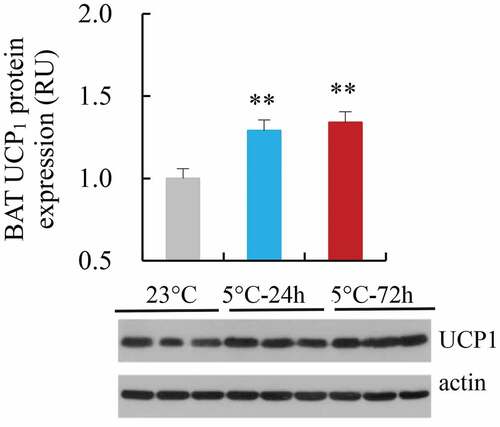
Figure 8. Relationships between metabolic thermogenesis and serum T3 (a-c: RMR, NST and NSTr) and T4 concentrations (d-f: RMR, NST and NSTr), and BAT UCP1 expression (g-i: RMR, NST and NSTr) in striped hamsters subjected to repeated cold (5°C) and warm (23°C) temperature cycles. Data are plotted; *, the significant correlations (P < 0.05).
3. Discussion
An increase in thermogenic capability is important in many small mammals to cope with cold conditions in seasonal environments because it may allow an increase in survival (Nespolo et al. Citation2001b). A considerable enhancement of metabolic thermogenesis, including RMR and NST, has been observed in a variety of animals acclimated to cold or winter like conditions, such as Mongolian gerbils (Meriones unguiculatus), desert spiny mice (Acomys russatus), naked mole-rats (Heterocephalus glaber), degu (Octodon degu), leaf-eared mice (Phyllotis darwin), common spiny mice (Acomys cahirinus), golden hamsters (Mesocricetus auratus) and plateau pikas (Ochotona curzoniae) (Kronfeld-Schor et al. Citation2000; Wang et al. Citation2000, Citation2003, Citation2006; Nespolo et al. Citation2001a; Woodley & Buffenstein Citation2002; Scantlebury et al. Citation2003; Jefimow et al. Citation2004b). In this study, we observed that both RMR and NST were significantly increased in striped hamsters exposed to repeated cycles of short-term cold (5°C, 72 h)- warm (23°C, 4 days) temperatures. This was consistent with the animals that were consistently exposed or acclimated to seasonal cold temperatures. Interestingly, here we found that NST were considerably increased, whereas RMR did not differ significantly, in the striped hamsters subjected to cycles of acute cold (5°C, 24 h)- warm (23°C, 6 days) temperatures. According to Degen (Citation1997), lower RMR and high capacity for NST allow rodents a low metabolic heat production during activity and permit them to increase heat production quickly under cool-to-cold conditions (Nespolo et al. Citation2001a, Citation2001b). Thus, thermogenic capacity can change quickly through modifications of NST in response to environmental cues (Stearns Citation1989, Citation1992; Nespolo et al. Citation2001a, Citation2001b).
Consistent with the change in NST, in this study BAT UCP1 expression was significantly increased in the striped hamsters subjected to repeated cycles of cold and warm temperatures. It is well known that BAT UCP1 expression regulates the flux of protons through the ATP synthase, being increased by cold acclimation in many small mammals (Silva & Rabelo Citation1997; Nedergaard et al. Citation2001; Lannia et al. Citation2003; Wang et al. Citation2006; Zhang & Wang Citation2006). This indicates that the NST mediated by BAT UCP1 is possibly general physiological regulation in a diversity of mammals in response to cold environments (Nedergaard et al. Citation2001). It has been suggested that both BAT and muscle-based NST play important roles in temperature homeostasis, and the both thermogenesis processes are equally recruited during mild and severe cold adaptation (Bal et al. Citation2017a, Citation2017b). In addition, these two thermogenic processes functionally interplay in some situation, i.e. loss of heat production from one thermogenic pathway leads to increased recruitment of the other (Bal et al. Citation2017a, Citation2017b). In this study, the markers that are indicative of skeletal muscle thermogenesis were unfortunately measured in these striped hamsters, thus we could not distinguish BAT-based NST from the muscle-based NST, suggesting that the both may contribute to the increased metabolic thermogenesis in striped hamsters exposed to repeated cycles of short-term cold-warm temperatures.
Thyroid hormones are active regulators of basal or resting metabolic rate, and energy expenditure by a number of mechanisms (Freake & Oppenheimer Citation1995; Silva Citation1995, Citation2001; Zaninovich et al. Citation2002), and it is also essential to initiate BAT thermogenesis, because triiodothyronine (T3) potentiates the action of norepinephrine on UCP1 gene transcription (Bianco et al. Citation1988; Silva Citation1988; Zaninovich et al. Citation2002). These findings suggest that thyroid hormones are required for increased thermogenic capacity to occur as an adaptation to long-term cold exposure, and this has been observed in many small rodents acclimated to cold winter conditions (Freake & Oppenheimer Citation1995; Silva & Rabelo Citation1997; Goglia et al. Citation2002; Lannia et al. Citation2003). Unexpectedly, we did not find significant changes in either serum T3 or T4 concentrations in the striped hamsters subjected to repeated cycles of cold and warm temperatures. Consistently, BAT-mediated thermogenesis, and UCP1 mRNA and protein expression was markedly increased in cold-exposed hypothyroid rats to levels, similar to those seen in cold-exposed normal rats (Rattus norvegicus) (Zaninovich et al. Citation2002). The findings of this study suggests that THs may be not involved in BAT thermogenesis of animals that were frequently subjected to cycles of cold-warm temperature. As described above, both BAT and muscle-based NST are recruited in response to cold adaptation, and a functional interplay between these two thermogenic processes (Bal et al. Citation2017a, Citation2017b). The findings of this study provide weak evidence for the THs-mediated BAT thermogenesis in response to cycles of cold-warm temperature, but may suggests alternate thermogenic mechanisms beyond BAT in these hamsters which needs careful consideration for proving the fact that despite increase in UCP1 expression.
The basal or resting metabolic rate is usually reported estimate of energy expenditure in endotherms (McNab Citation2019), and that of mammals is best explained by body mass, and is also interpreted as reflecting the size and metabolic intensity of energy-consuming tissues (Meerlo et al. Citation1997). In this study, we observed that RMR was positively correlated with the mass of liver and lung, and in particular, small intestine in striped hamsters subjected to cycles of cold and warm temperatures. In addition, NST was significantly correlated with the mass of liver, heart, and kidneys, as well as, gastrointestinal tracts. The increased metabolic thermogenesis of the animals acclimated to cold conditions is usually compensated by the elevation in energy intake (Zhao Citation2011; Francis & Ebling Citation2015; Deem et al. Citation2020). Consistently, in the present study the striped hamsters showed considerably higher gross and digestive energy intake during the period of cold exposure. Interestingly, the hamsters that were subjected to 72 h cold and warm cycle also consumed significantly more food after they returned to the warm temperature than those kept at warm condition, which may be exploited to meet the energy requirement of increased RMR. Similarly, the Brandt’s voles (Lasiopodomys brandtii) increased energy intake during the cold acclimation, which was still higher than that in the control in the two weeks of rewarming (Zhang & Wang Citation2006). However, in this study, serum leptin concentration and the gene expression of ObRb in hypothalamus were not significantly different in the hamsters that were frequently subjected to cycles of cold-warm temperature compared to that of controls. Neither anorexigenic peptides nor orexigenic peptides gene expression was significantly changed flowing cycles of cold-warm temperature, suggesting that leptin pathway may be not involved in regulations of energy budgets of striped hamsters acclimated to cold-warm cycles. In addition to energy intake, we observed that the hamsters subjected to 72 h cold and warm cycle showed significantly less fat deposition than the control hamsters. This indicates that the fat depots are likely mobilized by the animals to cope with the next episode.
4. In conclusion
Both RMR and NST were significantly increased in striped hamsters subjected to repeated cycles of short-term cold (5°C, 72 h)- warm (23°C, 4 days) temperatures compared to that of the hamsters kept at 23°C. In these cycled hamsters, BAT UCP1 expression was significantly upregulated, whereas serum T3 and T4 did not changed significantly. It suggests that BAT thermogenesis of animals that were frequently subjected to cycles of cold-warm temperature could not be mediated by thyroid hormone.
5. Materials and methods
5.1. Animals
The striped hamsters used in experiments were the offspring of a colony at Wenzhou University that was founded with animals trapped in farmland in the center of Hebei province (115u139E, 38u129S) on the North China Plain in 2008. A randomized outbreeding protocol is used to maintain genetic diversity. Animals were housed individually in plastic cages (29 cm × 18 cm × 16 cm) with sawdust bedding, and kept at 23 ± 1°C under a 12 h:12 h (light: dark, lights on at 08:00 h) photoperiod. Food (standard rodent chow; produced by Beijing KeAo Feed Co., Beijing, China) and water were provided ad libitum.
Twenty-eight male striped hamsters (3–3.5 months of age) were randomly assigned into one of three groups: a control group (23°C, n = 9) which was kept at 23°C throughout this experiment, and two cold-warm cycle treatment groups (5°C-24 h, n = 10 and 5°C-72 h, n = 9) which were transferred into a cold room (5°C) for 24 h and 72 h, respectively, followed by six and four days of warm (23°C) temperature. The alternating cold-warm temperature cycle was repeated for 6 weeks. All three groups were fed ad libitum with the diet with a calorific value of 22.0 kJ/g (Research Diet, D12492, USA) for the duration of the experiment (60% fat, 20% carbohydrate and 20% protein).
5.2. Body mass and food intake
At the beginning of the experiment, animals were weighed on a daily basis to the nearest 0.1 g to establish their baseline body mass in the first week. Food intake was also measured daily during these baseline measurements. Food intake was calculated from the difference between the food provided and the uneaten food on the next day, minus food residues mixed with bedding material (Xu et al. Citation2019).
5.3. Energy intake and digestibility
Gross energy intake (GEI) and digestibility were measured during the 6th cold-warm temperature cycle at 5°C and 23°C, respectively. As described by Deng et al. (Citation2020), a known quantity of food was provided and any uneaten food and orts in bedding material were collected 24 h later. Food and feces were separated manually after drying to a constant mass at 60°C. The gross energy content of feces was determined with an IKA C2000 oxygen bomb calorimeter (IKA, Germany). GEI, digestive energy intake (DEI), gross energy of feces (GEF) and digestibility were calculated as follows (Grodzinski & Wunder Citation1975; Yu et al. Citation2020),
5.4. Resting metabolic rate (RMR) and non-shivering thermogenesis (NST)
RMR was estimated from the rate of oxygen consumption, which was measured with an open-flow respirometry system (TSE systems, PhenoMaster/ LabMaster, Germany) at the end of the 6th cold-warm cycle. As described by Wen et al. (Citation2018a, Citation2018b), air was pumped through a cylindrical, sealed, Perspex chamber (35 cm in length and 8 cm in diameter) at a rate of 1000 mL/min at a temperature of 30 ± 0.5°C, which is within the thermal neutral zone of the striped hamster (Zhao et al. Citation2010b). Gases leaving the chamber were dried and directed through the oxygen analyzer at a flow rate of 380 mL/min. Data were collected every 10s by a computer connected via an analogue-to-digital converter, and analyzed using standard software (TSE). RMR was measured for 3 h, and was calculated from the consecutive minimum rate of oxygen consumption over 10 min, corrected to standard temperature and air pressure conditions (STAP), and expressed as mL O2/h per animal (Zhao et al. Citation2020).
The NST was estimated from the maximum rate of oxygen consumption, induced by the subcutaneous injection of a dose of norepinephrine proportional to the body weight of each animal (Heldmaier Citation1971; Zhao et al. Citation2010a). Dosages were calculated with the formula: NE (mg/kg) = 6.6× Mb–0.458 (g) (Heldmaier Citation1971). NST was measured for 60 min at 25 ± 1°C using the same method as RMR. The consecutive maximum rate of oxygen consumption over 10 min were used to calculate NST, which was corrected to SATP conditions and expressed as mL O2/h. The regulated NST (NSTr) was calculated from the difference between NST and RMR (NSTr = NST-RMR).
5.5. Body composition
Animals were euthanized by decapitation the day after NST measurements. Scapular BAT and hypothalamus were removed and weighed carefully and quickly, frozen in liquid nitrogen and stored at −80°C until required for analysis. Subcutaneous fat, perirenal fat, mesenteric fat and abdominal fat (but not periovarian fat), were collected and weighed (to ±1 mg). Total body fat was the sum of the above fat deposits. Liver, heart, lung, spleen, and kidneys were collected and weighed separately (to ±1 mg). in addition, stomach, small and large intestine, and caecum were removed separately and weight without the contents (to ±1 mg).
5.6. Real-time RT–qPCR analysis
The mRNA expression of agouti-related protein (AgRP), cocaine- and amphetamine-regulated transcript (CART), neuropeptide Y (NPY), and pro-opiomelanocortin (POMC) of hypothalamus, and BAT UCP1, were measured using real-time RT–qPCR analysis. Total RNA of hypothalamus was extracted using TRIzol Reagent (TAKARA, Dalian, China). As described previously (Xu et al. Citation2019), cDNA was synthesized in a final reaction volume of 50 µL with random primer oligo (dT)18 and AMV Reverse Transcriptase (TAKARA). 2 µL cDNA samples were taken for the subsequent PCR reaction using gene–specific primers (). The final reaction volume of 20 µL contained 10 µL of 2 × SYBR Premix EX Tag TM (TAKARA), 0.4 µL of forward prime and reverse primer (final concentration 0.2 µM per primer), 2 µL cDNA template and 7.2 µL DEPC H2O. qPCR was performed using Roche Light Cycler480II real–time qPCR system. Actin was used as an internal standard. Samples were quantified for relative quantity of gene expression (Zhao et al. Citation2014; Xu et al. Citation2019).
Table II. Gene-specific primer sequences used for real-time RT-qPCR analysis
5.7. Western blot analysis of UCP1
BAT was lysed in RIPA buffer (0.5% NP-40, 0.1% sodium deoxycholate, 150 mM NaCl, 50 mM Tris-HCl [pH 7.5]) supplemented with phosphatase inhibitor cocktails. Protein extracts were diluted in 5× sample buffer (50 mM Tris at pH 6.8, 2% SDS, 10% glycerol, 5% β-mercaptoethanol, and 0.1% bromophenol blue) separated on a discontinuous SDS-polyacrylamide gel (12% running gel and 5% stacking gel) and then transferred onto a PVDF membrane (millipore, IPVH00010). The blotting membranes were blocked with 5% (wt/vol) milk powder and incubated overnight at 4°C with the primary antibody β-actin (Servicebio GB12001) and UCP1 (proteintech 23673-1-AP). Secondary antibody (anti-rabbit IgG HRP conjugate; 1:3,000; Servicebio GB23303) was then added, and Super Signal Western blot Enhancer (Thermo Scientific) used to visualize protein bands. Blots were analyzed with Bio-Rad Quantity One and normalized to β-actin.
5.8. Serum tri-iodothyronine (T3), thyroxine (T4), and leptin concentration
The trunk blood collected from each animal, and serum was separated from each blood sample and stored at −80°C until required for analysis. Serum T3 and T4 levels were determined by radioimmunoassay using I125 RIA kits (Beijing North Institute of Biological Technology, Beijing, China); the intra- and inter-assay coefficients of variation were 2.4% and 8.8% for T3, and 4.3% and 7.6% for T4. Serum leptin concentrations were determined using a commercial leptin (hamster) ELISA kit (Fine Biotech Co., Ltd., Wuhan, China). This kit is validated for striped hamsters according to the standard curve. The lower limit of the assay kit is 7.8 pg/mL, and the intra- and inter-assay coefficients of variation are 8% and 10%.
5.9. Statistical analysis
Data were analyzed using SPSS statistical software (version 20.0) after all variables were first confirmed to be normally distributed by a Kolmogorov–Smirnov test. The statistical significance of differences in body mass, food intake, RMR, NST, energy intake, digestibility, body composition, BAT UCP1 mRNA and protein expression, neuropeptides mRNA expression of hypothalamus, and serum T3, T4 and leptin among the 23°C, 5°C-24 h and 5°C-72 h groups were assessed using one-way ANOVA or ANCOVA, with body mass as a covariate. We also run a model of correlation analysis and linear regression analysis between RMR, NST and body composition, and T3 and T4 concentration. Data are presented as means ± s.e.m, or individual data points with means ± SD. All tests are two-tailed and P-values < 0.05 were considered statistically significant.
Supplemental Material
Download PNG Image (283.4 KB)
Supplemental Material
Download PNG Image (263.8 KB)
Disclosure statement
No potential conflict of interest was reported by the author(s).
Supplementary material
Supplemental data for this article can be accessed here.
Additional information
Funding
References
- Bal NC, Maurya SK, Pani S, Sethy C, Banerjee A, Das S, Patnaik S, Kundu CN. 2017a. Mild cold induced thermogenesis: Are BAT and skeletal muscle synergistic partners? Bioscience Reports 37(5):BSR20171087. DOI: 10.1042/BSR20171087.
- Bal NC, Singh S, Reis FCG, Maurya SK, Pani S, Rowland LA, Periasamy M. 2017b. Both brown adipose tissue and skeletal muscle thermogenesis processes are activated during mild to severe cold adaptation in mice. Journal of Biological Chemistry 292(40):16616–16625. DOI: 10.1074/jbc.M117.790451.
- Bianco AC, Sheng X, Silva JE. 1988. Triiodothyronine amplifies norepinephrine stimulation of uncoupling protein gene transcription by a mechanism not requiring protein synthesis. Journal of Biological Chemistry 263:18168–18175. DOI: 10.1016/S0021-9258(19)81340-6.
- Bozinovic F. 1992. Scaling of basal and maximum metabolic rate in rodents and the aerobic capacity model for the evolution of endothermy. Physiological and Biochemical Zoology 65:921–932.
- Bozinovic F, Rosenmann M. 1989. Maximum metabolic rate of rodents: Physiological and ecological consequences on distribution limits. Functional Ecology 3:173–181. DOI: 10.2307/2389298.
- Cannon B, Nedergaard J. 2004. Brown adipose tissue: Function and physiological significance. Physiological Reviews 84(1):277–359. DOI: 10.1152/physrev.00015.2003.
- Deem JD, Faber CL, Pedersen C, Phan BA, Larsen SA, Ogimoto K, Nelson JT, Damian V, Tran MA, Palmiter RD, Kaiyala KJ, Scarlett JM, Bruchas MR, Schwartz MW, Morton GJ. 2020. Cold-induced hyperphagia requires AgRP neuron activation in mice. Elife 9:e58764. DOI: 10.7554/eLife.58764.
- Degen A. 1997. Ecophysiology of small desert mammals. 1st ed. Berlin: Springer Verlag. pp. 296.
- Deng GM, Yu JX, Xu JQ, Bao YF, Chen Q, Cao J, Zhao ZJ. 2020. Exposure to artificial wind increases energy intake and reproductive performance of female Swiss mice (Mus musculus) under hot temperature. Journal of Experimental Biology 223:231415. DOI: 10.1242/jeb.231415.
- Even PC, Rolland V, Roseau S, Bouthegourd JC, Tomé D. 2001. Prediction of basal metabolism from organ size in the rat: Relationship to strain, feeding, age, and obesity. American Journal of Physiology 280(6):R1887–1896. DOI: 10.1152/ajpregu.2001.280.6.R1887.
- Francis JP, Ebling. 2015. Hypothalamic control of seasonal changes in food intake and body weight. Frontiers in Neuroendocrinology 37:97–107. DOI: 10.1016/j.yfrne.2014.10.003.
- Freake HC, Oppenheimer JH. 1995. Thermogenesis and thyroid function. Annual Review of Nutrition 15:263–291. DOI: 10.1146/annurev.nu.15.070195.001403.
- Friedman JM, Halaas JL. 1998. Leptin and the regulation of body weight in mammals. Nature 395:763–770. DOI: 10.1038/27376.
- Goglia F, Silvestri E, Lanni A. 2002. Thyroid hormones and mitochondria. Bioscience Reports 22(1):17–32. DOI: 10.1023/A:1016056905347.
- Grodzinski W, Wunder BA. 1975. Ecological energetics of small mammals. In: Golley FB, Petrusewicz K, Ryszkowski L, editors. Small mammals: Their productivity and population dynamics. Cambridge: Cambridge University Press. pp. 173–204.
- Haim A, Izhaki L. 1993. The ecological significance of resting metabolic rate and non-shivering thermogenesis for rodents. Journal of Thermal Biology 18:71–91. DOI: 10.1016/0306-4565(93)90019-P.
- Haim A, Zisapel N. 1999. Daily rhythms of nonshivering thermogenesis in common spiny mice Acomys cahirinus, under short and long photoperiods. Journal of Thermal Biology 24:455–459. DOI: 10.1016/S0306-4565(99)00055-8.
- Heldmaier G. 1971. Nonshivering thermogenesis and body size in mammals. Journal of Comparative Physiology 73:222–248.
- Heldmaier G, Klaus S, Wiesinger H. 1990. Seasonal adaptation of thermoregulatory heat production in small mammals. In: Bligh J, Voigt K, editors. Thermoreception and temperature regulation. Berlin: Springer. pp. 235–243.
- Hinds DS, Baudinette RV, MacMillen RE, Halpern EA. 1993. Maximum metabolism and the aerobic factorial scope of endotherms. Journal of Experimental Biology 182:41–56. DOI: 10.1242/jeb.182.1.41.
- Jansky L. 1973. Non-shivering thermogenesis and its thermoregulatory significance. Biological Reviews 48:85–132. DOI: 10.1111/j.1469-185X.1973.tb01115.x.
- Jefimow M. 2007. Effects of summer- and winter-like acclimation on the thermoregulatory behavior of fed and fasted desert hamsters. Journal of Thermal Biology 32:212–219. DOI: 10.1016/j.jtherbio.2007.01.002.
- Jefimow M, Wojciechowski M, Tegowska E. 2004a. Seasonal and daily changes in the capacity for nonshivering thermogenesis in the golden hamsters housed under semi-natural conditions. Comparative Biochemistry and Physiology Part A 137(2):297–309. DOI: 10.1016/j.cbpb.2003.10.008.
- Jefimow M, Wojciechowski M, Tegowska E. 2004b. Seasonal changes in the thermoregulation of laboratory golden hamsters during acclimation to seminatural outdoor conditions. Comparative Biochemistry and Physiology Part A 39(3):379–388. DOI: 10.1016/j.cbpb.2004.10.007.
- Kennedy GC. 1953. The role of depot fat in the hypothalamic control of food intake in the rat. Proceedings of the Royal Society B 140:578–592.
- Kim B. 2008. Thyroid hormone as a determinant of energy expenditure and the basal metabolic rate. Thyroid 18(2):141–144. DOI: 10.1089/thy.2007.0266.
- Kronfeld-Schor N, Haim A, Dayan T, Zisapel N, Klingenspor M, Heldmaier G. 2000. Seasonal thermogenic acclimation of diurnally and nocturnally active desert spiny mice. Physiological and Biochemical Zoology 73:37–44. DOI: 10.1086/316718.
- Lannia A, Morenob M, Lombardic A, Gogliab F. 2003. Thyroid hormone and uncoupling proteins. FEBS Letters 543:5–10. DOI: 10.1016/S0014-5793(03)00320-X.
- Li L, Li B, Li M, Speakman JR. 2019. Switching on the furnace: Regulation of heat production in brown adipose tissue. Molecular Aspects of Medicine 68:60–73. DOI: 10.1016/j.mam.2019.07.005.
- Lisboa PC, Oliveira KJ, Cabanelas A, Ortiga-Carvalho TM, Pazos-Moura CC. 2003. Acute cold exposure, leptin, and somatostatin analog (octreotide) modulate thyroid 5’-deiodinase activity. American Journal of Physiology Endocrinology and Metabolism 284(6):E1172–6. DOI: 10.1152/ajpendo.00513.2002.
- Lovegrove BG. 2003. The influence of climate on the basal metabolic rate of small mammals: A slow-fast metabolic continuum. Journal of Comparative Physiology B 173(2):87–112. DOI: 10.1007/s00360-002-0309-5.
- McNab BK. 2019. What determines the basal rate of metabolism? Journal of Experimental Biology 222:jeb205591. DOI: 10.1242/jeb.205591.
- Meerlo P, Bolle L, Visser GH, Masman D, Daan S. 1997. Basal metabolic rate in relation to body composition and daily energy expenditure in the field vole, Microtus agrestis. Physiological and Biochemical Zoology 70(3):362–369.
- Nedergaard J, Golozoubova V, Matthias A, Asadi A, Jacobsson A, Cannon B. 2001. UCP1: The only protein able to mediate adaptive non-shivering thermogenesis and metabolic inefficiency. Biochimica et Biophysica Acta 1504(1):82–106. DOI: 10.1016/S0005-2728(00)00247-4.
- Nespolo RF, Bacigalupe LD, Rezende EL, Bosinovic F. 2001b. When non-shivering thermogenesis equals maximum metabolic rate: Thermal acclimation and phenotypic plasticity of fossorial Spalacopus cyanus (Rodentia). Physiological and Biochemical Zoology 74:325–332. DOI: 10.1086/320420.
- Nespolo RF, Opazo JC, Bozinovic F. 2001a. Thermal acclimation and non-shivering thermogenesis in three species of South American rodents: A comparison between arid and mesic habitats. Journal of Arid Environments 48:581–590. DOI: 10.1006/jare.2000.0778.
- Nicholls DG. 1976. The bioenergetics of brown adipose tissue mitochondria. FEBS Letters 61(2):103–110. DOI: 10.1016/0014-5793(76)81014-9.
- Park HK, Ahima RS. 2014. Leptin signaling. F1000prime Reports 6:73. DOI: 10.12703/P6-73.
- Scantlebury M, Shanasa U, Kupshteina H, Afika D, Haima A. 2003. Non-shivering thermogenesis in common spiny mice Acomys cahirinus from adjacent habitats: Response to seasonal acclimatization and salinity acclimation. Journal of Thermal Biology 28:287–293. DOI: 10.1016/S0306-4565(03)00005-6.
- Silva JE. 1988. Full expression of uncoupling protein gene requires the concurrence of norepinephrine and triiodothyronine. Molecular Endocrinology 2:706–713. DOI: 10.1210/mend-2-8-706.
- Silva JE. 1995. Thyroid hormone control of thermogenesis and energy balance. Thyroid 5:481–492. DOI: 10.1089/thy.1995.5.481.
- Silva JE. 2001. The multiple contributions of thyroid hormone to heat production. Journal of Clinical Medicine 108:35–37.
- Silva JE. 2011. Physiological importance and control of non-shivering facultative thermogenesis. Frontiers in Bioscience-Scholar 3:352–371. DOI: 10.2741/s156.
- Silva JE, Rabelo R. 1997. Regulation of the uncoupling protein gene expression. European Journal of Endocrinology 136(3):251–264. DOI: 10.1530/eje.0.1360251.
- Song ZG, Wang DH. 2003. Metabolism and thermoregulation in the striped hamster Cricetulus barabensis. Journal of Thermal Biology 28:509–514. DOI: 10.1016/S0306-4565(03)00051-2.
- Stearns S. 1989. The evolutionary significance of phenotypic plasticity. BioScience 39:436–445. DOI: 10.2307/1311135.
- Stearns S. 1992. The evolution of life histories. 1st ed. New York: Oxford University Press. pp. 249.
- Terrien J, Ambid L, Nibbelink M, Saint-Charles A, Aujard F. 2010. Non-shivering thermogenesis activation and maintenance in the aging gray mouse lemur (Microcebus murinus). Experimental Gerontology 45(6):442–448.
- Wang DH, Wang YS, Wang ZW. 2000. Metabolism and thermoregulation in the Mongolian gerbil Meriones unguiculatus. Acta Theriologica 45:183–192. DOI: 10.4098/AT.arch.00-21.
- Wang DH, Wang ZW, Wang YS, Yang JC. 2003. Seasonal changes of thermogenesis in Mongolian gerbils (Meriones unguiculatus) and Brandt’s voles (Microtus brandti). Comparative Biochemistry and Physiology Part A 134:S96.
- Wang JM, Zhang YM, Wang DH. 2006. Seasonal thermogenesis and body mass regulation in plateau pikas (Ochotona curzoniae). Oecologia 149:373–382. DOI: 10.1007/s00442-006-0469-1.
- Wen J, Tan S, Qiao QG, Shi LL, Huang YX, Zhao ZJ. 2018b. The strategies of behavior, energetic and thermogenesis of striped hamsters in response to food deprivation. Integrative Zoology 13:70–83. DOI: 10.1111/1749-4877.12259.
- Wen J, Tan S, Wang DH, Zhao ZJ. 2018a. Variation of food availability affects male striped hamsters (Cricetulus barabensis) with different levels of metabolic rate. Integrative Zoology 13:769–782. DOI: 10.1111/1749-4877.12337.
- Woodley R, Buffenstein R. 2002. Thermogenic changes with chronic cold exposure in the naked mole-rat (Heterocephalus glaber). Comparative Biochemistry and Physiology Part A 133(3):827–834. DOI: 10.1016/S1095-6433(02)00199-X.
- Xu JQ, Xu XM, Bi ZQ, Shi LL, Cao J, Zhao ZJ. 2019. The less weight loss due to modest food restriction drove more fat accumulation in striped hamsters refed with high-fat diet. Hormones and Behavior 110:19–28. DOI: 10.1016/j.yhbeh.2019.02.010.
- Yu JX, Deng GM, Xu JQ, Cao J, Zhao ZJ. 2020. The energy budget and fat accumulation in striped hamsters (Cricetulus barabensis) during post-lactation. Comparative Biochemistry and Physiology Part A 249:110755. DOI: 10.1016/j.cbpa.2020.110755.
- Zaninovich AA. 2001. Thyroid hormones, obesity and brown adipose tissue thermogenesis. Medicina (B Aires) 61(1):597–602.
- Zaninovich AA, Raíces M, Rebagliati I, Ricci C, Hagmüller K. 2002. Brown fat thermogenesis in cold-acclimated rats is not abolished by the suppression of thyroid function. American Journal of Physiology 283:E496–E502. DOI: 10.1152/ajpendo.00540.2001.
- Zhang XY, Wang DH. 2006. Energy metabolism, thermogenesis and body mass regulation in Brandt’s voles (Lasiopodomys brandtii) during cold acclimation and rewarming. Hormones and Behavior 50(1):61–69. DOI: 10.1016/j.yhbeh.2006.01.005.
- Zhang ZB, Wang ZW. 1998. Ecology and management of Rodent Pests in agriculture. Beijing: Ocean Publishing House.
- Zhao ZJ. 2011. Serum leptin, energy budget and thermogenesis in striped hamsters exposed to consecutive decrease in ambient temperatures. Physiological and Biochemical Zoology 84(6):560–572. DOI: 10.1086/662553.
- Zhao ZJ, Cao J, Liu ZC, Wang GY, Li LS. 2010a. Seasonal regulations of resting metabolic rate and thermogenesis in striped hamster (Cricetulus barabensis). Journal of Thermal Biology 35:401–405. DOI: 10.1016/j.jtherbio.2010.08.005.
- Zhao ZJ, Cao J, Meng XL, Li YB. 2010b. Seasonal variations in metabolism and thermoregulation in the striped hamster (Cricetulus barabensis). Journal of Thermal Biology 35:52–57. DOI: 10.1016/j.jtherbio.2009.10.008.
- Zhao ZJ, Chen KX, Liu YA, Wang CM, Cao J. 2014. Decreased circulating leptin and increased neuropeptide Y gene expression are implicated in food deprivation-induced hyperactivity in striped hamsters, Cricetulus barabensis. Hormones and Behavior 65:355–362. DOI: 10.1016/j.yhbeh.2014.03.001.
- Zhao ZJ, Hambly C, Shi LL, Bi ZQ, Cao J, Speakman JR. 2020. Late lactation in small mammals is a critically sensitive window of vulnerability to elevated ambient temperature. Proceedings of the National Academy of Sciences of the United States of America 117(39):24352–24358. DOI: 10.1073/pnas.2008974117.