
Abstract
In this study, lead (Pb) and cadmium (Cd) were used as chemical stressors. Healthy A. testudineus were exposed to Pb (20, 30, and 40 mg/L) and Cd (3, 5, and 10 mg/L) for 7, 14, 21, and 28 days to assess the response of A. testudineus elicited by these metals. The tendency of Pb and Cd accumulation in the tissues of A. testudineus was as follows: gill >> liver > muscle for Pb and liver >> gill > muscle for Cd. Endocrine stress response was characterized by varying the levels of cortisol and glucose plasma. Exposure to both Pb and Cd caused significantly increase levels of plasma cortisol (p < 0.05), while blood glucose levels slightly increased at the beginning and then decreased sharply. Based on the erratic changes in levels of plasma cortisol and blood glucose, it can be concluded that exposure to high concentrations of Pb and Cd does not cause death; however, it adversely affects the interrenal and pancreatic activities of A. testudineus. Biochemical changes can be used as biomarkers for stress assessment and management in fish.
1. Introduction
Alteration of genetic, physiological, biochemical, and behavioral parameters are serious risks posed by heavy metals to many aquatic organisms (Scott & Sloman Citation2004). Among aquatic organisms, fish are more susceptible to heavy metal contamination compared with other species (Alinnor Citation2005). The steroid hormone cortisol is released by activating the hypothalamic–pituitary–adrenal axis (HPI axis), which is widely distributed in the head kidneys of fish (Mommsen et al. Citation1999). When fish experience stress conditions, adrenocorticotropic hormone (ACTH) is secreted from the pituitary gland under the hypothalamus control (Fryer & Lederis Citation1986), which finally activates cortisol secretion by the interrenal tissue within the head kidneys (Mommsen et al. Citation1999). The characteristic response of fish to a variety of stressors is the stimulation/inhibition of cortisol secretion. Exposure to heavy metals and other toxic substances disrupts cortisol secretion in fish, and this disorder can affect other cortisol-dependent processes (Gagnon et al. Citation2006). Since cortisol acts as a regulator in osmoregulation, metabolism, growth, and reproduction, therefore, dysfunction of cortisol secretion can affect the health of fish (Mommsen et al. Citation1999). There is evidence for a relationship between pollutants, endocrine dysfunction, and impaired health in fish exposed to toxic chemicals. Endocrine dysfunction is characterized by abnormal changes in the plasma cortisol levels in response to stress. Previous studies have reported that several fish species exposed to various heavy metals have experienced endocrine dysfunction (Pratap & Bonga Citation1990; Brodeur et al. Citation1997; Leblond & Hontela Citation1999; Gagnon et al. Citation2006; Garcia-Santos et al. Citation2013). In fish, the glycogenolysis and gluconeogenesis pathways are activated by cortisol (Iwama et al. Citation1998). Cortisol acts as a stimulant for hepatic gluconeogenesis and inhibits peripheral glucose uptake (Kuo et al. Citation2015). Glucose from hepatic gluconeogenesis is released into the bloodstream and then enters cells via insulin action (Rui Citation2014; Sharabi et al. Citation2015). In response to stressors, the gluconeogenesis activities of cortisol permit fish to reach increased energy requirements from various homeostatic mechanisms (Rui Citation2014; Sharabi et al. Citation2015). Glycogenolysis is a biochemical process in which glucose is formed from the breakdown of glycogen. Glycogen in the liver is broken down into glucose to provide energy and maintain enough blood glucose levels, whereas glycogen in the muscles is broken down to maintain energy for contractile activity (Sharabi et al. Citation2015).
Over the past few decades, the promotion of industrial and manufacturing development has resulted in high economic efficiency in Vietnam. However, this promotion has had many consequences, including alarming environmental problems. The most serious concern is the significant increase in environmental pollution caused by toxic heavy metals (HMs). Lead and cadmium are highly toxic metals that have become significant pollutants in aquatic ecosystems owing to the increasing use of these metals for industrial and agricultural purposes and anthropogenic activities. Untreated wastewater from such activities, possibly containing Pb and Cd, is discharged into lakes, rivers, and streams; this not only pollutes surface water but also seeps into the ground, polluting groundwater. Climbing perch (A. testudineusis) is a freshwater fish species that easily adapts and lives in the water of rice fields, ponds, lakes, lagoons, and rivers (Nurulnadia et al. Citation2020), and is particularly adapted to living in polluted water. This species is widely used in aquaculture in Vietnam, bringing significant profits to farmers, and is extremely popular because it is hardy, long-lived, and adaptable to a high stocking rate. Laboratory simulation experiments could be an effective research model for understanding the effects of Pb and Cd on A. testudineusis in nature. The levels of cortisol and glucose in the blood of A. testudineusis have been extensively used as indicators of stress and have been shown to change in response to Pb; however, the effect of Cd on these levels has not previously been explored. Therefore, the aim of this study is to evaluate the endocrine stress response of A. testudineus elicited by Pb and Cd.
2. Materials and methods
2.1. The cultivation of study fish
Anabas testudineus were used to expose waterborne Pb and Cd. Experimental setup and experimental conditions were presented in Supporting Material. The fish care procedures were in accordance with Legislative Decree No. 146, implementing Directive 98/58/EC of 20 July 1998 concerning the protection of fish kept for farming purposes.
The 96 h LC50 values of Pb and Cd for A. testudineus were found to be approximately 120 and 38 mg/L, respectively (Khanh et al. Citation2021). Based on 96 h LC50 values, healthy A. testudineus were exposed to sublethal doses of Pb and Cd. The concentrations for sub-chronic exposure were 20, 30, and 40 mg/L for Pb (denoted 20Pb, 30Pb, and 40Pb) and 3, 5, and 10 mg/L for Cd (denoted 3 Cd, 5 Cd, and 10 Cd). Each treatment consisted of 3 tanks (n = 3) and randomly stocked 25 fish per aquarium. The experimental set-up was presented in Figure S1 (Supporting material). Based on the assumed biomass of fish in the aquarium, every day, the fish were fed about 4% of their body weight with floating pellets containing of 30% protein and 6% fat (HD-02, Halan Produce and Trade Joint Stock Company, Hung Yen Province, Vietnam). To minimize the variation in hormonal responses induced by the endocrine cycle, between 9:30 and 10:00 AM on days 7, 14, 21, and 28 of the exposure, A. testudineus was randomly selected from each group to obtain blood, muscle, gill, and liver tissue samples. The blood samples of fish were taken from the caudal vasculature for analysis of cortisol and glucose. The fish were found with bi-distilled water before tissue sampling. The fish were carefully cut opened using a plastic knife to remove the muscle, gill, and liver tissues. These tissues were freeze-dried for 48 h and pulverized into a uniform particle size prior to analysis of Pb and Cd concentrations.
2.2. Analyses of Pb and Cd
Tissue samples were mineralized with 6 mL of a 2:1 v/v mixture of HNO3 (65%) and H2O2 (30%) in the closed vessel. The clear liquid was obtained after heating to 85°C for 30 min, followed by dilution with deionized water to 25 mL and then determined for Pb and Cd concentrations by ICP-OES (Optima 2100 DV, Perkin Elmer). The method had a limit of detection (LOD) of 1.20 μg/L for Pb and 0.52 μg/L for Cd. Recoveries from A. testudineus tissues were found to be 92.2% for Pb and 94.4% for Cd.
2.3. Analyses of plasma cortisol
Whole blood samples were centrifuged about 5 min at 5,500 rpm to obtain clear plasma samples (Brodeur et al. Citation1997; Gregory & Wood Citation1999; Karaytug et al. Citation2010). Cortisol in clear plasma was liquid–liquid extraction (LLE) with dichloromethane. After extraction, the dichloromethane layer was washed with 0.1 mol/L NaOH, dried under nitrogen conditions, and re-dissolved with 45/55 methanol/water. The reconstituted sample was passed through a 0.22 µm Millipore filter and subjected to reversed phase liquid chromatography (RPLC) using ultraviolet (UV) detection at a wavelength of 250 nm (Thang et al. Citation2017). The limit of detection (LOD) and the limit of quantification (LOQ) for cortisol of this method were 0.87 and 2.90 ng/mL, respectively. Recovery of cortisol from A. testudineus plasma was approximately 97.9%.
2.4. Analyses of blood glucose
Pipette 0.5 mL of whole blood was added in 5 mL centrifuge tubes and then 2.0 mL of 5% (w/v) trichloroacetic acid was added and immediately vortexed before centrifugation at 5,000 rpm for 5 min (Dubowski Citation1962; Sudhakar Nayak & Pattabiraman Citation1981). The clear solution was measured by Phenol-sulphuric acid method (Sudhakar Nayak & Pattabiraman Citation1981). The LOD and LOQ for glucose of this method were 0.009 mg/dL and 0.027 mg/dL, respectively. Recoveries of glucose from A. testudineus blood were found to be from 96.5% to 104.4%.
2.5. Statistical analyses
Statistical analysis was carried out using the SPSS version 22.0. The difference was statistically significant between control group and Pb-exposed or Cd-exposed groups using LSD test (p < 0.05). The data are exhibited as the mean ± SD (n = 3).
3. Results and discussion
3.1. Accumulation of Pb and Cd in fish
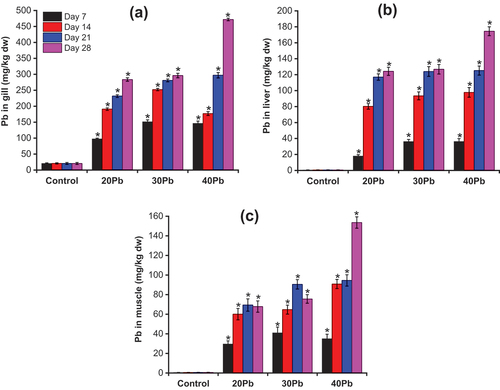
Heavy metals in water enter the body of fish mainly through the gills and skin. The content of Pb accumulated in the gills, liver, and muscles of A. testudineus exposed to Pb is presented in and Table S1 (Supporting Material). A significant increase in Pb concentration in the gills, liver, and muscles of A. testudineus was detected with increasing Pb concentration in the water and prolonged exposure time. In this study, Pb distribution in A. testudineus tissues was found to be in the following order: gill >> liver > muscles. Previous studies have also reported that the gills have a high tendency to accumulate heavy metals (Wong et al. Citation2001; Altındağ & Yiğit Citation2005; Karadede-Akin & Unlu Citation2007). For fish, the gills play an important role in the interface between water and blood. Because of direct contact with water, in addition to the function of diffusing oxygen continuously and maintaining pH, the gills are the main sites for storing pollutants such as heavy metals (Claiborne et al. Citation2002). In this study, the concentration of Pb in the gill tissue of fish exposed to polluted water was approximately 5–23 times that of the control fish (p < 0.05) ()). The accumulation of Pb in the liver of A. testudineus increased linearly at Pb exposures of 20, 30, and 40 mg/L ()). The concentration of Pb in the liver tissue of fish after 28 days of exposure was approximately 215–303 times that of the control group. Accumulation of Pb in the muscles of A. testudineus significantly increased with increasing Pb concentrations in water ()). After 28 days of exposure, the concentration of Pb in the muscles of A. testudineus was approximately 53–256 times that of the control fish (p < 0.05). The accumulation of Pb in the liver of fish after 28 days of exposure was 1.1–1.9 times that in the muscles. Previous studies have also reported that the metal accumulation in the liver is higher than that in muscles (Canli & Atli Citation2003; El-Moselhy et al. Citation2014; Jovičić et al. Citation2015). This may be because more metabolic activities occur in the liver than in the muscles (Agah et al. Citation2008). These results are in agreement with the hypothesis that metal accumulation in muscles is important only when the metal accumulation reaches its maximum level in the liver.
Figure 1. The accumulation of Pb in Anabas testudineus tissues during exposure period (Mean ± SD, n = 3 and *significantly different (p < 0.05) between Pb-exposed fish and control fish).
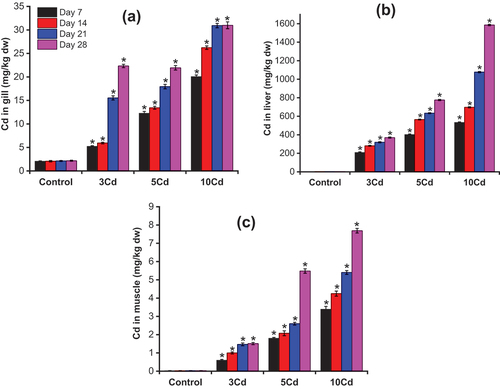
Cd is one of the most hazardous trace elements in the environment. Exposure to Cd significantly increases the amount of Cd accumulated in the tissues of A. testudineus in relation to that of the control fish ( and Table S2). As seen in , the distribution of Cd in A. testudineus tissues followed the order: liver >> gill > muscles. This result is consistent with a previous report that the amount of heavy metals accumulated in the liver of red tilapia from Jelebu, Malaysia, was higher than that in the gills and muscles (Low et al. Citation2011). The gill surfaces are negatively charged, making them a potential site for storing positively charged metals such as Cd2+ (Reid & McDonald Citation2011). However, in this study, the Cd concentrations found in the gills of fish were lower than those in the liver. In fish, the liver tissues are a more common indicator of water pollution than other organs. In many cases, the liver serves as a storage, redistribution, homeostasis, detoxification, or metabolism site for pollutants, and is an active site for the pathological effects caused by pollutants (Evans et al. Citation1993). The highest accumulation of Cd in the liver of A. testudineus exposed to Cd could be due to the high chemical similarity between Cd and Zn. Therefore, Cd can easily enter the body via a pathway identical to that of Zn. In this study, the concentration of Cd in the liver of fish exposed to Cd was approximately 2.5–14.5 times that of the control fish (p < 0.05) ()). The concentration of Cd in the fish liver after 7 days of exposure to Cd was approximately 580–1483 times that in the control fish liver. The amount of Cd accumulated in the liver of A. testudineus significantly increased with increasing Cd concentration in water ()). The concentration of Cd in the fish liver after 28 days of exposure to Cd was approximately 1017 to 4365 times that of the control fish liver. After 28 days of exposure to Cd, the amount of Cd accumulated in the muscles of A. testudineus was approximately 51.6–262.2 times higher than that of the control fish (p < 0.05) ()). The concentration of Cd in the liver was 144.5–244 times that in the muscles and 16.5–51.2 times that in the gill after 28 days of exposure to Cd.
Figure 2. The accumulation of Cd in Anabas testudineus tissues during exposure period (Mean ± SD, n = 3 and *significantly different (p < 0.05) between Cd-exposed fish and control fish).
3.2. Influence of Pb and Cd on plasma cortisol
Anabas testudineus exposed to Pb or Cd for a period of 28 days showed unusual symptoms such as fatigue, extraordinarily little appetite, and extremely slow responses; however, no mortality occurred during the experiment. Previous studies have reported blood parameters that have been used as stress susceptibility indicators in fish exposed to various toxins in water. In this study, the influences of Pb and Cd in water on the levels of plasma cortisol in A. testudineus were measured for 28 days. Alterations of the plasma cortisol levels in A. testudineus during 28 days of exposure to Pb and Cd are presented in . The results in ) show significantly higher levels of plasma cortisol in the Pb-treated fish compared with the control fish (p < 0.05). The plasma cortisol levels in A. testudineus increased with increasing concentrations of Pb in the water and varied as exposure time progressed. The cortisol concentration in the control fish ranged from 33.6 ± 0.5 to 34.0 ± 0.6 ng/mL. A maximum increase in plasma cortisol was observed in all the Pb-exposed groups on day 7. The increased plasma cortisol levels of the Pb-exposed fish in comparison with the control fish are presented in ) and Table S3. According to ), the increased plasma cortisol levels of the Pb-exposed fish ranged from 129.2 ± 2.4% to 172.9 ± 6.8%. For the fish exposed to 20 mg/L Pb, a decrease in the plasma cortisol levels was observed from day 14 to day 28 compared with the day 7. The plasma cortisol levels in the fish exposed to 20 mg/L Pb were higher than that of the control fish from 46.7 ± 2.1% to 100.5 ± 5.0%. In the fish exposed to Pb at 30 and 40 mg/L, the plasma cortisol fell to their lowest level on day 21 after which it increased on day 28. As seen in ), on day 21, the levels of plasma cortisol increased higher than that of the control fish by 75.1 ± 5.7% for the fish exposed to 30 mg/L Pb and 63.9 ± 0.5% for the fish exposed to 40 mg/L Pb. However, on day 28, the plasma cortisol level increased to 111.6 ± 3.8% and 141.8 ± 5.2% of the control levels for the 30 mg/L Pb and 40 mg/L Pb groups, respectively.
Figure 3. (a) and (c) The changes in plasma cortisol in Anabas testudineus on exposure to Pb and Cd, respectively; (b) and (d) the increase in plasma cortisol in Anabas testudineus between Pb-exposed or Cd-exposed fish and control fish (Mean ± SD, n = 3 and *significantly difference (p < 0.05) between Pb-exposed or Cd-exposed fish and control fish).
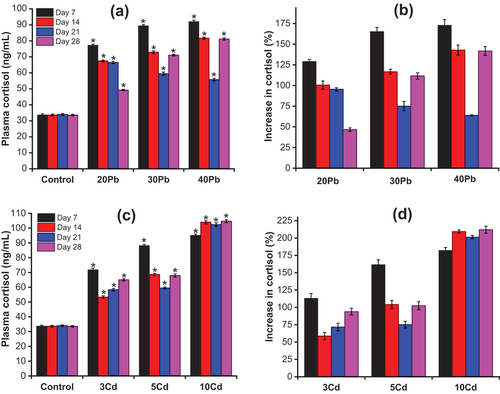
According to ), the plasma cortisol levels in the control fish were significantly lower than those in the Cd-exposed fish (p < 0.05). The plasma cortisol levels of A. testudineus in the Cd-exposed fish varied widely with increases in the concentration of Cd or as exposure time progressed. A maximum increase in plasma cortisol was found on day 7 in fish exposed to Cd at concentrations of 3 mg/L and 5 mg/L. As seen in ) and Table S4, in comparison with the control fish, the levels of plasma cortisol increased by 113.1 ± 6.9% for the fish exposed to 3 mg/L Cd and 161.7 ± 7.0% for the fish exposed to Cd at a concentration of 5 mg/L. For the fish exposed to Cd at a concentration of 3 mg/L, the plasma cortisol levels fell to their lowest level on day 14 and then increased until day 28. In the fish exposed to 5 mg/L Cd, the plasma cortisol level was lowest on day 21, after which it increased on day 28. The plasma cortisol levels were lowest on day 14 for the fish exposed to Cd at concentration of 3 mg/L and on day 21 for the fish exposed to Cd at concentration of 5 mg/L but were still higher than that of the control fish. From day 14 to day 28, the plasma cortisol levels increased higher than that of the control fish, from 58.6 ± 5.2% to 93.7 ± 4.8% for the fish exposed to 3 mg/L Cd, and from 75.1 ± 4.9% to 104.2 ± 5.8% for the fish exposed to 5 mg/L Cd. In the case of the fish exposed to 10 mg/L Cd, the levels of plasma cortisol increased during the first 14 days, after which it appeared to change slightly. In comparison with the control fish, the plasma cortisol levels in this fish increased by 182.2 ± 4.1% on day 7, 209.3 ± 2.2% on day 14, 201.3 ± 2.3% on day 21, and 212.0 ± 5.1% on day 28.
As a steroid hormone, cortisol is abundant and the most active substance in fish blood. The roles of cortisol are osmotic regulation and maintenance of balanced energy metabolism (McCormick et al. Citation2020). Blood cortisol can be thought of as an excellent indicator of changes in the HPI axis function (Hontela Citation2005). Disruption of cortisol release has been found in fish exposed to pollutants (Brodeur et al. Citation1997). Numerous studies have demonstrated abnormal cortisol release in fish following chronic exposure to environmental pollutants. An increase in levels of plasma cortisol can be thought of as a response of the fish to the presence of potentially toxic substances in the environment (Fırat & Kargın Citation2010; Fırat et al. Citation2011). Heavy metals, particularly Cd, Pb, and copper (Cu), disorder cortisol release by interrenal cells in different fish species. The results of this study demonstrated that the long-term exposure to Pb and Cd directly inhibited the interrenal cells of A. testudineus, leading to a significant increase in the plasma cortisol levels. Previous in vitro studies have been reported that Cd can directly inhibit the release of cortisol from interrenal tissues (Leblond & Hontela Citation1999). Oreochromis mossambicus exposed to 10 µg/L Cd for two, four, and 14 days showed a significant increase in levels of plasma cortisol (Pratap & Bonga Citation1990). Previous studies have shown that the plasma cortisol levels in Oncorhynchus mykiss increased after Cd exposure (Ricard et al. Citation1998; Scott et al. Citation2003; Chowdhury et al. Citation2004). There was a significant increase in plasma cortisol levels in Oreochromis niloticus for 24 and 48 h exposed to 25 mg/L CdCl2 (Garcia-Santos et al. Citation2013). Gagnon et al. (Citation2006) reported that O. mykiss exposed to Cu at high concentrations had disrupted cortisol release through toxic effects on adrenocortical cells, whereas O. mykiss exposed to Cu at low concentrations for 30 days had increased cortisol release in response to ACTH in vitro. Plasma cortisol levels in O. mykiss, Cyprinus carpio, and O. niloticus significantly increased during exposure to Cu (Dethloff et al. Citation1999; De Boeck et al. Citation2001; Monteiro et al. Citation2005). Endocrine dysfunction can lead to serious health problems because cortisol mobilizes energy, such as fatty acids, glucose, and lipids, to maintain homeostasis (Mommsen et al. Citation1999). Cortisol release was disrupted after exposure to metals and other toxic substances, which could then affect processes that depend on cortisol (Gagnon et al. Citation2006).
3.3. Influence of Pb and Cd on blood glucose
Under stressful conditions, the mechanisms controlling food intake in fish are abrogated and signals of appetite in the brain fail to function, leading to reduced intake of food. The mechanism of food intake regulation in fish is partly accomplished by Corticotropin-Releasing Factor (CRF). As an anorexigenic neuropeptide, CRF is related to stimulation of the HPI axis in response to physiological stress (Conde-Sieira et al. Citation2018). Among the organic components of the blood, glucose is considered a key parameter for assessing the stress status of fish exposed to toxic substances because it is often altered by changes in carbohydrate metabolism due to environmental stress. shows the changes in the blood glucose levels in A. testudineus after 28 days of exposure to Pb and Cd.
Figure 4. (a) and (c) The changes in blood glucose in Anabas testudineus on exposure to Pb and Cd, respectively; (b) and (d) The alteration of blood glucose in Anabas testudineus between Pb-exposed or Cd-exposed fish and control fish (Mean ± SD, n = 3 and *significantly difference (p < 0.05) between Pb-exposed or Cd-exposed fish and control fish).
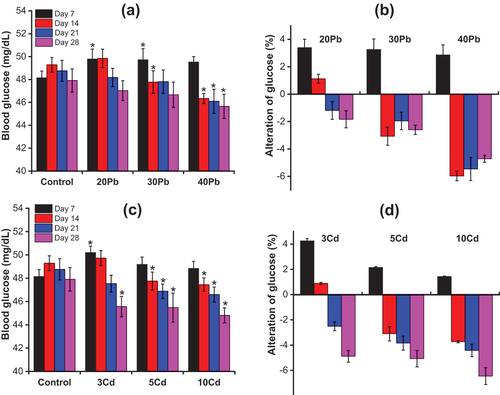
As seen in ), the blood glucose levels in A. testudineus exposed to Pb increased slightly on day 7 and then started to decrease until day 28 when compared with the control fish. With a further increase in the Pb concentration, the blood glucose level slightly decreased. The blood glucose levels in A. testudineus exposed to Pb decreased with increasing exposure time. The concentration of blood glucose in the control fish ranged from 47.9 ± 1.0 mg/dL to 49.3 ± 0.6 mg/dL. The maximum reduction of blood glucose in all groups exposed to Pb was on day 28. According to ) and Table S5, on day 7, the blood glucose levels in the group exposed to 20 mg/L Pb and 30 mg/L Pb increased significantly (p < 0.05) and increased by 3.4 ± 0.6% and 3.2 ± 0.8%, respectively, in comparison with the control fish. While the blood glucose levels in the group exposed to 40 mg/L Pb increased by 2.9 ± 0.7%, this was insignificantly higher as compared to the control fish (p < 0.05). On day 14, the blood glucose levels in the group exposed to 20 mg/L Pb increased by 1.1 ± 0.3%, which was negligible higher than that in the control group (p < 0.05). In contrast, the groups exposed to 30 mg/L Pb and 40 mg/L had blood glucose levels decrease by 3.1 ± 0.7% and 6.0 ± 0.3%, respectively, which were significantly lower compared to the control fish (p < 0.05). The blood glucose levels of A. testudineus in all Pb exposure groups decreased steadily, ranging from 1.2 ± 0.7% to 5.5 ± 0.8% on day 21 and reaching 1.8 ± 0.6% to 4.7 ± 0.3% on day 28. From day 14 to day 28, the fish exposed to Pb at a concentration of 40 mg/L had significantly lowered the blood glucose levels compared with control fish (p < 0.05).
According to ), the blood glucose levels of A. testudineus exposed to Cd increased slightly on day 7 and then decreased sharply until day 28. The blood glucose levels decreased with increasing exposure time to Cd or increased concentrations of Cd in the water. As shown in ) and Table S6, for the fish exposed to Cd at concentration of 3 mg/L, the blood glucose level increased by 4.3 ± 0.2% on day 7, which was significantly higher compared with the control fish (p < 0.05) and increased by 0.9 ± 0.1% on day 14. On day 28, the blood glucose level in the fish exposed to 3 mg/L Cd decreased by 4.9 ± 0.5% compared with the control, which was significantly lower than that of the control fish (p < 0.05). For the fish exposed to Cd at concentration of 5 mg/L Cd and 10 mg/L, the blood glucose levels increased by 2.2 ± 0.1% and 1.4 ± 0.03%, respectively, on day 7 compared with the control fish. From day 14 to day 28, the blood glucose levels in the fish exposed to Cd at concentration of 5 mg/L Cd and 10 mg/L Cd decreased sharply, ranging from 3.1 ± 0.6% to 5.1 ± 0.7% on day 14 and decreasing to 3.7 ± 0.1% to 6.5 ± 0.7% on day 28 for these treatments, respectively, which was significantly lower compared to the control fish (p < 0.05).
The results of this study showed a slight increase and decrease in the blood glucose of fish exposed to Pb and Cd for 28 days. Lowe-Jinde and Niimi (Citation1984) reported similar results; the blood glucose level only slightly increased in O. mykiss exposed to Cd for 21 days. Gill and Pant (Citation1983) reported that short-term exposure to Cd elicited hyperglycemia in Puntius conchonius, while hypoglycemia was manifested in P. conchonius after long-term exposure to Cd. Ricard et al. (Citation1998) reported a negligible increase in the blood glucose level of O. mykiss after 30 days of Cd exposure. A previous study had shown that O. mossambicus exposed to cadmium at 10 µg/L had significantly elevated blood glucose levels on 2–4 days of exposure (Pratap & Bonga Citation1990). In fish, glucose can be used as an energy source to repair Cd-induced damage and the homeostatic mechanisms involved in glycogenolysis and gluconeogenesis to maintain normal blood glucose levels (Ricard et al. Citation1998). A previous study showed treating salmonids with cortisol stimulated hepatic transaminases and protein catabolism, resulting in decreased muscle mass and growth, which suggested that cortisol played an important role in converting proteins to glucose (Freeman & Idler Citation1973). Significantly elevated blood glucose levels (hyperglycemia) were also reported in Salmo gairdneri, O. mykiss, Prochilodus lineatus, and O. niloticus after exposure to Cd, Cu, and Pb, respectively (Haux & Larsson Citation1984; Richards & Playle Citation2011; Garcia-Santos et al. Citation2013). Carbohydrate metabolism is affected by cortisol, and frequently elevated cortisol levels lead to high blood glucose levels in fish (Wendelaar Bonga Citation1997). Since glucose in the blood is used to provide energy for the whole body, in order to maintain normal blood glucose levels during starvation, the liver plays an important role in the production of glucose through glycogenolysis and gluconeogenesis (Tadaishi et al. Citation2018). Although the mechanisms involved are not fully understood, it is conceivable that the increase in blood glucose levels following exposure to a stressor relates to stimulation of the hypothalamus-sympathetic-chromaffin (HSC) axis (Conde-Sieira et al. Citation2018). Elevated blood glucose in fish is indicative of a disturbance in carbohydrate metabolism, possibly due to increased hepatic glucose 6-phosphatase activity, which promotes hepatic glycogenolysis and gluconeogenesis through an increase in ACTH and glucagon and/or decreased activity of insulin (Raja et al. Citation1992). In this study, although A. testudineus exposed to Pb and Cd ate extraordinarily little, they maintained adequate blood glucose levels, possibly by promoting the breakdown of glycogen into glucose in the liver and glucose synthesis from proteins and amino acids in extrahepatic tissue. The alterations of plasma cortisol and glucose levels of A. testudineus in this study suggest that it is possible that both the HPI and HSC axes of A. testudineus are activated by Pb and Cd, thereby generating different compensatory responses.
4. Conclusion
In summary, the results of this study indicate that gills and liver of A. testudineus are the two target organs to accumulate Pb and Cd, respectively, and show symptoms of toxicity. Exposure to high concentrations of Pb and Cd was not lethal but caused endocrine dysfunction of A. testudineus. Important aspects of Pb and Cd toxicity are the adverse effects on the interrenal and pancreatic activities, resulting in abnormal changes in levels of plasma cortisol, and blood glucose. Comparing the effects of the two metals, Cd has a more deleterious effect on the interrenal and pancreatic activities than Pb. Therefore, cortisol and glucose levels can be used as indicators for stress assessment and management in fish.
Supplemental Material
Download MS Word (299.5 KB)Disclosure statement
No potential conflict of interest was reported by the author(s).
Supplementary material
Supplemental data for this article can be accessed online at https://doi.org/10.1080/24750263.2022.2096129.
Additional information
Funding
References
- Agah H, Leermakers M, Elskens M, Fatemi SMR, Baeyens W. 2008. Accumulation of trace metals in the muscle and liver tissues of five fish species from the Persian Gulf. Environmental Monitoring and Assessment 157(1):499–514. DOI: 10.1007/s10661-008-0551-8.
- Alinnor IJ. 2005. Assessment of elemental contaminants in water and fish samples from Aba river. Environmental Monitoring and Assessment 102(1–3):15–25. DOI: 10.1007/s10661-005-1011-3.
- Altındağ A, Yiğit S. 2005. Assessment of heavy metal concentrations in the food web of lake Beyşehir, Turkey. Chemosphere 60(4):552–556. DOI: 10.1016/j.chemosphere.2005.01.009.
- Brodeur JC, Sherwood G, Rasmussen JB, Hontela A. 1997. Impaired cortisol secretion in yellow perch (Perca flavescens) from lakes contaminated by heavy metals: In vivo and in vitro assessment. Canadian Journal of Fisheries and Aquatic Sciences 54(12):2752–2758. DOI: 10.1139/f97-200.
- Canli M, Atli G 2003. The relationship between heavy metal (Cd, Cr, Cu, Fe, Pb, Zn) levels and the size of six Mediterranean fish species. Environmental pollution (Barking, Essex: 1987) 121:129–136.
- Chowdhury MJ, Pane EF, Wood CM. 2004. Physiological effects of dietary cadmium acclimation and waterborne cadmium challenge in rainbow trout: Respiratory, ionoregulatory, and stress parameters. Comparative, Environmental and Evolutionary Physiology Part C: Toxicology and Pharmacology 139(1):163–173.
- Claiborne JB, Edwards SL, Morrison-Shetlar AI. 2002. Acid-base regulation in fishes: Cellular and molecular mechanisms. Journal of Experimental Zoology 293(3):302–319. DOI: 10.1002/jez.10125.
- Conde-Sieira M, Chivite M, Míguez JM, Soengas JL. 2018. Stress effects on the mechanisms regulating appetite in teleost fish. Frontiers in Endocrinology 9:631. DOI: 10.3389/fendo.2018.00631.
- De Boeck G, Vlaeminck A, Balm PH, Lock RA, De Wachter B, Blust R. 2001. Morphological and metabolic changes in common carp, Cyprinus carpio, during short-term copper exposure: Interactions between Cu2+ and plasma cortisol elevation. Environmental Toxicology and Chemistry 20(2):374–381. DOI: 10.1002/etc.5620200219.
- Dethloff GM, Schlenk D, Khan S, Bailey HC. 1999. The effects of copper on blood and biochemical parameters of rainbow trout (Oncorhynchus mykiss). Archives of Environmental Contamination and Toxicology 36(4):415–423. DOI: 10.1007/PL00006614.
- Dubowski KM. 1962. An o-toluidine method for body-fluid glucose determination. Clinical Chemistry 8:215–235. DOI: 10.1093/clinchem/8.3.215.
- El-Moselhy KM, Othman AI, Abd El-Azem H, El-Metwally MEA. 2014. Bioaccumulation of heavy metals in some tissues of fish in the Red Sea. Egypt. Egyptian Journal of Basic and Applied Sciences 1(2):97–105. DOI: 10.1016/j.ejbas.2014.06.001.
- Evans DW, Dodoo DK, Hanson PJ. 1993. Trace element concentrations in fish livers: Implications of variations with fish size in pollution monitoring. Marine Pollution Bulletin 26:329–334. DOI: 10.1016/0025-326X(93)90576-6.
- Fırat Ö, Kargın F. 2010. Individual and combined effects of heavy metals on serum biochemistry of Nile tilapia Oreochromis niloticus. Archives of Environmental Contamination and Toxicology 58(1):151–157. DOI: 10.1007/s00244-009-9344-5.
- Fırat Ö, Cogun HY, Yüzereroğlu TA, Gök G, Fırat Ö, Kargin F, Kötemen Y. 2011. A comparative study on the effects of a pesticide (cypermethrin) and two metals (copper, lead) to serum biochemistry of Nile tilapia, Oreochromis niloticus. Fish Physiology and Biochemistry 37(3):657–666. DOI: 10.1007/s10695-011-9466-3.
- Freeman HC, Idler DR. 1973. Effects of corticosteroids on liver transaminases in two salmonids, the rainbow trout (Salmo gairdnerii) and the brook trout (Salvelinus fontinalis). General and Comparative Endocrinology 20(1):69–75. DOI: 10.1016/0016-6480(73)90131-7.
- Fryer JN, Lederis K. 1986. Control of corticotropin secretion in teleost fishes 1. American Zoologist 26(4):1017–1026. DOI: 10.1093/icb/26.4.1017.
- Gagnon A, Jumarie C, Hontela A. 2006. Effects of Cu on plasma cortisol and cortisol secretion by adrenocortical cells of rainbow trout (Oncorhynchus mykiss). Aquatic Toxicology 78(1):59–65. DOI: 10.1016/j.aquatox.2006.02.004.
- Garcia-Santos S, Fontaínhas-Fernandes A, Monteiro SM, Wilson JM. 2013. Effects of exposure to cadmium on some endocrine parameters in tilapia, Oreochromis niloticus. Bulletin of Environmental Contamination and Toxicology 90(1):55–59. DOI: 10.1007/s00128-012-0905-3.
- Gill TS, Pant JC. 1983. Cadmium toxicity: Inducement of changes in blood and tissue metabolites in fish. Toxicology Letters 18(3):195–200. DOI: 10.1016/0378-4274(83)90093-0.
- Gregory TR, Wood CM. 1999. The effects of chronic plasma cortisol elevation on the feeding behaviour, growth, competitive ability, and swimming performance of juvenile rainbow trout. Physiological and Biochemical Zoology 72(3):286–295. DOI: 10.1086/316673.
- Haux C, Larsson Å. 1984. Long-term sublethal physiological effects on rainbow trout, Salmo gairdneri, during exposure to cadmium and after subsequent recovery. Aquatic Toxicology 5(2):129–142. DOI: 10.1016/0166-445X(84)90004-3.
- Hontela A. 2005. Chapter 12 adrenal toxicology: Environmental pollutants and the HPI axis. In: Mommsen TP, Moon TW, editors. Biochemistry and molecular biology of fishes. Vol. 6. Netherlands: Elsevier. pp. 331–363.
- Iwama GK, Thomas PT, Forsyth RB, Vijayan MM. 1998. Heat shock protein expression in fish. Reviews in Fish Biology and Fisheries 8(1):35–56. DOI: 10.1023/A:1008812500650.
- Jovičić K, Nikolić DM, Višnjić-Jeftić Ž, Đikanović V, Skorić S, Stefanović SM, Lenhardt M, Hegediš A, Krpo-Ćetković J, Jarić I. 2015. Mapping differential elemental accumulation in fish tissues: Assessment of metal and trace element concentrations in wels catfish (Silurus glanis) from the Danube River by ICP-MS. Environmental Science and Pollution Research 22(5):3820–3827. DOI: 10.1007/s11356-014-3636-7.
- Karadede-Akin H, Unlu E. 2007. Heavy metal concentrations in water, sediment, fish and some benthic organisms from Tigris River, Turkey. Environmental Monitoring and Assessment 131:323–337. DOI: 10.1007/s10661-006-9478-0.
- Karaytug S, Karayakar F, Soydemir ÇN, Cicik B, Ay Ö, Erdem C. 2010. Effects of cadmium on sera glucose and cortisol levels in Clarias gariepinus (Burchell, 1822). Journal of Animal and Veterinary Advances 9:2159–2162. DOI: 10.3923/javaa.2010.2159.2162.
- Khanh DNN, Vy NTT, Phuong TH, Nhi PT, Thang NQ, Sy DT, Phuong NTK. 2021. Effects of cadmium and lead on muscle and liver glycogen levels of climbing perch (Anabas testudineus). Bulletin of Environmental Contamination and Toxicology 108:854–860. DOI: 10.1007/s00128-021-03384-4.
- Kuo T, McQueen A, Chen TC, Wang JC. 2015. Regulation of glucose homeostasis by glucocorticoids. Advances in Experimental Medicine and Biology 872:99–126.
- Leblond VS, Hontela A. 1999. Effects of in vitro exposures to cadmium, mercury, zinc, and 1-(2-Chlorophenyl)-1-(4-chlorophenyl)-2,2-dichloroethane on steroidogenesis by dispersed interrenal cells of rainbow trout (Oncorhynchus mykiss). Toxicology and Applied Pharmacology 157(1):16–22. DOI: 10.1006/taap.1999.8660.
- Low KH, Zain SM, Abas MR. 2011. Evaluation of metal concentrations in Red Tilapia (Oreochromis spp) from three sampling sites in Jelebu, Malaysia using principal component analysis. Food Analytical Methods 4(3):276–285. DOI: 10.1007/s12161-010-9166-0.
- Lowe-Jinde L, Niimi AJ. 1984. Short-term and long-term effects of cadmium on glycogen reserves and liver size in rainbow trout (Salmo gairdneri Richardson). Archives of Environmental Contamination and Toxicology 13(6):759–764. DOI: 10.1007/BF01055940.
- McCormick SD, Taylor ML, Regish AM. 2020. Cortisol is an osmoregulatory and glucose-regulating hormone in Atlantic sturgeon, a basal ray-finned fish. Journal of Experimental Biology 223(18). DOI: 10.1242/jeb.220251.
- Mommsen TP, Vijayan MM, Moon TW. 1999. Cortisol in teleosts: Dynamics, mechanisms of action, and metabolic regulation. Reviews in Fish Biology and Fisheries 9(3):211–268. DOI: 10.1023/A:1008924418720.
- Monteiro SM, Mancera JM, Fontaínhas-Fernandes A, Sousa M. 2005. Copper induced alterations of biochemical parameters in the gill and plasma of Oreochromis niloticus. Comparative, Environmental and Evolutionary Physiology Part C: Toxicology and Pharmacology 141(4):375–383.
- Nurulnadia MY, Noradila AB, Adiana G. 2020. Turbidity effects of suspended bauxite in embryonic stage of climbing perch (Anabas testudineus) post fertilization. Egyptian Journal of Aquatic Research 46(2):181–186. DOI: 10.1016/j.ejar.2020.02.006.
- Pratap HB, Bonga SEW. 1990. Effects of water-borne cadmium on plasma cortisol and glucose in the cichlid fish Oreochromis mossambicus. Comparative, Environmental and Evolutionary Physiology Part C: Toxicology and Pharmacology 95(2):313–317.
- Raja M, al-Fatah A, Ali M, Afzal M, Hassan RA, Menon M, Dhami MS. 1992. Modification of liver and serum enzymes by paraquat treatment in rabbits. Drug Metabolism and Drug Interactions 10(4):279–291. DOI: 10.1515/DMDI.1992.10.4.279.
- Reid S, McDonald D. 2011. Metal binding activity of the gills of rainbow trout (Oncorhynchus mykiss). Canadian Journal of Fisheries and Aquatic Sciences 48:1061–1068. DOI: 10.1139/f91-125.
- Ricard AC, Daniel C, Anderson P, Hontela A. 1998. Effects of subchronic exposure to cadmium chloride on endocrine and metabolic functions in rainbow trout Oncorhynchus mykiss. Archives of Environmental Contamination and Toxicology 34(4):377–381. DOI: 10.1007/s002449900333.
- Richards J, Playle R. 2011. Protective effects of calcium against the physiological effects of exposure to a combination of cadmium and copper in rainbow trout (Oncorhynchus mykiss). Canadian Journal of Zoology 77:1035–1047. DOI: 10.1139/z99-070.
- Rui L. 2014. Energy metabolism in the liver. Comprehensive Physiology 4(1):177–197.
- Scott GR, Sloman KA, Rouleau C, Wood CM. 2003. Cadmium disrupts behavioural and physiological responses to alarm substance in juvenile rainbow trout (Oncorhynchus mykiss). Journal of Experimental Biology 206(11):1779–1790. DOI: 10.1242/jeb.00353.
- Scott GR, Sloman KA. 2004. The effects of environmental pollutants on complex fish behaviour: Integrating behavioural and physiological indicators of toxicity. Aquatic Toxicology 68(4):369–392. DOI: 10.1016/j.aquatox.2004.03.016.
- Sharabi K, Tavares CDJ, Rines AK, Puigserver P. 2015. Molecular pathophysiology of hepatic glucose production. Molecular Aspects of Medicine 46:21–33. DOI: 10.1016/j.mam.2015.09.003.
- Sudhakar Nayak S, Pattabiraman TN. 1981. A new colorimetric method for the estimation of glycosylated hemoglobin. Clinica Chimica Acta 109(3):267–274. DOI: 10.1016/0009-8981(81)90312-0.
- Tadaishi M, Toriba Y, Shimizu M, Kobayashi-Hattori K. 2018. Adenosine stimulates hepatic glycogenolysis via adrenal glands–liver crosstalk in mice. Plos One 13(12):e0209647. DOI: 10.1371/journal.pone.0209647.
- Thang NQ, Huy BT, Van Tan L, Phuong NTK. 2017. Lead and arsenic accumulation and its effects on plasma cortisol levels in Oreochromis sp. Bulletin of Environmental Contamination and Toxicology 99(2):187–193. DOI: 10.1007/s00128-017-2113-7.
- Wendelaar Bonga SE. 1997. The stress response in fish. Physiological Reviews 77(3):591–625. DOI: 10.1152/physrev.1997.77.3.591.
- Wong CK, Wong PPK, Chu LM. 2001. Heavy metal concentrations in marine fishes collected from fish culture sites in Hong Kong. Archives of Environmental Contamination and Toxicology 40(1):60–69. DOI: 10.1007/s002440010148.