
 ?Mathematical formulae have been encoded as MathML and are displayed in this HTML version using MathJax in order to improve their display. Uncheck the box to turn MathJax off. This feature requires Javascript. Click on a formula to zoom.
Abstract
Biological invasions are becoming the most serious global environmental threats under changing climate. Beekeeping has faced such invasions with the changing climatic. One of these invaders is the small hive beetle (SHB), which has not yet been encountered in some countries and is currently at a preventable level. SHB can be a highly destructive pest for honey bee colonies, as it damages honey bee comb and larvae, as well as honey and pollen. Although SHB threatens honey bee populations, the impact of climate change on the severity of infestation and its growth rate are still unknown. This apicultural issue is theoretically addressed by using a coupled honey bee–SHB mathematical model in which the rate of SHB growth varies with time to account for changing climate. When the temperature rises, honey bee colonies collapse due to an increase in SHB growth rate, and the severity of the infestation also plays a role in the colony’s survival. This study suggests that in the future, global warming will increase colony losses from SHB and may increase the risk of SHBs spreading to regions where it is currently absent, and precautions should be taken to prevent transmission.
Introduction
Honey bees are super pollinators providing essential ecosystem services in agricultural and natural areas and are an important source of regular income for farm families. Honey bees are vital for economic, sustainable agriculture, for the biodiversity of many ecosystems and for food security (Aslan et al. Citation2016). Several pathogens and parasites are the largest contributors to honey bee decline. A major decline of honey bee health puts agriculture, healthy lifestyles, and worldwide food security at risk (Smith et al. Citation2013). The small hive beetle (SHB), Aethina tumida Muray, is an invasive pest affecting bee colonies and can have a significant impact on apiculture and wild bee populations (Neumann et al. Citation2016). By disrupting pollination services, it poses a major threat to the long-term sustainability and economic prosperity of world beekeeping, as well as to agriculture and the environment (Decourtye et al. Citation2019). SHB was discovered by Andrew Murray in 1867 in Central Africa. Originating as minor soil scavengers native to Sub-Saharan Africa, they have quickly spread throughout the world among the Apis mellifera subspecies during the last few decades (Neumann & Elzen Citation2004). They were first noticed as non-endemic in USA in 1996 and then their presence was confirmed in Florida in 1998 by the Florida Department of Agriculture (Hood Citation2004). Then, in 2002, it was reported that SHB had been detected in Canada and Australia (Dixon & Lafrenière Citation2002; Gillespie et al. Citation2003). According to the findings, even without any accessible food, beetles may survive for 2–6 months (Neumann et al. Citation2001). Multiple studies suggest that they are most likely spread by fruit export, which serves as a potential food source. They also can spread via bee products such as pollen, comb, colonies, etc. and expand in the countryside via migratory apiculture practices (Hood Citation2004).
When certain conditions are met, SHB can be a very destructive pestilence for honey bee colonies. They damage the comb and larvae of honey bees, and cause damage to honey and pollen. Additionally, under heavy SHB infestation, honey bees may abandon their hive and eventually experience colony collapse. The life cycle of SHBs is, briefly: adult SHBs that have completed their development in the soil can invade bee colonies or go to alternative food sources such as fruits and stored bee products, where they feed and reproduce outside the bee colony. Mating of adult SHBs can occur inside or outside the colony. Adults in the hive prefer especially bee broods as well as pollen and honey for feeding. SHBs lay their eggs inside the hive, and the hatched larvae feed on bee larvae and bee products. When the larvae mature, they enter the wandering stage. Later, the wandering larvae leave the colony to enter the pupa stage in the soil. After pupation, adult SHBs leave the soil to complete their life cycle (Neumann et al. Citation2016). SHB larvae are the primary reason for the potency of SHB and the most important element in damaging the hive. Also, in their migration via honeycombs, they feed on, excrete in and thereby cause fermentation in the honey, which produces a slimy substance that spoils the honey and emits an odor of rotten oranges (Fell Citation1999). A regular larva reaches maturity in 10–14 days; however, high temperatures decrease the maturity time and increase the severity of infestation. They crawl out of the hive and burrow into soil at night to pupate. Pupation time varies greatly and also depends on temperature, but the usual range is from 15 to 100 days. While pupa matures, it shifts color from white to dark reddish brown (Roth et al. Citation2022). Mature beetles are robust fliers and can fly for a few kilometers, enhancing their spread. They usually fly to hives around midnight; males have a tendency to depart earlier than females (Cuthbertson et al. Citation2013). Once they enter the hive, they tend to go to darker and cooler corners of hive to avoid the adult honey bees. Females deposits their eggs in cracks around the hive, or right on pollen or brood combs; they often penetrate the sealed cell cap or wall and deposit eggs inside. Larvae hatch in 2–4 days and begin searching for food right away, feeding on pollen, honey, eggs and bee larvae. Although they do not lay eggs or pupate during winter they are still a nuisance because they steal heat from the gathered bees, increasing the bees’ energy need (Roth et al. Citation2022).
SHB larvae cause considerable damage in honey bee colonies by feeding on the brood and bee products. Damage to the colony is directly related to the number of SHBs. Abiotic factors including temperature, texture, salinity, pH value and humidity, and biotic factors such as natural enemies, competitors, competition for food, cannibalism, multiple mating, aggregation of adults, human activity, etc., can impact the survival and reproduction of SHBs (Neumann et al. Citation2016). In the presence of a high number of SHBs in the colony, the queens stop laying eggs and the colonies are progressively weakened, resulting in colony collapse.
Global climate has changed, especially since the 1900s, and climatic change affects ecosystems, water resources, food and health (Misra Citation2014). Using complex climate models, the Intergovernmental Panel on Climate Change, in their third assessment report, predicted that the average surface temperature would increase by 1.4 to 5.8°C over the period 1990 to 2100 (https://www.ipcc.ch/). In the future simulation (2071–2100), warming over Turkey’s climatic regions is in the range of 2–5°C (Önol & Unal Citation2014). In another study, an increase of 1 to 6°C in mean temperatures of Turkey, covering the period between 2016 and 2099, was projected (Demircan et al. Citation2017).
The development of SHB in one region and its spread to other regions are closely related to climatic conditions. In Canada, SHB was first observed in 2002 and then again in 2006 in different regions without any sign of population survival after winter. Two years later, another small infestation of SHB was discovered in another part of Canada. A few years later, in 2012, the pest was seen in Ontario and again in Manitoba (Dixon & Lafrenière Citation2002; Nasr Citation2006; Giovenazzo & Boucher Citation2010; Bernier et al. Citation2014). Damage from SHB has been relatively minor compared in Canada to other countries (Toufailia et al. Citation2017; Araneda et al. Citation2021). The reason for this is that the air temperature in the countries where SHB causes great damage is higher than that of Canada; therefore, the colder Canadian climate may have prevented the SHB population from being established before today (Bernier et al. Citation2014).
A large variation in developmental periods (24–81 days) of SHB larvae was noted, partly due to differences in rearing temperature (Mürrle & Neumann Citation2004; Haque & Levot Citation2005; De Guzman et al. Citation2010), indicating that environmental factors influence the reproductive potential of SHB. De Guzman and Frake (Citation2007) observed that exposure to a lower temperature (24–28°C) caused a 15-day extension of total larval developmental time as compared to a higher temperature (34°C). De Guzman et al. (Citation2010) have found that about 80 hot (≥27°C) days increased the number of adult SHBs and only the proportion of hot days significantly correlated with the number of adult SHBs. In the case of mild and short winters and warm summers in Turkey due to global warming, more generations of SHBs are completed and thus the annual population growth rate increases.
It has been reported that pupae could not develop at temperatures <10°C in mineral soil (Meikle & Patt Citation2011). Bernier et al. (Citation2014) found a survival rate between 12.5 and 22.9% in organic soils and estimated the minimal temperature of development to lie between 10.2 and 13.2°C depending on the soil water content. SHB development may be limited by cold soil temperatures in Turkey during the winter months. However, the fact that the soil temperature does not fall below the above-mentioned temperatures in winter due to climate change may allow SHB to survive in Turkey.
To detail the essential components of honey bee colony dynamics, several mathematical models have been developed based on differential equations. Researchers believe that several factors may shape these dynamics, such as Varroa destructor and viruses (Sumpter & Martin Citation2004; Eberl et al. Citation2010; Ratti et al. Citation2013; Ratti et al. Citation2015; Bernardi & Venturino Citation2016; Britton & Jane White Citation2021), seasonal change (Gabbriellini Citation2017; Yamada et al. Citation2019), impact of the forager death rate on colony growth (Khoury et al. Citation2011), and colony growth dependence on food availability (Khoury et al. Citation2013). Some of these models have tried to describe honey bee dynamics through various factors, while others have tried to describe honey bee diseases. However, a mathematical model has not yet been proposed for the new type of insect that threatens honey bees. SHB can be a very destructive pestilence for honey bee colonies and its temperature-dependent growth should be considered in the context of climate change (Noor-ul-Ane & Jung Citation2020). Even though several field studies have been designed to explore the effects of climate change on SHB development and survival, no mathematical model has been developed to explain this relation. The main motivation of this work is to simulate how rising temperatures affect SHB growth and, in turn, honey bee dynamics.
The aforementioned issues will be addressed by focusing on the mathematical model of Varroa–honey bee dynamics (Ratti et al. Citation2015) to investigate the effect of SHB growth on colony dynamics. The natural dynamics of the colony depend on several factors. Here, we consider only the interaction of SHB and honey bee in the absence of viral disease. In this context, we concentrate on the wandering larvae of the SHB life cycle in the bee brood, where the hatched larvae consume honey, pollen, bee eggs and larvae, resulting in decreased colony efficiency and hive production, which can lead to colony collapse. The model we present here provides a simple theoretical basis for assessing how SHB growth in a colony interacts with population to determine the survival of the hive. A detailed description of the mathematical model is discussed in the following sections, followed by numerical simulations and a conclusion.
Mathematical model
Model assumptions
Varroa and SHB, which both pose a threat to hive health, are treated in terms of the damage they cause to the colony; however, it is hypothesized in this study that the mathematical model discussed for Varroa can also be considered for SHB under certain assumptions. In the direction of this assumption, the honey bee–Varroa mathematical model (Ratti et al. Citation2015) was reduced to a simple two-component bee–SHB system. Due to differences in their life cycle, damage to the colony can be different for Varroa and SHB. To deal with this problem, it should be emphasized here that certain assumptions are considered as only wandering larvae of SHB. In this case, the interaction between SHB and bees is assumed to be restricted to within the hive (to make the model its possible simplest form). An overview of the main model assumptions is given below:
The biological argument (Eberl et al. Citation2010) suggests that the growth rate of a bee colony should be sigmoidal, i.e. approximately constant for the number of bees above a certain threshold, but rapidly collapsing to zero for the number of bees below the threshold, in which case brood maintenance is not carried out properly.
Since SHB reproduction depends on brood availability, the population’s carrying capacity depends on an approximation of brood size (as in Ratti et al. Citation2013; Ratti et al. Citation2015). Therefore, a logistic form can be used to characterize the growth of SHB.
It is assumed that honey bees die due to SHB feeding on the colony and by natural causes. Therefore, the death rates are split into two parts that depend on, respectively, SHB interaction and natural loss.
External forces used to remove SHB from brood are not allowed. As a result, the death of SHB is caused by changing climate, which is dependent on temperature, as well as natural mortality.
Model equations
The following equations give the corresponding model:
where is the number of honey bees, and
is the number of SHBs at time
With the above biological assumptions, the functional form of honey bee growth (
), i.e. the number of bees required to care for the brood, and growth of SHB (
can be taken into account by the following parameterizations:
where is the size of the bee colony. The function
in EquationEquation (2)
(2)
(2) is the temperature-dependent development and survival of SHB, according to the Pradhan–Taylor (Gaussian) model (Pradhan Citation1945; Taylor Citation1981). Temperature is one of the most important factors affecting the development and reproduction of insects. Higher temperature greatly accelerates the development of SHB in the larval and especially pupal stages, and the life cycle time is shortened. Thus, with increased temperature, SHB reproduces rapidly and its negative effects on bee colonies are strengthened (Bernier et al. Citation2014; Noor-ul-Ane & Jung Citation2020). The parameterization of the function
is as follows:
In this equation, is the maximum developmental rate,
is the rearing temperature, and
and
are the optimum temperature where the development is highest and the shape parameter, respectively (Noor-ul-Ane & Jung Citation2020). Considering EquationEquations (1)
(1)
(1) and (Equation2
(2)
(2) ) together with EquationEquations (3)
(3)
(3) and (Equation4
(4)
(4) ), the model takes the following more specific form based on a biologically meaningful statement and some evidence from observations of brood maintenance:
In these equations, is the highest possible birth rate, γ is the loss of honey bees as a result of SHB invasion and
denotes the rate of natural mortality of honey bees. For additional temperature-dependent development function choice, α denotes the average number of SHBs that can be maintained for each bee, and
indicates the rate of natural mortality rate of SHBs. All parameters are nonnegative due to their biological relevance and are given here in their nondimensional form. Since the qualitative structure of this work is more relevant than the quantitative structure, using the system parameters and variables in their non-dimensional form is appropriate for numerical simulations. It should be noted that the meaningful range of dimensionless parameters differs from that of dimensional parameters in general.
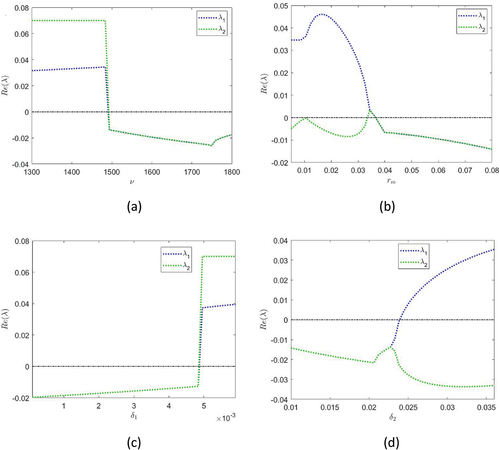
For the sake of brevity in analytical calculations, the real part of the eigenvalues of and
can be displayed as in to demonstrate the stability of the coexistence state
In , to see the effect of the selected control parameter on system stability for a given range, all parameter values are fixed as in the numerical simulations given in the following section. In the next section, the dynamical structure of the system will be illustrated numerically.
Figure 1. Bifurcation diagram of the coexistence state for different system parameters. The black line indicates the sign change of the eigenvalues.
Numerical simulations
Variations in brood temperature, as discussed in the introduction, influence the growth of SHB and thus the survival or collapse of the colony. The colony collapse in our model is caused by an excessive increase in the SHB population. To reflect the effect of increasing temperature T on SHB growth, r is transformed into a function of T. Since temperature is a function of time, r is also a function of time. As a result, we consider r = r(T), but keep the other parameters constant for the sake of brevity.
Brood nest temperature is known to fluctuate in the range of 32–36°C and the colonies spend much energy to keep it stable in this range (Seeley & Heinrich Citation1981; Kronenberg & Heller Citation1982). Based on fluctuations in brood temperature on all temporal scales, e.g. hourly and daily, a “realistic” temperature function considering those fluctuations is likely to be very complicated. However, as the intention of this study is to explore the effect of SHB growth theoretically rather than predictively, this level of detail appears excessive, at least for now. We define the possible choice of
, i.e. the linear function (Sekerci & Petrovskii Citation2015), to account for SHB growth in brood proper temperature varied between acceptable range for brood maintenance:
is the moment when the brood temperature begins to rise,
is the lower temperature of the brood when the SHB enters the brood and has a chance to grow in the proper area, and
quantifies the rate of temperature growth. The rate of temperature growth, i.e. ω, is chosen in accordance with the temporal scale of the system. Therefore, the change in temperature is chosen as intuitively meaningful hypothetical values in proportion to the temperature required for the growth of SHB. In this way, the evaluation of the system on its way to extinction is slowed down and the dynamic structure can be interpreted ecologically. Since r is now a function of T and T is a function of time, systems 5–6 becomes nonautonomous, and the results of the autonomous system are not simply applied. However, provided that r(T) is a slowly changing function, we presume that the properties of the corresponding autonomous system (i.e. with constant r) in various parameter ranges can provide a meaningful skeleton for understanding the effect of changes.
The numerical simulations of the honey bee–SHB population system, EquationEquations (5)(5)
(5) and (Equation6
(6)
(6) ) with increasing temperature
given by EquationEquation (7)
to detail the dynamical response of the system under the effect of SHB growth for the performed numerical simulations using MATLAB 2017a. The system parameters are set to hypothetical values, as
,
and
, and the initial value for honey bees is
and that of SHBs is
. The parameter values
,
,
are chosen appropriately (Ratti et al. Citation2013, Citation2015), and the rest of the parameters used are hypothetical.
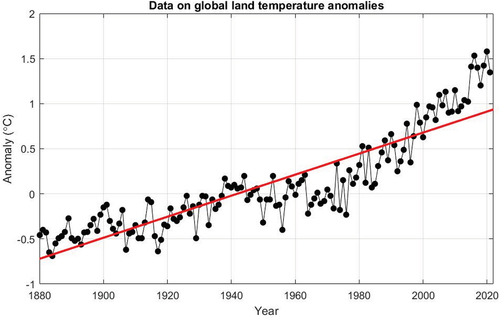
The global temperature varies significantly between years, as shown in . Although there is an obvious upward trend (Intergovernmental Panel on Climate Change Citation2014), the global temperature’s association to time is unclear. A meaningful climate change model needs to account for the details of temperature in order to produce a comprehensive specific forecast. Our purpose in this paper is not to be able to predict future climate change dynamics quantitatively. Instead, we want to obtain a qualitative understanding of the impact of rising global temperatures on the rate of SHB growth. For this reason (as in Petrovskii et al. Citation2017), it is essential to consider the overall trend rather than the details. To describe the tendency of temperature change, a simple linear function fitted to real data can be used, as shown by the thick red line in . In its simplest form, we can write the temperature dependence of the system on time as in EquationEquation (7).
Figure 2. NOAA Climate.gov graph of annual surface temperature from 1880 to 2020, based on National Centers for Environmental Information (NCEI) data (NOAA National Centers for Environmental information Citation2022). Using the Matlab curve fitting toolbox’s linear approximation, the thick red line indicates a linear approximation to field data determined between the relevant years.
Results
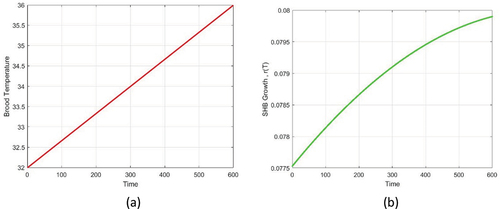
shows a sketch of temperature change over time and the developmental rate of SHB for the given change of temperature.
Figure 3. (a) Sketch of brood temperature versus time (red), where the lower and upper temperature are assumed to be 32 and 36°C, respectively; (b) sketch of SHB growth (green) over time.
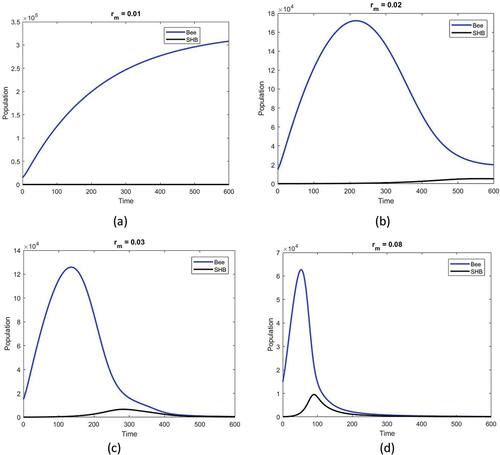
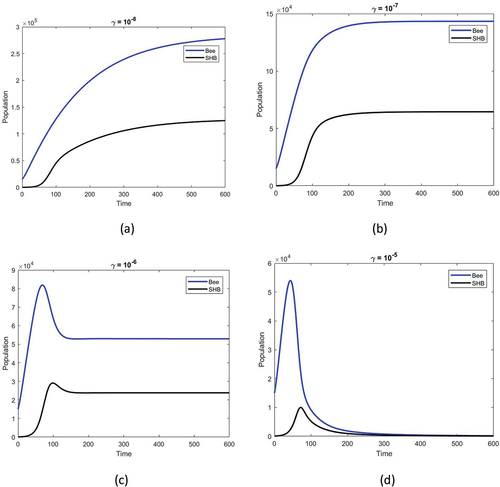
shows the population densities versus time obtained for different development rates of SHB for
,
and
. When SHB development falls below the critical threshold of
it is insufficient for brood growth. As a result, the SHB population remains close to zero, while the honey bee population grows over time and reaches its saturation value. As the development rate of SHB increases, so does its population, and honey bee populations begin to decline. This decline becomes faster when the rate of SHB growth increases.
Figure 4. Honey bee population (blue) and SHB population (black) against time obtained for given temperature function as in ). The rest of the parameters are the same as in the text. The figure shows the effect of the maximum developmental rate of SHB on the system dynamics for (a) , (b)
, (c)
and (d)
.
shows the population densities versus time obtained for different honey bee loss rates due to the strong rate of SHB invasion as . When the development rate of SHB is above the critical threshold, i.e.
, it is assumed that the invasion rate of SHB increases in time as
,
and
. For a lower invasion rate, such as
, both populations rise over time. If the invasion rate continues to rise, populations will reach saturation, which would lead to the extinction of honey bee colonies and SHBs.
Figure 5. Honey bee population (blue) and SHB population (black) against time obtained for a given temperature function, as in ). The rest of the parameters are the same as in the text. The effect of the maximum developmental rate of SHB on the system dynamics is fixed and the different SHB invasion rates γ are compared as (a) (b)
(c)
and (d)
shows the population densities versus time for various natural mortality rates of SHB. The increased mortality rate is assumed to be a result of temperature increase. Initially, with the given parameter set, both species exist for a short time but do not survive for long. With an increase in the SHB mortality rate parallel to the increasing temperature, both species are stabilized. With a further increase in SHB mortality rate, the coexistence state has now been replaced by a state in which only honey bees exist.
Figure 6. Honey bee population (blue) and SHB population (black) against time obtained for a given temperature function, as in ). The rest of the parameters are the same as in the text. The effect of the SHB death rate increases with an increase in temperature as (a) (b)
(c)
and (d)
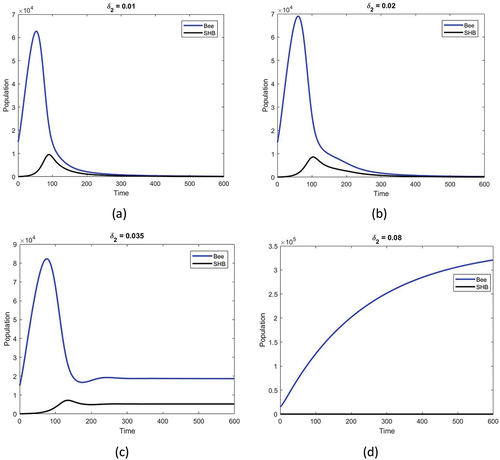
Our results indicate that when the bee hive reaches a critical temperature, failure of the colony is inevitable due to excessive growth of SHB (i.e. increase in ; see ) and an increase in the SHB invasion rate (i.e. increase in γ; see ). If the SHB mortality coefficient can be increased despite rising temperatures (i.e increase in
; see ), the system will be able to return to a state with only honey bees.
Discussion
Climate change and biological invasions are among the most serious global environmental threats (Petrovskii & Li Citation2005; Azzurro et al. Citation2019). They can interact with each other, either driving the extinction of the invasive species or increasing the damage it causes by altering the influence and distribution of invasive alien species. Although invasive species pose a threat to honey bee colonies, the effects of climate change on the severity of infestation by these species are still unknown (Cornelissen et al. Citation2019). SHB, a honey bee parasite native to Africa, is now present on almost all continents, including the Latin America region in South America (Calderón & Ramírez Citation2019; Cini et al. Citation2019; Pereira et al. Citation2021). Many studies show that the invasion success of this species is dependent on high humidity and temperature. SHBs can cause significant damage in countries that provide these favorable environmental conditions (Krishnan et al. Citation2015; Akinwande & Neumann Citation2018). In some countries, such as Turkey, SHB has not yet been detected, which may be due to the lack of suitable weather conditions for the species to survive or the fact that it has not yet arrived in these countries. Changing climates can affect the status of alien species, often making them more likely to settle or spread to areas currently considered environmentally unsuitable (Cornelissen et al. Citation2019). Assessing the risk of SHB invasion of currently uninvaded areas and potential changes in the severity of SHB impacts is extremely important, especially in changing climatic conditions. This information will be necessary to define strategies for managing infestation at different stages. Therefore, in this study, we evaluated the change of SHB and bee populations in a honey bee colony in Turkey, using a mathematical model, for the case of an increase in temperature of up to 6°C by 2099 due to climate change. Our results showed that SHB populations increased with rising temperature at high SHB growth rates and that the honey bee population decline became faster when the rate of SHB growth increased (). Many studies confirm that the rising temperature increases the SHB population, thus increasing the negative effects on bee colony health (Neumann & Elzen Citation2004; De Guzman et al. Citation2010; Cornelissen et al. Citation2019).
A study reported that a lethal temperature (LT50) of feeding larvae occurred sooner after exposure, at 4.9°C, than that of wandering larvae (3.7°C at 48 h) and pupae (5.6°C at 48 h) (Noor-ul-Ane & Jung Citation2021). It may not be transferred to the next beekeeping period, as the reproductive cycle of SHB will fall below the specified temperatures in the region. For instance, although SHB has been detected a few times in Canada, it could not survive in the colonies. This may be due to the Canadian climate not being warm enough at present to cause the SHB population to settle down (Bernier et al. Citation2014). These results show that falling temperatures (<3.7°C) in winter may prevent the transition of SHB to the next beekeeping period. The increase in temperature in winter due to climate change may affect the likelihood of survival in areas where SHB is currently unable to survive. A temperature increase of about 6°C due to climate change, especially on the coasts of the Mediterranean and Aegean Seas of Turkey, might cause the temperature to exceed the above-mentioned values, thus creating a suitable environment for the survival of SHB.
Climate change is likely to affect the frequency and intensity of extreme climatic events such as flooding rains, extended decadal droughts and heat waves, in certain regions of the world within the next few decades. Climate change models predict that global warming will drive an increase of rainfall and snowfall and increase the frequency and severity of extreme events (Greenville et al. Citation2012). Climate change is remarkable for being one possible cause of CCD, which is the most serious, abrupt die-off of honey bee colonies across the world (Switanek et al. Citation2017). Due to its interactive relationship with honey bees and ecology, global warming will create pressure on bee colonies, resulting in weak bee colonies more susceptible to biotic and abiotic stress factors (Varol & Yücel Citation2019). SHB prefers weak or failing colonies and only rarely targets healthy hives, reproducing more efficiently when the bee population is weak (Giangaspero & Turno Citation2015). Also, a positive correlation has been reported between SHB population levels and the losses observed in the relevant regions (Spiewok et al. Citation2007). In the current study, the mathematical model shows that increasing the level of SHB infestation (Rm, SHB growth rate) can result in increased SHB-induced damage to the bee colony (). Similarly, the model shows that increasing the invasion rate of SHB increases colony losses (). It is necessary to develop an effective pest management strategy for SHB that reduces high-level SHB transmission, helps to minimize the effects of climate change, and takes measures to reduce other bee pests and diseases.
Instead of linking our research to demonstrate the validation of our model using specific data, our goal is to detect the threat in principle. In a similar manner, we make no attempt to estimate the model parameters’ values. On the other hand, our model will serve as a baseline for future work, because there is no previous SHB–honey bee mathematical model in the literature. This method has the advantage of making the model semi-analytically tractable and of making it reasonably simple to show and understand how the model’s properties evolve in response to varied situations. Additionally, we consider that the model’s predictions have a significant level of generality since our model only considers highly generic, general-purpose interactions in the SHB–honey bee system.
In this paper, we consider a scenario in which the rate of SHB growth is accelerated by a linear increase in temperature. However, it has been reported in the literature that there is a temperature range for the possible growth of SHB (Noor-ul-Ane & Jung Citation2020, Citation2021). This means that at lower temperatures, SHB growth is expected to decrease. In this case, the scenario should be considered where a lower temperature hampers the growth of SHB with the help of a linear decrease in temperature, i.e. where ω < 0. Therefore, it is observed that the colony collapse and the SHB population will drop to zero once r(T) becomes small and will not support the existence of SHB. The performed numerical simulations show that for the latter case, the colony collapses and SHB becomes extinct.
The observed results have important ecological implications in terms of the detrimental consequences of global warming, such as possible colony collapse. Also, the fundamental motivation for the current study is to maintain strong colonies and use good husbandry to defend colonies against SHB, as stated by Cuthbertson et al. (Citation2013). Our data highlight the need to develop an effective pest management strategy for SHB, which is predicted to be a major problem in honey bee colonies in the future.
Disclosure statement
No potential conflict of interest was reported by the authors.
Data availability statement
The data that support the findings reported in this study are available from the corresponding author upon reasonable request.
Additional information
Funding
References
- Akinwande KL, Neumann P. 2018. Small hive beetle infestation levels of honey bee colonies correlate with precipitation and forest cover. Apidologie 49(4):517–525. DOI:10.1007/s13592-018-0579-x.
- Araneda X, Aldea P, Freire X. 2021. Small hive beetle (Aethina tumida Murray), A potential threat to beekeeping in Chile. Chilean Journal of Agricultural & Animal Sciences 37(1):3–10. DOI:10.29393/CHJAAS37-1SHXA30001.
- Aslan CE, Liang CT, Galindo B, Kimberly H, Topete W. 2016. The role of honey bees as pollinators in natural areas. Natural Areas Journal 36(4):478–488. DOI:10.3375/043.036.0413.
- Azzurro E, Sbragaglia V, Cerri J, Bariche M, Bolognini L, Ben Souissi J, … Moschella P. 2019. Climate change, biological invasions, and the shifting distribution of Mediterranean fishes: A large‐scale survey based on local ecological knowledge. Global Change Biology 25(8):2779–2792. DOI: 10.1111/gcb.14670.
- Bernardi S, Venturino E. 2016. Viral epidemiology of the adult Apis mellifera infested by the Varroa destructor mite. Heliyon 2(5):e00101. DOI: 10.1016/j.heliyon.2016.e00101.
- Bernier M, Fournier V, Giovenazzo P. 2014. Pupal development of Aethina tumida (Coleoptera: Nitidulidae) in thermo-hygrometric soil conditions encountered in temperate climates. Journal of Economic Entomology 107(2):531–537. DOI: 10.1603/EC13288.
- Britton NF, Jane White KA. 2021. The effect of covert and overt infections on disease dynamics in honey-bee colonies. Bulletin of Mathematical Biology 83(6):1–23. DOI: 10.1007/s11538-021-00892-6.
- Calderón RA, Ramírez M. 2019. New record of the small hive beetle, Aethina tumida, in africanized honey bee colonies in Costa Rica. Bee World 96(3):87–89. DOI: 10.1080/0005772X.2019.1579294.
- Cini A, Santosuosso U, Papini A. 2019. Uncovering the spatial pattern of invasion of the honey bee pest small hive beetle, Aethina tumida, in Italy. Revista Brasileira de Entomologia 63(1):12–17. DOI: 10.1016/j.rbe.2018.11.005.
- Cornelissen B, Neumann P, Schweiger O. 2019. Global warming promotes biological invasion of a honey bee pest. Global Change Biology 25(11):3642–3655. DOI: 10.1111/gcb.14791.
- Cuthbertson AG, Wakefield ME, Powell ME, Marris G, Anderson H, Budge GE, … Brown MA. 2013. The small hive beetle Aethina tumida: A review of its biology and control measures. Current Zoology 59(5):644–653. DOI: 10.1093/czoolo/59.5.644.
- Decourtye A, Alaux C, Le Conte Y, Henry M. 2019. Toward the protection of bees and pollination under global change: Present and future perspectives in a challenging applied science. Current Opinion in Insect Science 35:123–131. DOI: 10.1016/j.cois.2019.07.008.
- De Guzman LI, Frake AM. 2007. Temperature affects Aethina tumida (Coleoptera: Nitidulidae) development. Journal of Apicultural Research 46(2):88–93. DOI: 10.3827/IBRA.1.46.2.04.
- De Guzman LI, Frake AM, Rinderer TE. 2010. Seasonal population dynamics of small hive beetles, Aethina tumida Murray, in the south-eastern USA. Journal of Apicultural Research 49(2):186–191. DOI: 10.3896/IBRA.1.49.2.07.
- Demircan M, Gürkan H, Eskioğlu O, Arabaci H, Coşkun M. 2017. Climate change projections for Turkey: Three models and two scenarios. Turkish Journal of Water Science and Management 1(1):22–43. DOI: 10.31807/tjwsm.297183.
- Dixon D, Lafrenière R. 2002. Small hive beetle in Manitoba. Hivelights 15:29.
- Eberl HJ, Frederick MR, Kevan PG. 2010. Importance of brood maintenance terms in simple models of the honeybee-Varroa destructor-acute bee paralysis virus complex. Electronic Journal of Differential Equations 85–98.
- Fell RD. 1999. The small hive beetle: A new pest of honey bee colonies. In: General applied entomology. Blacksburg, VA: 10p. Department of Entomology, Virginia Tech. Vol. 34. pp. 29–31.
- Gabbriellini G. 2017. Seasonal effects on honey bee population dynamics: A nonautonomous system of difference equations. arXiv preprint arXiv:1708.09416.
- Giangaspero M, Turno P. 2015. Aethina tumida, an exotic parasite of bees, Clin. Microbiol 4:e128.
- Gillespie P, Staples J, King C, Fletcher MJ, Dominiak BC. 2003. Small hive bettle,’Aethina tumida’(Murray)(Coleoptera: Nitidulidae) in New South Wales. General and Applied Entomology: The Journal of the Entomological Society of New South Wales 32:5–7.
- Giovenazzo P, Boucher C. 2010. A scientiÞc note on the occurrence of the small hive beetle (Aethina tumida Murray) in Southern Quebec. American Bee Journal 150:275Ð276.
- Greenville AC, Wardle GM, Dickman CR. 2012. Extreme climatic events drive mammal irruptions: Regression analysis of 100‐year trends in desert rainfall and temperature. Ecology and Evolution 2(11):2645–2658. DOI: 10.1002/ece3.377.
- Haque NMM, Levot GW. 2005. An improved method of laboratory rearing the small hive beetle Aethina tumida Murray (Coleoptera: Nitidulidae). Entomologia Generalis/Journal of.
- Hood WM. 2004. The small hive beetle, Aethina tumida: A review. Bee World 85(3):51–59. DOI: 10.1080/0005772X.2004.11099624.
- Intergovernmental Panel on Climate Change. 2014. Climate change 2014: Synthesis report. Contribution of working groups I., II and III to the fifth assessment report of the intergovernmental panel on climate change (Core writing team). Geneva: IPCC.
- Khoury DS, Barron AB, Myerscough MR. 2013. Modelling food and population dynamics in honey bee colonies. PloS one 8(5):e59084. DOI: 10.1371/journal.pone.0059084.
- Khoury DS, Myerscough MR, Barron AB. 2011. A quantitative model of honey bee colony population dynamics. PloS one 6(4):e18491.
- Krishnan KT, Neumann P, Ahmad AH, Pimid M. 2015. A scientific note on the association of Haptoncus luteolus (Coleoptera: Nitidulidae) with colonies of multiple stingless bee species. Apidologie 46(2):262–264. DOI: 10.1007/s13592-014-0312-3.
- Kronenberg F, Heller HC. 1982. Colonial thermoregulation in honey bees (Apis mellifera). Journal of Comparative Physiology 148(1):65–76. DOI: 10.1007/BF00688889.
- Meikle WG, Patt JM. 2011. The effects of temperature, diet, and other factors on development, survivorship, and oviposition ofAethina tumida (Coleoptera: Nitidulidae). Journal of Economic Entomology 104(3):753Ð763. DOI: 10.1603/EC10364.
- Misra AK. 2014. Climate change and challenges of water and food security. International Journal of Sustainable Built Environment 3(1):153–165. DOI: 10.1016/j.ijsbe.2014.04.006.
- Mürrle T, Neumann P. 2004. Mass production of small hive beetles (Aethina tumida, Coleoptera: Nitidulidae). Journal of Apicultural Research 43(3):144–145. DOI: 10.1080/00218839.2004.11101125.
- Nasr M. 2006. Small hive beetlein Alberta. Hivelights 19:15.
- Neumann P, Elzen PJ. 2004. The biology of the small hive beetle (Aethina tumida, Coleoptera: Nitidulidae): Gaps in our knowledge of an invasive species. Apidologie 35(3):229–247. DOI: 10.1051/apido:2004010.
- Neumann P, Pettis JS, Schäfer MO. 2016. Quo vadis Aethina tumida? Biology and control of small hive beetles. Apidologie 47(3):427–466.
- Neumann P, Pirk CWW, Hepburn R, Elzen PJ, Baxter JR. 2001. Laboratory rearing of small hive beetles Aethina tumida (Coleoptera, Nitidulidae). Journal of Apicultural Research 40(3–4):111–112. DOI: 10.1080/00218839.2001.11101059.
- NOAA National Centers for Environmental information. 2022. Climate at a glance: Global time series. Available: https://www.ncdc.noaa.gov/cag/. Accessed Feb 2022 10.
- Noor-ul-Ane M, Jung C. 2020. Temperature-dependent development and survival of small hive beetle, Aethina tumida (Coleoptera: Nitidulidae). Journal of Apicultural Research 59(5):807–816. DOI: 10.1080/00218839.2020.1740406.
- Noor-ul-Ane M, Jung C. 2021. Characterization of Cold Tolerance of Immature Stages of Small Hive Beetle (SHB) Aethina tumida Murray (Coleoptera: Nitidulidae). Insects 12(5):459. DOI: 10.3390/insects12050459.
- Önol B, Unal YS. 2014. Assessment of climate change simulations over climate zones of Turkey. Regional Environmental Change 14(5):1921–1935. DOI: 10.1007/s10113-012-0335-0.
- Pereira SN, Alves LHS, da Costa RFR, Prezoto F, Teixeira EW. 2021. Occurrence of the small hive beetle (Aethina tumida) in Melipona rufiventris colonies in Brazil. Sociobiology 68(1):e6021–e6021. DOI: 10.13102/sociobiology.v68i1.6021.
- Petrovskii SV, Li BL. 2005. Exactly solvable models of biological invasion. New York: Chapman and Hall/CRC.
- Petrovskii S, Sekerci Y, Venturino E. 2017. Regime shifts and ecological catastrophes in a model of plankton-oxygen dynamics under the climate change. Journal of Theoretical Biology 424:91–109. DOI: 10.1016/j.jtbi.2017.04.018.
- Pradhan S. 1945. Rate of insect development under variable temperatures of the field. Proceedings of the National Institute of Sciences of India 11(73):80.
- Ratti V, Kevan PG, Eberl HJ. 2013. A mathematical model for population dynamics in honey bee colonies infested with Varroa destructor and the acute bee paralysis virus. Canadian Applied Mathematics Quarterly 1–27.
- Ratti V, Kevan PG, Eberl HJ. 2015. A mathematical model of the honeybee–Varroa destructor–acute bee paralysis virus system with seasonal effects. Bulletin of Mathematical Biology 77(8):1493–1520. DOI: 10.1007/s11538-015-0093-5.
- Roth MA, Wilson JM, Gross AD. 2022. Biology and management of small hive beetles (Coleoptera: Nitidulidae): A pest of european honey bee (Hymenoptera: Apidae) colonies. Journal of Integrated Pest Management 13(1):7. DOI: 10.1093/jipm/pmac005.
- Seeley TD, Heinrich B. 1981. Insect thermoregulation. Heinrich, Ed. New York: John Wiley and Sons. p. 340.
- Sekerci Y, Petrovskii S. 2015. Mathematical modelling of plankton–oxygen dynamics under the climate change. Bulletin of Mathematical Biology 77(12):2325–2353. DOI: 10.1007/s11538-015-0126-0.
- Smith KM, Loh EH, Rostal MK, Zambrana-Torrelio CM, Mendiola L, Daszak P. 2013. Pathogens, pests, and economics: Drivers of honey bee colony declines and losses. EcoHealth 10(4):434–445. DOI: 10.1007/s10393-013-0870-2.
- Spiewok S, Pettis JS, Duncan M, Spooner-Hart R, Westervelt D, Neumann P. 2007. Small hive beetle, Aethina tumida, populations I: Infestation levels of honey bee colonies, apiaries and regions. Apidologie 38(6):595–605. DOI: 10.1051/apido:2007042.
- Sumpter DJ, Martin SJ. 2004. The dynamics of virus epidemics in Varroa‐infested honey bee colonies. Journal of Animal Ecology 73(1):51–63. DOI: 10.1111/j.1365-2656.2004.00776.x.
- Switanek M, Crailsheim K, Truhetz H, Brodschneider R. 2017. Modelling seasonal effects of temperature and precipitation on honey bee winter mortality in a temperate climate. Science of the Total Environment 579:1581–1587. DOI: 10.1016/j.scitotenv.2016.11.178.
- Taylor F. 1981. Ecology and evolution of physiological time in insects. The American Naturalist 117(1):1–23. DOI: 10.1086/283683.
- Toufailia HA, Alves DA, Bená DDC, Bento JMS, Iwanicki NSA, Cline AR et al. 2017. First record of small hive beetle, Aethina tumida Murray, in South America. Journal of Apicultural Research 56(1):76–80. DOI: 10.1080/00218839.2017.1284476.
- Varol E, Yücel B. 2019. The effects of environmental problems on honey bees in view of sustainable life. Mellifera 19(2):23–32.
- Yamada Y, Yamada T, Yamada K. 2019. A mathematical model to estimate the seasonal change in apparent longevity of bee colony. Scientific Reports 9(1):1–9. DOI: 10.1038/s41598-019-40725-0.