
Abstract
An in situ analysis of mucin secretions along the annual cycle was performed on the striped Venus clam, Chamelea gallina. Individuals of both sexes from an exploited stock of Margherita di Savoia (Southern Adriatic Sea, Central Mediterranean Sea) were made in June 2020 and 2021, and in January 2021 and 2022, representative of summer and winter seasons, respectively. Tissues from the foot and the gills were analyzed for histochemical and lectin-histochemical analyses. Staining with Periodic Acid-Schiff, Alcian Blue pH 2.5 and High-Iron-Diamine indicated that mucins from both the foot and the gills were acidic, mostly sulfated. Lectin-binding analyses with PNA, SBA, WGA, LTA, UEA-I, AAA, SNA, MAA-II and ConA indicated the presence of N-acetyl-glycosaminylated, mannosylated and fucosylated residuals in the saccharidic chains. In the gills, the amount of acidic and glycosaminylated residuals was higher in summer in both sexes, whereas fucosylation was similar along the sampling period and mannosylation was never observed. In the foot, both surface epithelial and subepidermal secreting cells increased sulfation in winter in males, but not in females. Glycosaminylation and fucosylation were observed only in the surface cells of males. Mannosylated residuals were observed in all the foot cell types in both sexes. It is hypothesized that the observed qualitative and quantitative variations in mucin secretion is linked to the reproductive cycle.
Highlights
The mucocytes present in the gill filaments of the clam produce an acid mucus, with sulfate residues and N-acetylglucosamine and fucose chains.
In the foot, the subepithelial mucocytes produce an acidic, sulfate secretion with mannosylated residuals.
The foot epithelium shows an acidic, sulfated mucus composition with N-acetylglucosamine, fucose and mannose chains.
The results show that males have greater variability in mucus composition.
The observed variation could be related to different energy allocation between sexes in the development of gametes.
Introduction
Mucins are highly glycosylated proteins representing major components of the mucus secreted by the epithelia of mollusks. They are involved in several functions, such as filter feeding, digestion, breathing and cleaning of the mantle cavity, protection against predators and pathogens, adhesion and/or penetration in the substrate, osmoregulation, biomineralization, intra- or interspecific signaling by luminescence (Bolognani-Fantin et al. Citation1969; Prezant Citation1990; Jørgensen Citation1996; Davies & Hawkins Citation1998; Espinosa et al. Citation2009). Moreover, the mucins dispersed in the environment in pseudofaeces contribute to the particulate organic matter in coastal waters (Davies & Hawkins Citation1998). In the mucin structure, the oligosaccharidic chains are usually attached to the protein backbone by an α-O-glycosidic linkage to a serine or a threonine. Variations in glycosylation and/or carbohydrate composition of the saccharidic chains affect the viscoelastic, lubricating and hydration properties and thus the functions of mucus (Bansil & Turner Citation2018). Despite their importance, studies about mucin compositions, distribution and variation in molluscan secretions are still scarce. Classical histochemical studies indicate only that the oligosaccharidic chains in the mucus can be neutral or acidic, due to the presence of carboxylated or sulfated residuals (e.g., Bolognani-Fantin et al. Citation1969; Ottaviani et al. Citation1990; Albanese & Calabrò Citation1996; Eble Citation2001; Calabrò et al. Citation2005; Petraccioli et al. Citation2013). In situ studies about the composition of the oligosaccharidic chains are scarcer and indicate the presence of mannosylated, glycosaminylated, galactosyl/galactosaminylated and fucosylated residuals, whereas the presence of sialic acid is debated (e.g., Ahn et al. Citation1988; Ottaviani et al. Citation1990; Albanese & Calabrò Citation1996; Robledo et al. Citation1997; Calabrò et al. Citation2005; Bravo Portela et al. Citation2012; Petraccioli et al. Citation2013). Glycosylation has been observed to vary from one secreting cell type to another, distributed in different anatomical districts of the mollusks such as the mantle, the foot, the gills, or the digestive gland (e.g., Bolognani-Fantin et al. Citation1969; Beninger & St-Jean Citation1997; Eble Citation2001; Calabrò et al. Citation2005; Nogarol et al. Citation2012; Bilgin & Uluturhan-Suzer Citation2017). Besides, in some classes of this phylum such as gastropods and cephalopods, the composition of mucins has been observed to change in a same cell type in relation to physical variables (hydrodynamism, salinity, temperature, humidity) or animal activities (reproduction, growth, locomotion, reproduction and feeding) (e.g., Davies et al. Citation1990; Petraccioli et al. Citation2013; Accogli et al. Citation2017). Moreover, qualitative and quantitative variation of mucins have also been demonstrated to be affected by pollutants, suggesting that their variations can be used as a biomarker (e.g., David & Fontanetti Citation2009; Cutuli et al. Citation2021; Guglielmi et al. Citation2022). Being filter-feeding organisms capable of consuming pollutants from the environment, the bivalves are widely used in the monitoring of water quality (Goldberg Citation1975; Kádár et al. Citation2001; March et al. Citation2007; Helmholz et al. Citation2016) and they are regarded as a model for human health (Fernández Robledo et al. Citation2019).
With all the previous as reference, we performed a qualitative and quantitative in situ analysis of mucin secretion along the annual cycle of a commercial mollusk bivalve, the striped Venus clam, Chamelea gallina (L., 1758). This species is common in well-sorted sand biocenosis (Pérès Citation1967; Montefalcone et al. Citation2021) along the shallow coastal areas of the western Atlantic, from Norway to North Africa, as well as along the Mediterranean and the Black Sea coasts (Orban et al. Citation2007; Begun et al. Citation2022). Therefore, knowledge about the mucin composition in this species and its variation in relation to sex or season could represent a reference point for further studies in which biomarkers from this species will be used in responses to environmental stresses.
Material and methods
Study animals
Commercial-sized individuals of C. gallina were sampled by a commercial clam dredger in an exploited fishing ground of Margherita di Savoia (BT) in Southern Adriatic Sea (Cascione et al. Citation2022).
Four samplings were carried out in June 2020, January, and June 2021 and January 2022, representative of summer and winter conditions, in which the gonads are in different stages of development (Erkan & Sousa Citation2002; Dalgiç et al. Citation2009; Erkan Citation2009; Delgado et al. Citation2013). Animals collected were immediately transported to the University of Bari, and 10 specimens for each sampling were randomly selected (shell length, mean ± SD: 27.5 ± 2.8 mm; weight with shell 6.1 ± 2.1), sedated with magnesium chloride (Ross & Ross Citation2009) and fixed in 4% seawater buffered formalin for 24 h. Subsequently, the individuals were washed in freshwater and dehydrated in a graded series of ethanol for paraffin embedding. Sections, 5 μm-thick, were cut and collected on slides. A preliminary stain of sections with Toluidine blue was made to observe the general morphology of animals, sex determination and stage of gametogenesis in the gonads according to Dalgiç et al. (Citation2009) and Delgado et al. (Citation2013). Since different gametogenic stages were seen simultaneously in the same individual, their reproductive status was defined based on the most representative condition (Delgado et al. Citation2013).
Samples of clams were selected for mucin analyses in the gill and foot epithelium
Histological and histochemical staining
General detection of carbohydrates with 1,2 vicinal diols was performed with Periodic-Acid Schiff (PAS: McManus Citation1948). Since the mucins are rich in O-linked oligosaccharidic chains, their presence was demonstrated by removing them with β-elimination (Ono et al. Citation1983) followed by PAS staining. The sections were incubated with 0.2 M KOH in a solution of dimethylsulphoxide, water and ethanol (50:40:10) for 1 h at 45°C, then neutralized with 10 mM HCl and washed in phosphate-buffered saline (PBS) with pH 7.4 prior to making the PAS staining (refer to Mastrodonato et al. Citation2009, for further details). If PAS-positivity is due to mucins, its reduction or disappearance is expected after β-elimination, as observed by Petraccioli et al. (Citation2013) in the foot of the limpet Patella caerulea. A diastase-PAS (Lillie & Greco Citation1947) was also performed to detect glycogen, as in Mentino et al. (Citation2017). Before PAS-staining, the sections were incubated with 0.8% diastase in PBS in a humid chamber at 37°C overnight. In this case, the reduction of PAS positivity is explained by the removal of glycogen. Alcian Blue pH 2.5 (AB2.5) was used to detect acidic carbohydrates (Steedman Citation1950), while High-Iron-Diamine (HID: Spicer et al. Citation1978) was performed to detect sulfated carbohydrates. In all essays, counterstain with hematoxylin was performed to evidence the nuclei. Details about these histochemical techniques can be found in Scillitani et al. (Citation2011). All the chemicals cited in this section were from Sigma-Aldrich (St. Louis, MO, USA).
Lectin binding experiments
Binding of nine fluorescein-isothiocyanate (FITC) conjugated lectins (PNA, SBA, WGA, LTA, UEA-I, AAA, SNA, MAA II, ConA) was performed to characterize the structure and distribution of the oligosaccharidic chains of the mucins. Lectins were selected among those detecting the most common oligosaccharidic chains in mollusks (e.g., Ottaviani et al. Citation1990; Calabrò et al. Citation2005; Petraccioli et al. Citation2013; Accogli et al. Citation2017). Details about lectin common names and sugar specificities are shown in . Binding was obtained by incubating the rehydrated sections in the dark for 1 hour at room temperature with lectin diluted in 10 mM Hepes pH 7.5, or in 100 mM PBS pH 7.4 (buffer details and working concentrations for each lectin are in ). Sections were then rinsed in the same buffer and mounted with Fluoromount™ Aqueous Mounting Medium F4680 for observation. For PNA and SBA lectins, binding experiments were also performed after desulfation (as reported in Scillitani & Mentino Citation2015). The specificity of the lectins was tested by substituting the lectin solution with the buffer alone or preincubating the sections with the corresponding hapten sugar inhibitor (sugar types and concentration are in ). Specificity was also tested by binding to samples from other sources presenting mucins that were previously demonstrated to be labelled by lectins tested in this paper (Petraccioli et al. Citation2013; Accogli et al. Citation2017). The chemicals cited were from Sigma-Aldrich Inc. (St. Louis, MO, USA); lectins were from Vector Laboratories (Burlingame, CA, USA) except for AAA and MAA-II from US Biological (Salem, MA, USA).
Table I. FITC-Lectins used with related binding specificity, diluting buffer, working dilution and inhibiting sugars used in negative control experiments.
Image and quantitative analysis
Brightfield histological images were acquired using a Nikon Eclipse E600 microscope equipped with DA-Fi3 microscope-camera (Nikon Instruments SpA, Campi Bisenzio, FI, Italy), and acquisition software NIS-Elements D 5.30.00 64-bit. The same microscope equipped with an epifluorescence device under 495 nm light emission was used for the acquisition of the images documenting lectin-binding.
For each stain or lectin experiment, 10 images per individual were taken (five for the foot and five for the gills). In each image, 10 to 20 cells of each type having the best orientation were selected for the analyses.
For conventional histochemistry (PAS, AB pH 2.5, HID), the intensity of staining was estimated by computing optical density (OD) values. Colour deconvolution (Ruifrok & Johnston Citation2001) was used to isolate colour channels resulting from staining and to exclude the counterstaining and the background (Mastrodonato et al. Citation2020). Similarly, lectin-binding intensity was estimated by computing the corrected total cell fluorescence (CTFC) (McCloy et al. Citation2014). Computations for image analysis were obtained with the Fiji package by ImageJ (Rasband Citation2022) implemented with the colour deconvolution plug-in (Landini et al. Citation2021).
Mean OD or CTFC values from each staining, cell type and condition were compared by One-Way Analysis of Variance (ANOVA) followed by resampling through a 10.000-iteration bootstrap of the F-stat values (e.g., Carlucci et al. Citation2022). Differences between means by post-hoc pairwise comparisons were tested by Tukey’s Honestly-Significant-Difference (THSD). Significance of probability was set at p < 0.01. Statistical computations were generated by the Real Statistics Resource Pack plugin for Excel (Release 4.3: Zaiontz Citation2020).
Results
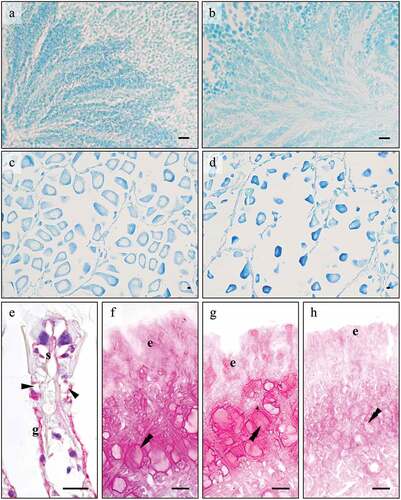
The preliminary histological analysis identified 24 males and 16 females. Both sexes were in reproduction period in June (2020 and 2021), with mature gametes observed in the gonads ()). There were several bands of spermatocytes in males ()) and many large oocytes, most free from peduncles in females ()), in some cases with partial release. By January (2021 and 2022), the specimens were in gametogenesis. In males many spermatocyte bands were already visible ()), whereas females showed with small, pedunculated oocytes ()).
Figure 1. Tissues of the striped Venus clam, Chamelea gallina treated with histological and histochemical stains. (a-d) Gonads stained with Toluidine Blue. In the male gonad (a-b) little variation in the number of sperms is observed between January (e) and June (f), suggesting that spermatogenesis is already in an advanced state in the former period. In the female gonad (c-d) early ovogenetic stages are observed in January (g) in respect to June (h), where mature eggs ready to spawn are seen. (e) Gill epithelium, PAS-Hematoxylin. Mucocytes (arrowhead) on gill filaments are always PAS negative. Positivity is sometimes observed on the glycocalyx (g) and chitin skeleton (s). (f-h) Foot epithelium stained with PAS (f), diastase-PAS (dPAS) (g), and β-elimination-PAS (βPAS) (h) methods. PAS positivity does not vary with dPAS whereas is reduced with βPAS, indicating that positivity in the surface (e) and subepidermal cells (double arrowhead) is due to mucins with O-linked saccharidic chains and not to glycogen. Abbreviations: e, surface cells; g, glycocalyx; s, chitin skeleton of gill filament; Scale bars: 10 µm.
Histological and histochemical staining
The gills of C. gallina present several filaments with a ciliated frontal region ()). One main mucocyte is seen on each side of the filament ()). In the foot, two secreting cell types are observed, arranged into groups, i.e., surface and subepidermal cells. Single surface cells are distributed among the ciliated cells in the apical surface epithelium, whereas the subepidermal cells are observed in the connective tissue underlying the surface epithelium and are clustered in pluricellular glands ()).
PAS staining resulted always negative ()) in the gills, whereas it was positive in both the surface and subepidermal foot cells ()). PAS-positivity persisted after the diastase treatment, indicating that the stained glycans are not glycogen ()). On the contrary, PAS-positivity greatly decreased after β-elimination ()), suggesting that the saccharidic chains were removed because they are O-linked and thus confirming that PAS-stained glycans are mucins. PAS-positivity in the foot glands showed a significant variation among seasons (), with a decrease observed in both sexes in January (ANOVA: surface cells, F7, 1958 = 1461.465, p = 0.000; subepidermal cells F7, 2005 = 124.268, p = 0.000).
Figure 2. PAS staining of secretory cells in the foot of male (a-h), and female (i-p) C. gallina. For each sex, the top images (a-d for males; i-l for females) show the variation of secretion between summers (June) and winters (January) conditions in the surface cells (e), whereas the bottom images (e-h for males; m-p for females) shows the stain of subepidermal glands (arrowheads) in the same periods. (q) Plot of mean OD values for male surface cells (black), female surface cells (white), male subepidermal cells (striped), and female subepidermal cells (dotted). Summer values (June 20 and June 21) are significantly higher than the corresponding winter ones (January 21 and January 22), except for subepidermal cells in females (Fs). Abbreviations: Fe, surface cell in female; Fs, subepidermal cell in female; Me, surface cell in male; Ms, subepidermal cell in male. Scale bars: 10 µm.
AB pH 2.5 staining was positive in both the gills and the foot glands (). In the gills, OD intensity in both sexes decreased significantly in January (ANOVA: F7, 3977 = 1593,487; p = 0.000). Similar to the gills, AB positivity in the foot cells () decreased significantly in both sexes in January (ANOVA: surface cells, F7, 1967 = 156.062, p = 0.000; subepidermal cells F7, 1994 = 449.034, p = 0.000).
Figure 3. Alcian Blue pH 2.5 staining of mucocytes (arrowhead) on the gill filaments of male (a-d) and female (e-h) C. gallina. (i) Plot of mean OD values for gill mucocytes in males (black) and females (white) shows that summer values are significantly higher than the corresponding winter ones (January 21 and January 22). Abbreviations: F, female; M, male. Scale bars: 10 µm.
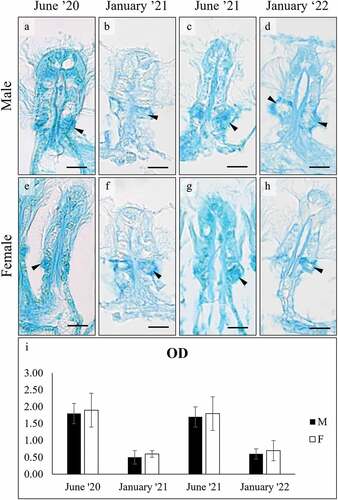
Figure 4. Alcian Blue pH 2.5 staining of secretory cells in the foot of male (a-h), and female (i-p) C. gallina. For each sex, the top images (a-d for males; i-l for females) show the variation of secretion between summers (June) and winters (January) conditions in the surface cells (e), whereas the bottom images (e-h for males; m-p for females) shows the stain of subepidermal glands (arrowheads) in the same periods. (q) Plot of mean OD values for male surface cells (black), female surface cells (white), male subepidermal cells (striped), and female subepidermal cells (dotted). Summer values (June 20 and June 21) are significantly higher than the corresponding winter ones (January 21 and January 22). Abbreviations: Fe, surface cell in female; Fs, subepidermal cell in female; Me, surface cell in male; Ms, subepidermal cell in male. Scale bars: 10 µm.
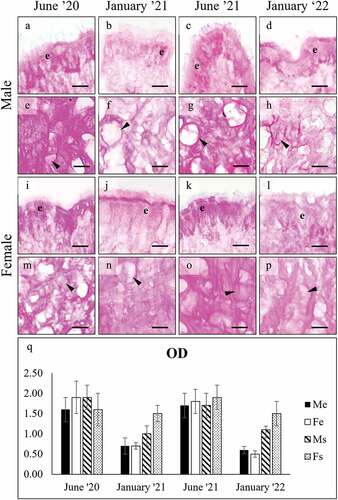
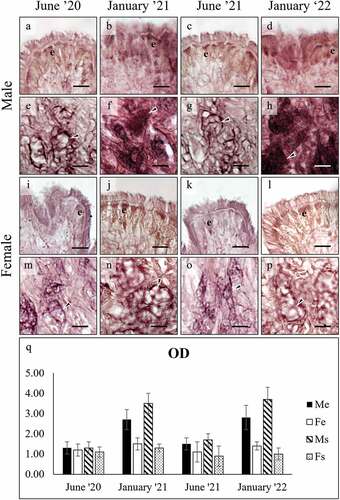
HID stained the gill filament mucocytes in both sexes () and significant seasonal variation was found (ANOVA: F7, 3983 = 2345,65; p = 0.000), but patterns differed between sexes: in males, a higher intensity was observed in June ()), whereas in females, it was observed in January ()). In the foot (), significant seasonal variation was observed for both secreting cells ()) in the males only (ANOVA: surface cells, F7, 1987 = 728.254, p = 0.000; subepidermal cells F7, 1991 = 3203.789, p = 0.000).
Figure 5. High Iron Diamine (HID) staining of mucocytes (arrowhead) on the gill filaments of male (a-d) and female (e-h) C. gallina. (i) Plot of mean OD values for gill mucocytes in males (black) and females (white) shows that summer values are significantly higher than the corresponding winter ones (January ’21 and January ’22) in males, whereas the opposite is seen in females. Abbreviations: F, female; M, male. Scale bars: 10 µm.
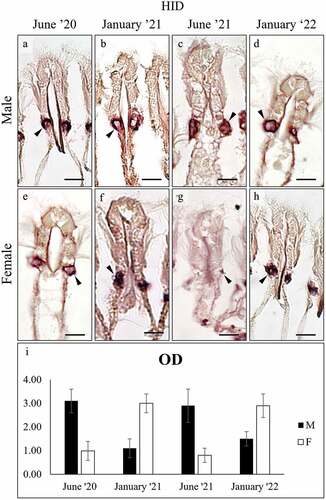
Figure 6. High Iron Diamine (HID) staining of secretory cells in the foot of male (a-h), and female (i-p) C. gallina. For each sex, the top images (a-d for males; i-l for females) show the variation of secretion between summers (June) and winters (January) conditions in the surface cells (e), whereas the bottom images (e-h for males; m-p for females) shows the stain of subepidermal glands (arrowheads) in the same periods. (q) Plot of mean OD values for male surface cells (black), female surface cells (white), male subepidermal cells (striped), and female subepidermal cells (dotted). Summer values (June 20 and June 21) in males are significantly lower than the corresponding winter ones (January 21 and January 22). In female moderate, non-significant variation is seen. Abbreviations: Fe, surface cell in female; Fs, subepidermal cell in female; Me, surface cell in male; Ms, subepidermal cell in male. Scale bars: 10 µm.
Lectin binding experiments
Only three lectins (WGA, AAA and ConA) bound to the clam tissues.
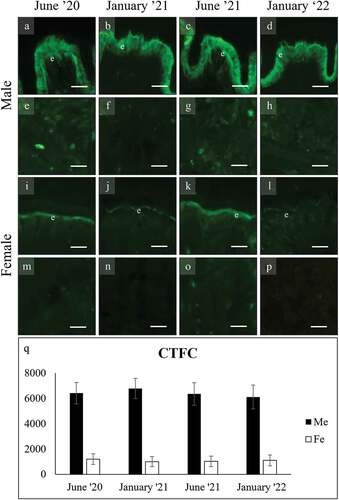
WGA stained both the gills and the foot secreting cells with significant variation among seasons. In the gills () the mucocytes of both sexes stained more intensely in June than in January (ANOVA: F7, 4003 = 1145.330; p = 0.000). A second mucocyte was stained in a more apical position with respect to the main lateral one (). In the foot, WGA stained intensely the surface cells and the glycocalyx of males ()) (F7, 1987 = 728.254, p = 0.000) while those of females were significantly less intense ()), without season variation. The subepidermal cells of females did not stain ()).
Figure 7. WGA binding of mucocytes (arrowhead) on the gill filaments of male (a-d) and female (e-h) C. gallina. WGA binds also to the chitin skeleton of filaments (s) and to a second type of mucocyte (asterisk) in the frontal area. (i) Plot of mean CTFC values for gill main mucocytes in males (black) and females (white) shows that summer values are significantly higher than the corresponding winter ones (January 21 and January 22). Abbreviations: F, female; M, male; s, chitin skeleton of gill filament; *, frontal mucocyte. Scale bars: 10 µm.
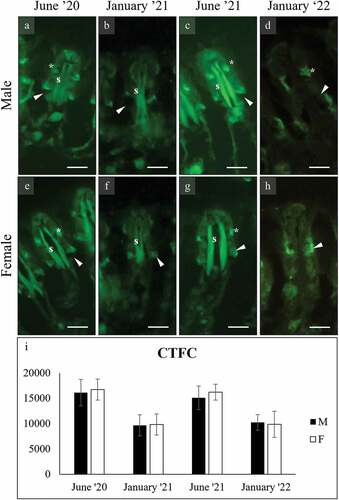
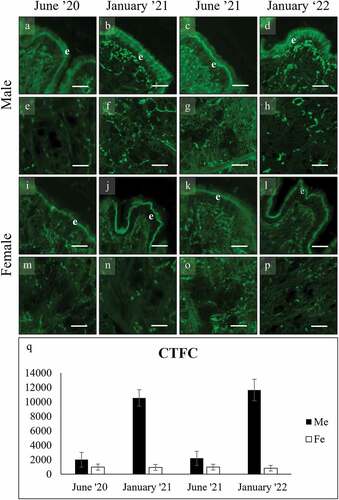
Figure 8. WGA binding of secretory cells in the foot of male (a-h), and female (i-p) C. gallina. The top images (a-d for males; i-l for females) show the variation of secretion between summers (June) and winters (January) conditions in the surface cells (e). Surface cells and glycocalyx stain intensely in males and weakly in females. The bottom images (e-h for males; m-p for females) shows that subepidermal glands never bind. (q) Plot of mean CTFC values for male surface cells (black) and female surface cells (white). Values in males are high in each month, while in females they are significantly lower. Abbreviations: F, surface cell in female; Me, surface cell in male. Scale bars: 10 µm.
In the gills, the AAA stained intensely the mucocytes of males and females in each season (). In the foot, the only cells stained by AAA were the surface ones in males ()), with a significant increase in January (F7, 2002 = 6265.066, p = 0.000). Glycocalyx was stained in both male and female surface cells ()).
Figure 9. AAA binding of mucocytes (arrowhead) and glycocalyx (g) on the gill filaments of male (a-d) and female (e-h) C. gallina. AAA binds occasionally also to the frontal mucocytes (asterisk). Binding is intense for both sexes in each season. chitin skeleton of filaments (s) and to a second type of mucocyte (asterisk) in the frontal area. (i) Plot of mean CTFC values for gill main mucocytes in males (black) and females (white) shows high, almost constant values between sexes among seasons. Abbreviations: F, female; g, glycocalyx; M, male; *, frontal mucocyte. Scale bars: 10 µm.
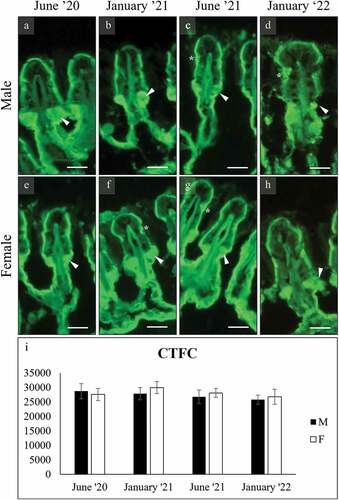
Figure 10. AAA binding of secretory cells in the foot of male (a-h), and female (i-p) C. gallina. The top images (a-d for males; i-l for females) show that surface cells (e) stain only in males in January. The glycocalyx stain intensely in males and weakly in females. The bottom images (e-h for males; m-p for females) shows that subepidermal glands never bind. (q) Plot of mean CTFC values for male surface cells (black) and female surface cells (white). Values in males are significantly high in January. Abbreviations: Fe, surface cell in female; Me, surface cell in male. Scale bars: 10 µm.
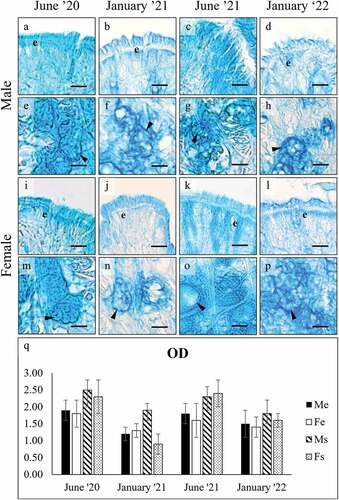
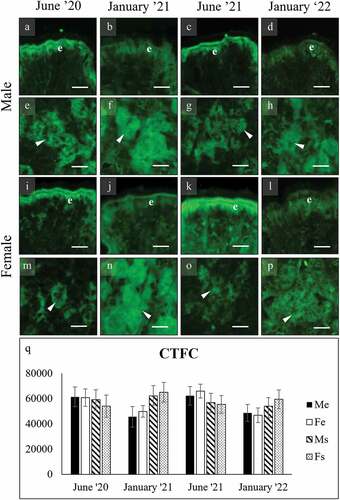
ConA did not stain the gills, whereas both the secreting cells in the foot and the surface glycocalyx were bound intensely (). In both sexes, a significant increase was observed in June with respect to January ()), whereas the opposite was found in the subepidermal glands ()) (ANOVA: surface cells, F7, 1949 = 347.566, p = 0.000; subepidermal cells F7, 2001 = 65.304, p = 0.000).
Figure 11. ConA binding of secretory cells in the foot of male (a-h), and female (i-p) C. gallina. For each sex, the top images (a-d for males; i-l for females) show the variation of secretion between summers (June) and winters (January) conditions in the surface cells (e), whereas the bottom images (e-h for males; m-p for females) shows the stain of subepidermal glands (arrowheads) in the same periods. (q) Plot of mean OD values for male surface cells (black), female surface cells (white), male subepidermal cells (striped) and female subepidermal cells (dotted). In the surface cells summer values (June 20 and June 21) are significantly higher than the corresponding winter ones (January 21 and January 22), whereas the opposite is seen in the subepidermal cells. Abbreviations: Fe, surface cell in female; Fs, subepidermal cell in female; Me, surface cell in male; Ms, subepidermal cell in male. Scale bars: 10 µm.
Discussion
The gill and foot epithelia of C. gallina are similar to those observed in other species of the same family Veneridae, such as Mercenaria mercenaria (Eble Citation2001) and Ruditapes philippinarum (Calabrò et al. Citation2005). Positivity to AB pH 2.5 and HID indicates that the mucins secreted by this species from both the gills and the foot are acidic, with carboxylated and sulfated residuals. The latter prevail in the gills, where PAS positivity was not observed, suggesting the exclusive presence of acidic glycosaminoglycans (GAGs: e.g., Hooghwinkel & Smits Citation1957). As noted previously, acidic mucins are very common in mollusks and C. gallina confirms this trend.
As far as lectin binding is concerned, the mucins of C. gallina lack some residuals observed in other species, such as galactose and N-acetylgalactosamine, found in Ruditapes philippinarum (Calabrò et al. Citation2005) and Codakia orbicularis (Gourdine and Smith-Ravin Citation2002). In C. gallina, the sulfated residuals can interfere with lectin binding, in particular, PNA and SBA (e.g., Maupin et al. Citation2012); notwithstanding a preliminary desulfation treatment, the cited lectins did not bind, indicating the absence of galactosyl/galactosaminyl residuals in the oligosaccharidic chains. Positivity to WGA can be explained by both the presence of N-acetylglucosamine and sialic acid (Gallagher et al. Citation1985). A comparison of our results from AB pH 2.5 staining with those from lectin binding suggests that in the mucins of C. gallina residuals of sialic acid are lacking. In particular, the subepidermal glands are positive to AB pH 2.5, but not to WGA and all the gland cell types were negative to the lectins specific to sialic acid (SNA and MAA II). Thus, we can conclude that positivity to WGA is due to glycosaminylated residuals only. This confirms the finding of Bolognani-Fantin et al. (Citation1969) who did not find sialic acid in the foot and the mantle of a number of marine and freshwater bivalves. According to Ottaviani et al. (Citation1990), in gastropods, sialic acid is substituted by N-acetylmuramic acid, and this could also be the case of C. gallina, since WGA can also link N-acetylmuramic acid residuals (Jarroll et al. Citation1989). On the contrary, sialic acid is reported by Ahn et al. (Citation1988) in the mucous cells of the gills of the mussel Mytilus edulis and by Calabrò et al. (Citation2005) in the foot and the mantle of the venerid Ruditapes decussatus.
Positivity with AAA and ConA binding indicates that in the mucins of C. gallina there are fucosylated and mannosylated residuals, respectively. Mannose apart, ConA can link to glucose residuals (Finne & Krusius Citation1982), but the negative results from diastase-PAS experiments indicate the lack of glycogen, and thus large amounts of glucose, in the sampled tissues.
As far as the functional interpretation of the evidenced glycosidic residuals is concerned, sulfated and fucosylated chains could be involved in mucus viscosity and its defense properties (e.g., Denny Citation1983). Glucosaminylated residuals can provide attaching sites for sulfates or other carbohydrates (Menghi et al. Citation1991; Esko et al. Citation2009). A mannosylated core in mucins can have structural and regulative functions (Esmail & Manolson Citation2021).
The present study found extensive quantitative and qualitative variation of mucins related to cell specificity, life cycle and sex of C. gallina.
The gill glands present a lower diversity of residuals with respect to the foot showing oligosaccharidic chains with sulfated, glycosaminylated and fucosylated residuals, while mannosylated residuals lack. In both sexes, a reduction in acidic and galactosaminylated residuals is observed in January, while fucosylated residuals do not vary along the seasons. Sulfated residuals in males have higher values in June and lower in January, while the opposite is seen in females.
The surface secreting cells in the foot present a higher diversity of residuals. Similar to the gills, a general decrease in residuals is observed in January for both sexes, except for sulfates that increase in the males only. Glycosaminylated and fucosylated residuals were abundant in the males only, the latter increasing in January, whereas mannosylated residuals in both sexes increase in June.
Similar to the surface cells, in the foot subepidermal glands, a general decrease in acidic residuals is observed in January, except for sulfates that increase in males. Mannosylated residuals are the only evidenced by lectin-binding and increase in both sexes in January.
In general, it would seem that in males, there is a higher variation than in females. The differences in mucins probably reflect functional requirements varying between sexes along the annual cycle. Since one of the main functions of mucus is surface protection and food entrapping and transport (Jørgensen Citation1996), we could hypothesize differences in energy allocation between sexes along seasons, in relation to environmental features and activities such as the reproduction. Temperature appears to be the main factor influencing the overall physiological responses and growth of striped Venus clams (Gaspar et al. Citation2004; Moschino & Marin Citation2006; Monari et al. Citation2007). C. gallina present an annual reproductive cycle characterized by one or more external emission of gametes (Romanelli et al. Citation2009) in which gametogenesis and spawning are strongly influenced by environmental parameters and food availability (Joaquim et al. Citation2014) and can vary greatly among individuals from the same area (Grazioli et al. Citation2022). Reproduction of clams spans from spring until late summer, with a peak in July (Nojima & Russo Citation1989). Increased respiration rates are observed during the reproductive period in another species of the Veneridae family, Ruditapes decussatus. (Urrutia et al. Citation1999).
Our histological observations on gonads indicated that in January, gametogenesis is more advanced in males than in females, thus it could be hypothesized that males have higher energetic requirements and synthesis of more complex mucins in this period, although secreted in lesser amounts. The lower variation observed in females could reflect more constant energetic requirements throughout the annual cycle since ovogenesis appears to span over longer periods with respect to spermatogenesis, although spawning is synchronized.
In conclusion, the present paper demonstrates extensive qualitative and quantitative variation of mucins secreted by the Venus clam depending on cell types, sex and season. It is necessary to consider these sources of variability in considering C. gallina a model for ecophysiological and toxicological studies, as well as in evaluating the status of populations exploited in fisheries. Further studies are necessary to elucidate the complex interactions between environmental features, biological activities and mucin secretion.
Disclosure statement
No potential conflict of interest was reported by the author(s).
References
- Accogli G, Scillitani G, Mentino D, Desantis S. 2017. Characterization of the skin mucus in the common octopus Octopus vulgaris (Cuvier) reared paralarvae. European Journal of Histochemistr 61(3):204–214. DOI: 10.4081/ejh.2017.2815.
- Ahn H-Y, Sue L-F, Ma JK, Pinkstaff CA, Pore RS, Overman DO, Malanga CJ. 1988. Synthesis and secretion of mucous glycoprotein by the gill of Mytilus edulis I. Histochemical and chromatographic analysis of [14C] glucosamine bioincorporation. Biochimica et Biophysica Acta (BBA)-General Subjects 966(1):122–132. DOI: 10.1016/0304-4165(88)90136-590136-5.
- Albanese M, Calabrò C. 1996. Studio strutturale ed istochimico sul mantello e sul piede di Natica millepunctata LMK. (Moll. Gast. Pros.). Rivista di Idrobiologia 35:87–99.
- Bansil R, Turner BS. 2018. The biology of mucus: Composition, synthesis and organization. Advanced Drug Delivery Reviews 124:3–15. DOI: 10.1016/j.addr.2017.09.023.
- Begun T, Teaca A, Muresan M, Quijón PA, Menabit S, Surugiu V. 2022. Habitat and Macrozoobenthic diversity in Marine protected areas of the Southern Romanian Black Sea Coast. Frontiers in Marine Sciences 9:1–14. DOI: 10.3389/fmars.2022.845507.
- Beninger PG, St-Jean SD. 1997. The role of mucus in particle processing by suspension-feeding marine bivalves: Unifying principles. Marine Biology 129:389–397. DOI: 10.1007/s002270050179.
- Bilgin M, Uluturhan-Suzer E. 2017. Assessment of trace metal concentrations and human health risk in clam (Tapes decussatus) and mussel (Mytilus galloprovincialis) from the Homa Lagoon (Eastern Aegean Sea). Environmental Science and Pollution Research 24(4):4174–4184. DOI: 10.1007/s11356-016-8163-2.
- Bolognani-Fantin A, Vigo E, Gervaso M. 1969. La mucinogenesi nei Molluschi. VI. Caratteristiche dei tipi cellulari presenti nel piede e nel mantello di alcune specie di Lamellibranchi. Rivista di Istochimica Normale e Patologica 15:345–370.
- Bravo Portela I, Martinez-Zorzano V, Molist-Perez I, Molist Garcia P. 2012. Ultrastructure and glycoconjugate pattern of the foot epithelium of the abalone Haliotis tuberculata (Linnaeus, 1758) (Gastropoda, Haliotidae). The Scientific World Journal 2012:960159. DOI: 10.1100/2012/960159.
- Calabrò C, Albanese MP, Martella S, Licata P, Lauriano ER, Bertuccio C, Licata A. 2005. Glycoconjugate histochemistry and nNOS immunolocalization in the mantle and foot epithelia of Tapes philippinarum (bivalve mollusc). Folia Histochemica et Cytobiologica 43(3):151–156.
- Carlucci R, Cipriano G, Fanizza C, Gerussi T, Maglietta R, Petrella A, Pietroluongo G, Ricci P, Semeraro D, Guglielmi MV, Scillitani G, Mentino D. 2022. Glycopatterns of the foregut in the striped dolphin Stenella coeruleoalba, Meyen 1833 from the Mediterranean Sea. Marine Mammal Science 38(1):190–211. DOI: 10.1111/mms.12852.
- Cascione D, Turco C, Amodio S, Ingrosso M, Cipriano G, Carlucci R, Maiorano P, Ricci P 2022. Observations on benthic assemblages impacted by hydraulic dredges in the Southern Adriatic Sea (Central Mediterranean Sea). 2022 IEEE International Workshop on Metrology for the Sea; Learning to Measure Sea Health Parameters (MetroSea), Milazzo, Italy, 252–256, DOI: 10.1109/MetroSea55331.2022.9950864.
- Cutuli MA, Guarnieri A, Pietrangelo L, Magnifico I, Venditti N, Recchia L, Mangano K, Nicoletti F, Di Marco R, Petronio Petronio G. 2021. Potential mucosal irritation discrimination of surface disinfectants employed against SARS-CoV-2 by Limacus flavus slug mucosal irritation assay. Biomedicines 9:424. DOI: 10.3390/biomedicines9040424.
- Dalgiç G, Karayucel S, Okumua I. 2009. Reproduction cycle of striped Venus Chamelea gallina from the Black Sea coast of Turkey. Journal of Animal and Veterinary Advances 8(10):2009–2012.
- David JAO, Fontanetti CS. 2009. The role of Mucus in Mytella falcata (Orbigny 1842) gills from polluted environments. Water Air and Soil Pollution 203:261–266. DOI: 10.1007/s11270-009-0009-9.
- Davies MS, Hawkins S. 1998. Mucus from marine molluscs. Advances in Marine Biology 34:1–71. DOI: 10.1016/S0065-2881(08)60210-2.
- Davies MS, Hawkins SJ, Jones HD. 1990. Mucus Production and Physiological Energetics in Patella vulgata L. Journal of Molluscan Studies 56:499–503. DOI: 10.1093/mollus/56.4.499.
- Delgado M, Silva L, Juárez A. 2013. Aspects of reproduction of striped Venus Chamelea gallina in the Gulf of Cádiz (SW Spain): Implications for fishery management. Fisheries Research 146:86–95. DOI: 10.1016/j.fishres.2013.04.005.
- Denny M. 1983. Molecular biomechanics of molluscan mucous secretions. In: Wilbur KM, Simkiss K, Hochachka PW, editors. Metabolic biochemistry and molecular biomechanics. New York: Academic Press. pp. 431–465. DOI: 10.1016/B978-0-12-751401-7.50017-X.
- Eble AF. 2001. Chapter 4 Anatomy and histology of Mercenaria mercenaria. In: Kraeuter JN, Castagna M, editors. Biology of the Hard Clam. Developments in aquaculture and fisheries science. Amsterdam: Elsevier. Vol. 31, pp. 117–220. DOI: 10.1016/S0167-9309(01)80032-6.
- Erkan M. 2009. Ultrastructure of ovary and oogenesis in Chamelea gallina (Linné, 1758) (Bivalvia, Veneridae). Invertebrate Reproduction & Development 53(4):201–209. DOI: 10.1080/07924259.2009.9652306.
- Erkan M, Sousa M. 2002. Fine structural study of the spermatogenic cycle in Pitar rudis and Chamelea gallina (Mollusca, Bivalvia, Veneridae). Tissue and Cell 34(4):262–272. DOI: 10.1016/S0040-8166(02)00016-2.
- Esko JD, Kimata K, Lindahl U. 2009. Proteoglycans and Sulfated Glycosaminoglycans. In: Varki A, RD C, JD E, Hh F, Stanley P, CR B, Gw H, ME E, editors. Essentials of glycobiology. 2nd ed. Cold Spring Harbor, N.Y.: Cold Spring Harbor Laboratory Press. pp. 229–248.
- Esmail S, Manolson MF. 2021. Advances in understanding N-glycosylation structure, function, and regulation in health and disease. European Journal of Cell Biology 100(7–8):151186. DOI: 10.1016/j.ejcb.2021.151186.
- Espinosa EP, Perrigault M, Ward JE, Shumway SE, Allam B. 2009. Lectins associated with the feeding organs of the oyster Crassostrea virginica can mediate particle selection. The Biological Bulletin 217:130–141. DOI: 10.1086/BBLv217n2p130.
- Fernández Robledo JA, Yadavalli R, Allam B, Pales Espinosa E, Gerdol M, Greco S, Stevick RJ, Gómez-Chiarri M, Zhang Y, Heil CA, Tracy AN, Bishop-Bailey D, Metzger MJ. 2019. From the raw bar to the bench: Bivalves as models for human health. Developmental & Comparative Immunology 92:260–282. DOI: 10.1016/j.dci.2018.11.020.
- Finne J, Krusius T. 1982. Preparation and fractionation of glycopeptides. Methods in Enzymology 83:269–277. DOI: 10.1016/0076-6879(82)83020-6.
- Gallagher JT, Morris A, Dexter TM. 1985. Identification of two binding sites for wheat-germ agglutinin on polylactosamine-type oligosaccharides. Biochemical Journal 231(1):115–122. DOI: 10.1042/bj2310115.
- Gaspar MB, Pereira AM, Vasconcelos P, Monteiro CC. 2004. Age and growth of Chamelea gallina from the Algarve coast (southern Portugal): Influence of seawater temperature and gametogenic cycle on growth rate. Journal of Molluscan Studies 70(4):371–377. DOI: 10.1093/mollus/70.4.371.
- Goldberg ED. 1975. The Mussel watch: A first step in global marine monitoring. Marine Pollution Bulletin 6:111–114. DOI: 10.1016/0025-326X(75)90271-4.
- Gourdine J-P, Smith-Ravin EJ. 2002. Electrophoretic separation of gill proteins of the clam Codakia orbicularis. Preparative Biochemistry & Biotechnology 32:341–353. DOI: 10.1081/pb-120015458.
- Grazioli E, Guerranti C, Pastorino P, Esposito G, Bianco E, Simonetti E, Rainis S, Renzi M, Terlizzi A. 2022. Review of the scientific literature on biology, ecology, and aspects related to the fishing sector of the striped Venus (Chamelea gallina) in Northern Adriatic Sea. Journal of Marine Science and Engineering 10:1328. DOI: 10.3390/jmse10091328.
- Guglielmi MV, Semeraro D, Mentino D, Patricelli E, Mastrototaro F, Carlucci R, Mastrodonato M, Scillitani G 2022. Effects of Aluminum in the striped Venus clam, Chamelea gallina. In: 2022 IEEE International Workshop on Metrology for the Sea; Learning to Measure Sea Health Parameters (MetroSea), Milazzo, Italy, 581–586. DOI: 10.1109/MetroSea55331.2022.9950929
- Helmholz H, Ruhnau C, Pröfrock D, Erbslöh H-B PA. 2016. Seasonal and annual variations in physiological and biochemical responses from transplanted marine bioindicator species Mytilus spp. during a long term field exposure experiment. Science of the Total Environment 565:626–636. DOI: 10.1016/j.scitotenv.2016.04.202.
- Hooghwinkel GJM, Smits G. 1957. The specificity of the periodic acid-Schiff technique studied by a quantitative test-tube method. Journal of Histochemistry and Cytochemistry 5:120–126. DOI: 10.1177/5.2.120.
- Jarroll EL, Manning P, Lindmark DG, Coggins JR, Erlandsen SL. 1989. Giardia cyst wall-specific carbohydrate: Evidence for the presence of galactosamine. Molecular and Biochemical Parasitology 32(2–3):121–131. DOI:10.1016/0166-6851(89)90063-7.
- Joaquim S, Matias D, Matias AM, et al. 2014. Biochemical and energy dynamics throughout the reproductive cycle of the striped Venus Chamelea gallina (Mollusca, Bivalvia). Invertebrate Reproduction & Development 58(4):284–293. DOI: 10.1080/07924259.2014.921646.
- Jørgensen CB. 1996. Bivalve filter feeding revisited. Marine Ecology Progress Series 142:287–302. DOI: 10.3354/meps142287.
- Kádár E, Salánki J, Jugdaohsingh R, Powell JJ, McCrohan CR, White KN. 2001. Avoidance responses to aluminium in the freshwater bivalve Anodonta cygnea. Aquatic Toxicology 55(3–4):137–148. DOI:10.1016/S0166-445X(01)00183-7.
- Landini G, Martinelli G, Piccinini F. 2021. Colour deconvolution: Stain unmixing in histological imaging. Bioinformatics 37(10):1485–1487. DOI: 10.1093/bioinformatics/btaa847.
- Lillie R, Greco J. 1947. Malt diastase and ptyalin in place of saliva in the identification of glycogen. Stain Technology 22(2):67–70. DOI: 10.3109/10520294709108296.
- March FA, Dwyer FJ, Augspurger T, Ingersoll CG, Wang N, Mebane CA. 2007. An evaluation of freshwater mussel toxicity data in the derivation of water quality guidance and standards for copper. Environmental Toxicology and Chemistry: An International Journal 26(10):2066–2074. DOI: 10.1897/06-560R.1.
- Mastrodonato M, Calamita G, Mentino D, Scillitani G. 2020. High-fat diet alters the glycosylation patterns of duodenal mucins in a murine model. Journal of Histochemistry & Cytochemistry 68(4):279–294. DOI: 10.1369/0022155420911930.
- Mastrodonato M, Calamita G, Rossi R, Scillitani G, Liquori GE, Ferri D. 2009. Expression of H+,K+-ATPase and glycopattern analysis in the gastric glands of Rana esculenta. Journal of Histochemistry and Cytochemistry 57:215–225. DOI: 10.1369/jhc.2008.952234.
- Maupin KA, Liden D, Haab BB. 2012. The fine specificity of mannose-binding and galactose-binding lectins revealed using outlier motif analysis of glycan array data. Glycobiology 22(1):160–169. DOI: 10.1093/glycob/cwr128.
- McCloy RA, Rogers S, Caldon CE, Lorca T, Castro A, Burgess A. 2014. Partial inhibition of Cdk1 in G2 phase overrides the SAC and decouples mitotic events. Cell Cycle 13(9):1400–1412. DOI: 10.4161/cc.28401.
- McManus J. 1948. Histological and histochemical uses of periodic acid. Stain Technology 23(3):99–108. DOI: 10.3109/10520294809106232.
- Menghi G, Ottaviani E, Accili D, Bolognani Fantin A. 1991. Identification of muramyl derivatives in Mollusca Gastropoda tissue. Histochemistry 96(3):209–213. DOI: 10.1007/BF00271539.
- Mentino D, Scillitani G, Marra M, Mastrodonato M. 2017. Seasonal changes in the liver of a non-hibernating population of water frogs, Pelophylax kl. esculentus (Anura: Ranidae). The European Zoological Journal 84(1):525–535. DOI: 10.1080/24750263.2017.1395482.
- Monari M, Matozzo V, Foschi J, Cattani O, Serrazanetti GP, Marin MG. 2007. Effects of high temperatures on functional responses of haemocytes in the clam Chamelea gallina. Fish & Shellfish Immunology 22(1–2):98–114. DOI: 10.1016/j.fsi.2006.03.016.
- Montefalcone M, Tunesi L, Ouerghi A. 2021. A review of the classification systems for marine benthic habitats and the new updated Barcelona Convention classification for the Mediterranean. Marine Environmental Research 169:105387. DOI: 10.1016/j.marenvres.2021.105387.
- Moschino V, Marin MG. 2006. Seasonal changes in physiological responses and evaluation of “well-being” in the Venus clam Chamelea gallina from the Northern Adriatic Sea. Comparative Biochemistry and Physiology Part A: Molecular & Integrative Physiology 145:433–440. DOI: 10.1016/j.cbpa.2006.07.021.
- Nogarol LR, Brossi-Garcia AL, de Oliveira David JA, Fontanetti CS. 2012. Morphological and histochemical characterization of gill filaments of the Brazilian endemic bivalve Diplodon expansus (Küster, 1856) (Mollusca, Bivalvia, Hyriidae). Microscopy and Microanalysis 18(6):1450–1458. DOI: 10.1017/S1431927612013992.
- Nojima S, Russo G. 1989. Struttura di popolazione del bivalve Chamelea gallina (L.) in un fondo sabbioso dell’isola d’Ischia (Golfo di Napoli). Oebalia 15:189–201.
- Ono K, Katsuyama T, Hotchi M. 1983. Histochemical application of mild alkaline hydrolysis for selective elimination of O-glycosidically linked glycoproteins. Stain Technology 58(5):309–312. DOI: 10.3109/10520298309066803.
- Orban E, Di Lena G, Nevigato T, Casini I, Caproni R, Santaroni G, Giulini G. 2007. Nutritional and commercial quality of the striped Venus clam, Chamelea gallina, from the Adriatic Sea. Food Chemistry 101(3):1063–1070. DOI: 10.1016/j.foodchem.2006.03.005.
- Ottaviani E, Bolognani Fantin AM, Bolognani L. 1990. Muramic acid as a glycoconjugate component in Mollusca Gastropoda. Comparative Biochemistry and Physiology B-Biochemistry & Molecular Biology 96:627–632. DOI: 10.1016/0305-0491(90)90205-8.
- Pérès J-M. 1967. The Mediterranean benthos. Oceanography and Marine Biology Annual Review 5:449–533.
- Petraccioli A, Maio N, Guarino FM, Scillitani G. 2013. Seasonal variation in glycoconjugates of the pedal glandular system of the rayed Mediterranean limpet, Patella caerulea (Gastropoda: Patellidae). Zoology 116(3):186–196. DOI: 10.1016/j.zool.2012.10.006.
- Prezant RS. 1990. Form, function, and phylogeny of bivalve mucins. In: Morton B, editor. The Bivalvia: proceedings of a memorial symposium in honour of Sir Charles Maurice Yonge (1899-1986) at the 9th International Malacological Congress, 1986, Edinburgh, Scotland, UK. Hong Kong: Hong Kong University Press. pp. 83–95.
- Rasband W. 2022. ImageJ. Bethesda, Maryland: US National Institutes of Health. Available: https://imagej.nih.gov/ij/. Accessed Sep 2022 09.
- Robledo Y, Madrid JF, Leis O, Cajaraville MP. 1997. Analysis of the distribution of glycoconjugates in the digestive gland of the bivalve mollusc Mytilus galloprovincialis by conventional and lectin histochemistry. Cell Tissue Research 288:591–602. DOI: 10.1007/s004410050845.
- Romanelli M, Cordisco CA, Giovanardi O. 2009. The long-term decline of the Chamelea gallina L. (Bivalvia: Veneridae) clam fishery in the Adriatic Sea: Is a synthesis possible? Acta Adriatica 50(2):171–205.
- Ross LG, Ross B. 2009. Anaesthetic and sedative techniques for aquatic animals. Oxford: Blackwell.
- Ruifrok AC, Johnston DA. 2001. Quantification of histochemical staining by color deconvolution. Analytical and Quantitative Cytology and Histology 23(4):291–299.
- Scillitani G, Mentino D. 2015. Comparative glycopattern analysis of mucins in the Brunner’s glands of the Guinea-pig and the house mouse (Rodentia). Acta Histochemica 117(7):612–623. DOI: 10.1016/j.acthis.2015.06.003.
- Scillitani G, Moramarco AM, Rossi R, Mastrodonato M. 2011. Glycopattern analysis and structure of the egg extra-cellular matrix in the Apennine yellow-bellied toad, Bombina pachypus (Anura: Bombinatoridae). Folia Histochemica Et Cytobiologica 49:3:06–316. DOI: 10.5603/FHC.2011.0043.
- Spicer SS, Hardin JH, Setser ME. 1978. Ultrastructural visualization of sulphated complex carbohydrates in blood and epithelial cells with the high iron diamine procedure. The Histochemical Journal 10(4):435–452. DOI: 10.1007/BF01003007.
- Steedman H. 1950. Alcian blue 8GS: A new stain for mucin. Journal of Cell Science 3(16):477–479. DOI: 10.1242/jcs.s3-91.16.477.
- Urrutia M, Ibarrola I, Iglesias J, Navarro E. 1999. Energetics of growth and reproduction in a high-tidal population of the clam Ruditapes decussatus from Urdaibai Estuary (Basque Country, N. Spain). Journal of Sea Research 42(1):35–48. DOI: 10.1016/S1385-1101(99)00017-9.
- Zaiontz C. 2020. Real statistical analysis using Excel. Available: http://www.real-statistics.com/. Accessed Sep 2022 15.