
Abstract
As a model organism, the cell culture method of Rana dybowskii (Rd) has not received widespread attention. We obtained kidney cells from Rana dybowskii by tissue block culture and enzyme digestion, and optimized the culture method by changing different culture conditions. We can more conveniently study the operation of the Rana dybowskii immune system through cell lines. One of the most important adaptor proteins in the Toll-like receptors (TLRs) signaling pathway, TIR-domain-containing adaptor inducing interferon-β (TRIF), plays a role in the apoptosis pathway and participates in the ubiquitin-mediated protein hydrolysis pathway. This rationalizes the significance of TRIF in the immune cascade signaling pathway. To obtain and analyze the full-length sequence of cDNA, sequential structures of amino acids, as well as Rana dybowskii TRIF expression profiles, the present work carried out multiple-sequence alignment, rapid amplification of cDNA ends (RACE), the establishment of a phylogenetic tree, search for the conserved domain, and qRT-PCR. Results revealed 1733-bp full-length cDNA of RdTRIF with an open reading frame (ORF) of 1281 bp, which encoded one protein containing 426 amino acid residues. The amino acid sequence of RdTRIF confirmed the presence of one Toll/interleukin-1 receptor (TIR) domain. As a kind of hydrophilic protein, the pI and molecular weight of RdTRIF were 5.67 and 24.76 kDa, respectively. We predicted 51 candidate phosphorylation sites, including 32 serine residues, 16 threonine residues along with 3 tyrosine residues. The phylogenetic tree and multiple-sequence alignment substantiated the highest homology of RdTRIF protein to Xenopus tropicalis homologs. According to the qRT-PCR results, the expression of RdTRIF was noted under the stress of Ah in the kidney.
Keywords:
1. Introduction
Toll-like receptors (TLRs) are the key protein molecules that mediate the activation of the Toll-like receptor signaling pathway (TLR signaling pathway) in the non-specific immune system. They also link the specific immune system to the non-specific one (Xie et al. Citation2014; Hu et al. Citation2019; Yilmaz Citation2019; Priyathilaka et al. Citation2019; Höpfinger et al. Citation2021). TLRs are non-catalytic transmembrane proteins, which recognize certain molecules with highly conserved structures derived from pathogenic microorganisms and trigger the specific immune system to release inflammatory mediators (Takeda & Akira Citation2004; Uematsu et al. Citation2005; Mortaz et al. Citation2015; Anwar et al. Citation2019).
TLR4 was the first PRR molecule to be discovered. Research on TLR4 changed the traditional views on immunology (Hoshino et al. Citation1999; Akira & Hemmi Citation2003; Lu et al. Citation2008). Further investigation showed the presence of thousands of Toll-like receptors (TLRs) within the genomes of vertebrates, including 13 in mammals and 27 in non-mammals. Previous studies suggested that the number of TLRs in different species of animals is dissimilar. Although many ligands recognized by TLRs are yet to be studied in detail, the ligands discovered encompass lipids, proteins, and nucleic acids, and their sources comprise pathogens such as viruses, bacteria, fungi, and parasites (Beutler Citation2000; Re & Strominger Citation2001; Doyle et al. Citation2002; Miller et al. Citation2005; Fukata et al. Citation2006; Clark et al. Citation2007; Seki et al. Citation2007; Scott & Billiar Citation2008).
The results of previous studies have shown that different Toll-like receptors can recognize various PAMPs attributed to the structural differences in their LRR regions and transmit signals to different downstream molecules containing TIR domains through the TIR domain. Four downstream molecules are known to possess TIR domains in the TLR4 signaling pathway: TIR-domain-containing adaptor-inducing interferon-β (TRIF), TRIF-related adaptor molecule (TRAM), myeloid differentiation factor 88 (MyD88), and MyD88 adaptor-like protein (Mal). TLR4 mainly recruits two molecules, MyD88 and TRIF. Mal and TRAM play an auxiliary role in recruiting downstream molecules in the TIR domain. Based on the different downstream molecules, the TLR4 pathway is categorized as MyD88-independent and MyD88-dependent pathways; the former one is also known as the TRIF-dependent pathway (Adachi et al. Citation1998; Kawai et al. Citation2001; Fitzgerald et al. Citation2001; Yamamoto et al. Citation2003).
TLR4 recruits TRIF molecules and transmits the signal downward via the TRIF-dependent pathway. Earlier studies have confirmed the delayed activation of NF-κB following LPS-stimulation of MyD88 knockout mice relative to the time taken to activate NF-κB in wild-type mice. This indicated that MyD88 molecules are not solely responsible for signal transduction in the TLR4 signaling pathway, and there is another important linker molecule. Detailed studies have found the same TIR domain in TRIF as that found in MyD88. Studies have shown that TLR4 activation is followed by TRAM-mediated recruitment of TRIF, which thus initiates the TRIF-dependent pathways. Besides the TIR domain, the TRIF molecules contain two other functional domains, which include the T6BM domain and the RHIM domain. These two domains facilitate the binding of TRIF to TRAF6 and RIP1, respectively, to activate downstream pathways. The N-terminal RHIM domain assists in the binding of TRIF to RIP1, forming a complex. Then, RIP1 binds to the TNF receptor-associated death domain protein (TRADD) through the homotype DD domain. This results in the ubiquitination of the RIP1 molecule that is then recognized by the TAB complex, which, in turn, releases the NF-κB molecule. Also, direct binding of TRIF to TRAF6 through the T6BM domain activates NF-κB. However, experiments have shown that the interaction between TRAF6 and TRAM may have different outcomes in different types of cells. TRIF-induced activation of the Interferon Regulatory Factor (IRF) is mediated by the TANK protein, whereby TRIF can bridge TBK1, IKKε, and TRAF3 molecules, resulting in the formation of homodimers of IRF3, which can trigger the expression of Interferon (IFN) after entering the nucleus. TRIF is the only adaptor protein that can cause apoptosis among the known adaptor molecules possessing the TIR domain. Studies have demonstrated a 50% reduction in the degree of TRIF-mediated NF-κB activation on destroying the RHIM domain of the TRIF molecule, compared to the level of activation shown by the wild-type TRIF molecule; cell apoptosis also disappears completely. Furthermore, previous studies have shown that TRIF can induce cells to turn apoptotic through the non-mitochondrial FADD/caspase-8 pathway (Yamamoto et al. Citation2003; Fitzgerald et al. Citation2003; Li et al. Citation2005).
Rana dybowskii (Rd) belongs to the family Ranidae. After analyzing the morphology, genetics, and physiology, Xie Feng and others, in 1999, declared it to be the related of the Chinese forest frog (Rana chensinensis) and called it the Northeast forest frog. This species is found in Heilongjiang, Jilin, Liaoning, China and the northeastern region of Inner Mongolia. It is also found in the Russian Far East, the eastern region of Mongolia, North Korea, and the Tsushima Island in Japan. The members of this species are mostly found on broad leaves near water sources, coniferous forests, and broad-leaved mixed forests. However, researchers currently focus more on the study of amphibians on the basis of the entire living animal, and few researchers are willing to use frog cells as the research object and make efforts towards it. Therefore, we believe that exploring and determining a method that can cultivate amphibian cells is of great significance for future research work (Cai et al. Citation2007; Zhang et al. Citation2010; Sun et al. Citation2011; Yang et al. Citation2012; Xu et al. Citation2017; Tong et al. Citation2018).
Aeromonas hydrophila (A. hydrophila, Ah) belongs to the family Aeromonadaceae. The colony can vary from light yellow to white, is smooth and round, has an aromatic smell, and is conditionally pathogenic to the Gram-negative Brevibacterium, which is widely distributed in the aquatic environment. Moreover, Aeromonas hydrophila is the main pathogen responsible for the red-leg disease in amphibians. It can cause sepsis and edema in amphibians and also damage the main organs. Ah can infect rapidly, and infected individuals show extremely high mortality. Therefore, Ah is a great threat to the survival of amphibians. The research on Ah plays a vital role in the breeding and protection of amphibians (Burke et al. Citation1984; Palumbo et al. Citation1985; Swift et al. Citation1997; Lynch et al. Citation2002; Galindo et al. Citation2004).
2. Materials and methods
2.1. Care and maintenance of Rana dybowskii
We obtained 1-year-old artificially bred male frogs from Yichun, Heilongjiang Province, China. In the laboratory, the frogs were cultured in large barrels that could transmit light. A maximum of 10 frogs were cultured per barrel. Before the formal experiment, the frogs were acclimatized at room temperature for about 7 ~ 10 days. The water in which the frogs were kept during acclimation was strictly regulated. The water was filtered and aerated for 24 h, and the temperature was maintained at 14 ~ 16°C. Two-third of the water was replaced on alternate days to keep it clean.
2.2. Kidney cell culture of Rana dybowskii
After the first-year-old frogs domesticated in the laboratory was killed, the abdominal epidermis was wiped with 75% alcohol for many times, the frog kidney was taken out in a sterile environment, and the blood and stains on the kidney tissue were washed with Ren’s solution added with penicillin streptomycin for many times. After the cleaned kidney is replaced and added with penicillin streptomycin Ren’s solution, remove the outer coated fascia and other attachments, cut it and rinse it again with penicillin streptomycin Ren’s solution for 3–5 times until the surface is clean and there is no visible attachment, and then put the kidney in normal Ren’s solution for standby. The kidney tissues were treated and cultured by enzyme digestion and tissue culture.
In the group treated by enzyme digestion, the kidneys were cut and collected into 0.125% enzyme containing medium without serum. After shaking at 37°C for 20 minutes, a small amount of fetal bovine serum was added to terminate the digestion. We fold the single-layer sterile gauze three times to form an object with an eight layer composite structure similar to a filter screen, then we filter with multi-layer sterile gauze, and centrifuge the filtrate at 800 r/min for 5 minutes to collect cells. After centrifugation, we carefully absorbed and discarded the upper layer of Qingye, and then slowly added the culture medium to completely dissolve the lower layer sediment. At this point, penicillin streptomycin double antibody was added to the culture medium we used, with a concentration of 100 U/ml. Finally, the liquid was added to the T25 cell culture bottle with breathable bottle cap for culture.
In the group treated with tissue block culture method, the kidneys were cut to pieces and the volume of each tissue block was no more than 1 mm3, then washed with Ren’s solution added with 100 U/ml penicillin streptomycin double antibody and precipitated naturally for 3 times, and then a small amount of fetal bovine serum was added. After the tissue block was immersed in serum, the tissue block suspension was absorbed with a straw and evenly applied to the bottom of the cell culture bottle, and then the cell culture bottle was inverted in the incubator for 3 hours, After the tissue block is slightly dry and close to the bottom of the bottle, slowly add a small amount of culture medium at the corner of the cell culture bottle to make the tissue block normally contact the culture medium, and then place the cell culture bottle forward to continue the culture.
The cells obtained by the two treatment methods were cultured at 26°C. When the bottom of the cell culture flask was not completely covered, the cell culture solution was changed every 24 hours, most of the cell culture solution was sucked out each time, and the cells were slowly washed with the culture solution added with penicillin and streptomycin to ensure that the cells were wet during the operation. And we record the results of cell culture through the morphology of cells and the proportion of live cells.
2.3. Identification of cells and optimization of culture conditions and immortalization
In order to verify and ensure that the cell line we cultured is a cell line derived from the Northeast Forest Frog, we used common species identification methods to determine the phylogenetic relationship of the cell line. We obtained the CoII gene through sequencing, and then constructed an evolutionary tree for cell identification, using this basis to determine whether the cell line is an amphibian cell line.
We optimized and compared the cell culture conditions, and judged the most suitable growth environment for amphibian cells by the number of cells and the ratio of living cells. The conditions we selected to be optimized were medium composition, serum concentration and culture temperature. DMEM, F12 and DMEM+F12 mixed in the ratio of 1:1 were selected as the culture medium; We divided the serum concentration into three gradients, which were 15%, 20% and 25% of the serum content respectively; For the selection of culture temperature, we set three culture temperatures, namely 4°C, 26°C and 37°C.
2.4. Resuscitation of Aeromonas hydrophila and infected of Rana dybowskii kidney cells
Aeromonas hydrophila was provided by the Institute of Microbiology, Chinese Academy of Sciences. The liquid culture medium of the strain was mixed with glycerol and stored at −80°C in ultra-low temperature refrigerators in our laboratory. When the AH bacterial solution was required, the previously sub-packed bacterial solution was thawed according to a protocol. The monoclonal colonies were selected by the plate medium culture method, and the culture system was incubated at 37°C with constant shaking at 200–300 rpm for 18 h. We divided the cells cultured in the laboratory into three main groups, and equally divided the cells into several different cell culture flasks for culture. We waited until the cells covered more than 70% of the bottom area in the culture flask and began to add exogenous stimuli. The first group of cells were infected with a solution of Ah bacteria (1 ml) at a concentration of 1 × 10⁷ CFU/mL, dissolve the purchased LPS in the same solution as Ah liquid medium according to the dissolution method in the manual, and inject this solution 1 ml into the second group of cells, while the third group of cells was injected with the same volume of liquid medium as the previous two groups and served as the control group.
2.5. mRNA sequences and primers
The mRNA sequences of RdTRIF were obtained based on renal transcriptomic sequencing of Rana dybowskii, followed by annotation in the Beijing Genomics Institution (BGI, China). The software Beacon Designer 7 was used to design the primer pairs for qPCR of all sequences (). We plotted the standard dilution curves of five concentrations for all primers to ensure that the primer amplification efficiency was around 90%-105%.
Table I. Primer information.
2.6. Total RNA isolation and cDNA synthesis
The samples of cells were collected 2, 4, 8, 12, 24, 48 h post-infection (hpi) and stored in the Sample Protector for RNA/DNA (TaKaRa, Japan) at −80°C until subsequent analyses. Then, total tissue RNAs were isolated using the TRIzol® Reagent (Ambion, USA) following specific protocols. The total RNA content was detected by ultraviolet spectrophotometry. The cDNA was prepared using the PrimeScriptTM RT reagent Kit, which contained the gDNA Eraser (TaKaRa, Japan) as per the specific protocols before qPCR. Then, we preserved the cDNA samples at −20°C until further use.
2.7. Cloning of the full-length RdTRIF cDNA sequence and bioinformatic analysis
The obtained sequences were analyzed, and the sequence information was found to be incomplete. We conducted RACE experiments to obtain the full-length sequence of the cDNA of RdTRIF. The cDNA was synthesized by isolating the total RNA from the kidneys infected with AH for 12-h, and 3’-/5’-RACE was performed. In 3’-end RACE, we used a 3’-Full RACE Core Set that contained PrimeScript™ RTase (TaKaRa, Japan) and the primer M3’S () as per the specific protocols. In 5’-RACE, we used a 5’-Full RACE Core Set (TaKaRa, Japan) and the primers MRT, M5’A, and M5’S as per specific protocols. Agarose gel electrophoresis (AGE) was performed to purify target DNA fragments using TIANgel Maxi Purification Kit (TIANGEN, Beijing). Then, the DNA was cloned and sequenced using a pGM-T Cloning Kit containing the Competent Cell (TIANGEN, Beijing).
To obtain the candidate amino acid and ORF sequences, the BGI annotated sequences were uploaded to the NCBI Open Reading Frame (ORF) Finder (http://www.ncbi.nlm.nih.gov/gorf/gorf.html). Additionally, we analyzed the homologous sequences against NCBI blastp (http://blast.ncbi.nlm.nih.gov/Blast.cgi) and the conserved domains against the NCBI Conserved Domain Database (CDD) (http://www.ncbi.nlm.nih.gov/Structure/cdd/wrpsb.cgi). Moreover, ExPASy ProtParam (http://web.expasy.org/protparam/) was used to predict hydrophilicity, isoelectric point, and molecular mass. The potential phosphorylation sites of RdTRIF were predicted by the NetPhos 3.1 Server (http://services.healthtech.dtu.dk/service.php?NetPhos-3.1). The ClustalX software was used for aligning multiple sequences. We obtained amino acid sequences for additional species from the NCBI GenBank database (http://www.ncbi.nlm.nih.gov/protein). Using the GTR + Γ substitution model, we constructed the phylogenetic tree of each amino acid with the maximum likelihood method using RAxML Stamatakis (2014) after 1,000 bootstraps.
2.8. qPCR and statistical analysis
We performed qPCR using the CFX96 Touch Real-Time PCR Detection System (Bio-Rad, Hercules, CA) as per the manufacturer’s instructions. The qPCR reactions used ten-fold dilutions of cDNA samples. A 20-µL system was prepared for qPCR and included 2 × SuperReal Premix Plus (10 µL, TIANGEN, Beijing), cDNA (1 µL), the respective primers (200 mM), and RNase-free water (suitable volume). RdTRIF were analyzed thrice independently. The cycling conditions were as follows: 15 min at 95°C for the full activation of polymerase, 10 s at 95°C, 30 s at 52°C, and 30 s at 72°C for 40 cycles. Fluorescence intensity was estimated for every cycle following the extension. The melting curves were plotted following 40 cycles. The Cq value denoted the reaction copy number, and the gene relative copy number was calculated using β-actin as the reference. The 2–ΔΔCq data were used to present fold-induction of samples subjected to bacterial infection. All qPCR data were analyzed using the SPSS software and expressed as the mean ± SEM. Significant differences in gene expression levels between the injection groups and corresponding control groups were determined by the Student’s t-test. All differences were considered to be statistically significant at p < 0.05.
3. Results
3.1. Cell culture results
The cells obtained by the two treatment methods were cultured at 26°C. When the bottom of the cell culture flask was not completely covered, the cell culture solution was changed every 24 hours, most of the cell culture solution was sucked out each time, and the cells were slowly washed with the culture solution added with penicillin and streptomycin to ensure that the cells were wet during the operation. And the cell morphology was recorded.
We cultured the cells treated by enzyme digestion method and tissue block culture method at 26°C, and then counted the cells every 48 h after the cells were first covered with the bottom of the culture flask with a red cell counting plate and counted the cell activity with a live cell counter. The corresponding cell growth curve and cell activity curve were obtained ().
Figure 1. Corresponding cell growth curve, the abscissa in the figure is the number of days of culture, and the ordinate is the total number of cells recorded by scientific notation.
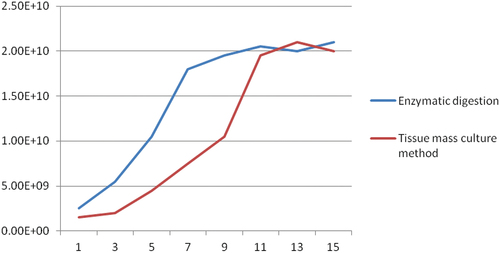
Figure 2. Histogram of cell activity. In this figure, the abscissa represents the number of days of culture and the ordinate represents the percentage of living cells.
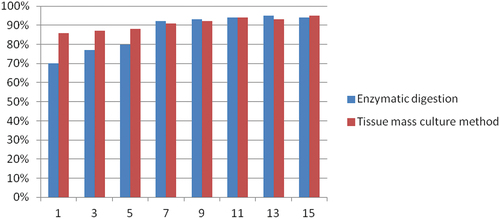
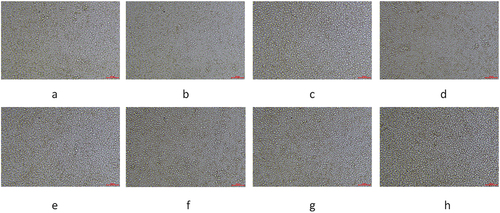
Figure 3. The photos taken during cell culture were taken before each cell bottle division. The pictures taken from a to h were taken at 1 day, 3 days, 5 days, 7 days, 9 days, 11 days, 13 days, and 15 days of cell culture, respectively.
We performed data statistics on the two groups of cells with a time length of 15 days. We found that the cells treated by enzyme digestion first covered the bottom of the cell culture flask on day 7. After that, we carried out cell passage every two days, and each time we would divide a bottle of cells into three bottles for culture after digestion. At the same time, we found that the cells treated by the tissue block culture method will completely cover the bottom of the cell culture bottle on the 10th day, and then we also carry out cell passage culture and counting every two days.
We found that the cells treated by enzyme digestion had a large degree of dispersion in the early stage, but the proportion of dead cells was high, so the cell growth was slow in the early stage. After 2 times of fluid exchange, the adherent cells began to grow, and the cell morphology was round or oval. On the third day, some cells close to each other appeared connection, and the growth speed was further accelerated, and some cells became spindle shaped. On the 5th day, the cells in most areas had been connected together, and the morphology of the cells basically showed a spindle shape. After 7 days of culture, the cells completely covered the bottom of the cell culture flask.
We found that in the early stage of cell culture using tissue block culture method, obvious growth areas can be observed. Because the cells are close to each other, the cells are elliptical and spindle shaped. The cells will slowly grow outward in the early stage with the tissue block as the center. When the cells grow to the fifth day, the cells in some areas will fuse and grow faster. On the 7th day, no obvious tissue mass appeared in the field of vision, but the cells in most areas were fused. By the 10th day after treatment, the cells were completely covered at the bottom of the cell culture flask. According to the results of tissue block culture method, the cell growth is concentrated around the tissue block and grows slowly, but it can ensure a high proportion of live cells.
Compared with the two methods, the tissue block culture method is more convenient and simple than the enzyme digestion method, but the enzyme digestion method takes less time. For those requiring time, the enzyme digestion treatment method can be selected, but for those requiring experimental stability, the tissue block culture method is recommended.
3.2. Identification of cell lines
We sequenced the cultured cells and obtained a CoII gene sequence which length of 1541 bp. We compared this sequence with the CoII gene sequences of 11 species, including mammals, amphibians, birds and fish. After that we used the maximum likelihood method for molecular phylogenetic analysis, obtaining corresponding results. The results showed that the cell is located in the amphibian branch and is most closely related to the Co II molecule of the genus Rana. Therefore, it can be proved that the cell is a cell line obtained from amphibian organisms and then cultured ().
Figure 4. Evolutionary tree analysis. The tree was constructed using the molecular phylogenetic analysis by maximum likelihood method based on gene sequence in MEGA 5.1.
3.3. Optimization results of culture conditions
We optimized the cell culture conditions to shorten the culture time and improve the culture efficiency. According to the experimental results, the cell growth rate at 26°C is the fastest among the three culture temperatures, but the cell death rate will be higher than 4°C, while the cell growth rate at 37°C is not only slower, but also higher than that at the other two temperatures. The DMEM + F12 medium mixed in the ratio of 1:1 is the most suitable medium for cell growth among the three medium configuration schemes, while the other two medium schemes have little effect on cell growth. When the serum concentration was increased from 15% to 20%, the growth of cells was significantly promoted. However, when the serum concentration was increased to 25%, the growth of cells was not promoted again, but there was a certain degree of inhibition.
Therefore, we believe that when the culture conditions are selected to use DMEM + F12 medium mixed in a ratio of 1:1, the serum concentration is 20%, and the culture temperature is 4°C, the time for cell culture and the proportion of live cells are the best.
3.4. Analysis results of cell sequence after adding LPS
After sequencing, 116,812 gene fragments were extracted with differential expression levels, of which 46,522 gene fragments were annotated. Among these annotated genes 14,865 (31.95%) gene fragments were upregulated, while the remaining 31,657 gene fragments were downregulated, accounting for 68.05% of the total gene fragments.
According to the annotation results of the gene fragments, 203 genes (0.44%) were related to the TLR signaling pathway, 1,381 genes (2.97%) were involved in the apoptosis pathway, and 693 genes (1.49%) were associated with the ubiquitin-mediated protein hydrolysis pathway.
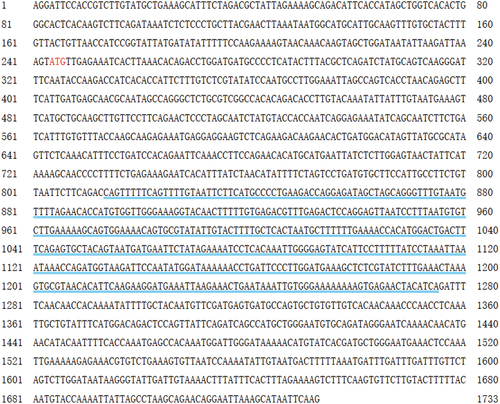
By comparing and analyzing the genes involved in apoptosis, the TLR signaling pathway, and the ubiquitin-mediated protein hydrolysis pathway, we found that the three pathways converged on the TRIF-dependent pathway in the TLR4 signaling pathway. Therefore, on activation of the TLR4 signaling pathway, the TRIF-dependent pathway is the only way to regulate the secretion of cytokines from cells, initiate protein hydrolysis and initiate cell apoptosis. The obtained genes were screened for the TIR domain. The complete RdTRIF molecular cDNA was obtained by the RACE method, and a cDNA of 1,733 bp was obtained (). We will submit the obtained cDNA sequence to the NCBI GenBank database, and the obtained sequence accession number is OR682405.
Figure 5. Gene sequence of TRIF cDNA in Rana dybowskii. The number of nucleotide sequences is shown from left to right. The red letters designate the start codon. The blue double underline represents the TIR domain.
The NCBI ORF analysis software was used to analyze the complete TRIF sequence. Eight possible open reading frames were generated by the molecule, among which the shortest ORF was 84 bases long and encoded 27 amino acid residues; the longest ORF was 1,281 bases long and encoded 426 amino acid residues. The proteins with more than 100 amino acid residues were submitted to ExPASy for analysis. The protein with 426 amino acid residues was able to form a TIR domain from the 191st amino acid residue to the 344th amino acid residue. Therefore, the protein encoded by this gene was the TRIF molecule. The molecular weight, isoelectric point, and hydrophilicity of the TRIF protein molecule were calculated. The protein had 426 amino acid residues, a molecular weight of about 24.76 kDa, an isoelectric point of 5.67, and an average hydrophilicity index (GRAVY) of −0.574, indicating the hydrophilicity of RdTRIF (). RdTRIF showed 81 potential phosphorylation sites, which included 49 Ser residues, 27 Thr residues, and five Tyr residues (). The NetPhos 3.1 score was between 0.000 and 1.000, and scores above 0.500 were considered to be positive. We found that RdTRIF contained 51 positive phosphorylation sites, including 16 Thr residues, three Tyr residues, and 32 Ser residues ().
Figure 6. Protein sequence analysis and protein secondary structure prediction. The TRIF in Rana dybowskii (Rd), Danio rerio (dr), and Homo sapiens (hs). The alignment was performed by ClustalX and edited manually.
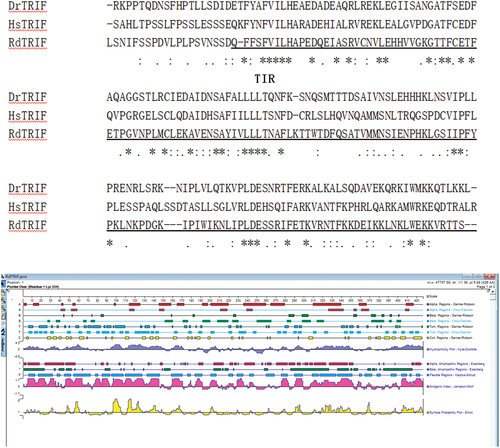
Figure 7. Phosphorylation sites.
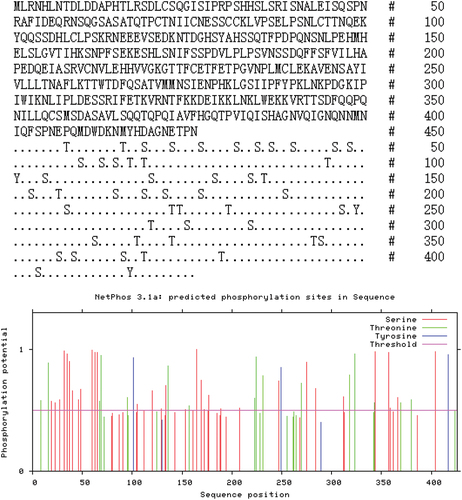
Table II. Phosphorylation sites in RdTRIF.
3.5. Sequence homology and evolutionary analysis
NCBI BLAST was used to determine the similarity of RdTRIF with other vertebrates. The results revealed up to 83.14% similarity of R. dybowskii with Rana temporaria, while the similarity of R. dybowskii with Sphaeramia orbicularis was the lowest (30.56%).
To investigate the phylogenetic relationship across the vertebrate TRIF, we established a phylogenetic tree through neighbor-joining using MEGA 5.1. There were mammalian homologs and three major clusters in the tree, including amphibian, avian, and fish clusters. Moreover, relative to the higher fish species, the amphibian TRIF was evolutionarily closer to the higher species, and the TRIF of amphibians was in a more independent developmental branch ().
Figure 8. Evolutionary tree analysis. The tree was constructed with the neighbor-joining method in MEGA 5.1 based on amino acid sequences.
3.6. Changes in the expression of TRIF molecules in cells after stimulation
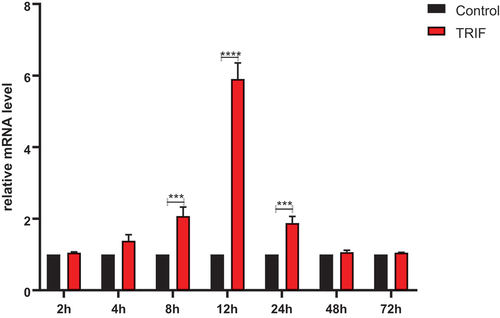
To investigate the expression of the RdTRIF mRNA in response to AH stimulation, we collected samples of the kidney cells of Rana dybowskii that had been injected with AH. The collections were made 2 h, 4 h, 6 h, 8 h, 12 h, 24 h, 48 h, and 72 h post-infection (hpi). The results show that, the expression of the molecule started to increase at 4 hpi and reached a peak at 12 hpi, which was 5.8 times the background value. Then, it rapidly decreased and dropped to the background level at 48 hpi ().
Figure 9. Expression of relative mRNA level of TRIF in the kidney. RdTRIF mRNA levels obtained from the Ah-exposed kidneys were detected by qRT-PCR. Each frog was given an intraperitoneal injection of 107 CFU/frog Ah. At 2, 4, 8, 12, 24, 48, and 72 hpi, we isolated total RNAs, with β-Actin being the endogenous reference. Data were represented in the form of mean ±SD (bars) from 3 separate assays. (***p < 0.05; ****p < 0.01).
4. Discussion
Amphibian is an important model organism, but the progress of its cell culture is slow, which also leads to researchers’ lack of interest and profound progress in amphibian research. We think this will seriously affect the development of modern biology. Our research on the amphibian Rana dybowskii can provide some basic data for the majority of researchers and lay a foundation for the research and protection of amphibians.
Through experiments, we believe that the culture conditions of amphibian cells are between fish and mammals. We believe that it is difficult to extract amphibian cells, because amphibians live in a wide range of microorganisms, and they cannot cultivate the same frogs as clean mice. At the same time, the use of a large amount of alcohol during the experiment will also cause irreparable damage to cells. Therefore, Ren’s solution with high concentration of penicillin streptomycin double antibody can be used for repeated cleaning in the process of cell extraction to ensure the success of cell culture.
We obtained the full-length sequence of the cDNA of RdTRIF for expression and sequence analyses. The cDNA sequence of RdTRIF was 1,733 bp long and included an open reading frame of 1,281 bp, which encoded a protein of 426 amino acid residues. The ExPASy program revealed the presence of a TIR domain in the molecule, which was similar to the TRIF molecules of other species and could bind to TLRs. Although the downstream domain of the TRIF molecule needs to be accurately constructed, evidence suggests the role of TRIF in partly activating the immune pathway and the programmed cell death pathway, which is similar to the results of previous studies.
The structure of RdTRIF was most similar to its homolog in Xenopus. However, the homologs of other species were considerably dissimilar. Hence, although TRIF has a highly conserved domain, it also has a structure with very low similarity. The phylogenetic analysis indicated that the RdTRIF molecule is very similar to that found in fish.
The qPCR results demonstrated a significant upregulation of RdTRIF of the AH-infected Northeast forest frog cells, with the highest peak at 12 hpi. AH is a gram-negative (G−) bacterial species. Infection with G-bacteria leads to the upregulation of various TLRs, and the TRIF-dependent pathway affects the signaling cascade to induce innate immunity; our results were similar to the abovementioned process. The qPCR analysis predicted the role of RdTRIF in the apoptosis pathway, the ubiquitin-mediated protein hydrolysis pathway, and antibacterial immunity in R. dybowskii.
The results of qPCR showed that after AH infection, RdTRIF in renal cells of Rana amurensis significantly increased. After infection with AH, RdTRIF was activated and rapidly expressed in renal cells of Rana dybowskii. But it returned to normal levels after 24 hours. According to our research results, RdTRIF plays different functions in different tissues and organs. It can activate the apoptosis pathway, ubiquitin mediated protein hydrolysis pathway, and TLR signaling pathway. AH-infected kidneys express RdTRIF at a specific time, activating TLR signaling pathways, and rapidly activating immune signaling pathways. This is also consistent with our observation that the kidney is the main immune organ of frogs. When AH infects the kidneys, three pathways are simultaneously activated to resist bacterial infection. Therefore, the expression of RdTRIF in the kidney lasts for a long time, and it is also the most important organ for the Northeast Forest Frog to resist bacterial infection.
Studies on the complete structural and functional domain of TRIF are limited, and information regarding the downstream transmission of the signal by the protein is lacking. However, the sequencing results showed that the upregulation of TRIF expression led to the activation of the downstream protein expression of the TLR signaling pathway and the ubiquitin degradation pathway. This elucidates the importance of TRIF as a node protein connecting these two pathways. Therefore, research on this protein can help to understand the immune signaling pathway and some life activities.
To summarize, we collected and cultured kidney cells of Rana dybowskii, the full-length cDNA of TRIF in Rana dybowskii was obtained. Multiple sequence alignment, open reading frame search, structure domain construction, phylogenetic tree construction, and real-time quantitative PCR were conducted in this study. The results indicated that through its highly conserved domains, TRIF might play a significant role in the innate immunity of Rana dybowskii.
Ethics statement
This study involving animals was conducted according to internationally-accepted standards. The approval for the study was obtained from the Laboratory animal management and ethics committee of Northeast Forestry University, No: 20 Laboratory of animal physiology, College of wildlife resources, Northeast Forestry University.
Disclosure statement
No potential conflict of interest was reported by the author(s).
Data availability statement
The authors confirm that the data supporting the findings of this study are available within the article.
Additional information
Funding
References
- Adachi O, Kawai T, Takeda K, Matsumoto M, Tsutsui H, Sakagami M, Nakanishi K, Akira S. 1998. Targeted disruption of the MyD88 gene results in loss of IL-1-and IL-18-mediated function. Immunity 9(1):143–150. DOI: 10.1016/S1074-7613(00)80596-8.
- Akira S, Hemmi H. 2003. Recognition of pathogen-associated molecular patterns by TLR family. Immunology Letters 85(2):85–95. DOI: 10.1016/S0165-2478(02)00228-6.
- Anwar MA, Shah M, Kim J, Choi S. 2019. Recent clinical trends in Toll‐like receptor targeting therapeutics. Medicinal Research Reviews 39(3):1053–1090. DOI: 10.1002/med.21553.
- Beutler B. 2000. Tlr4: central component of the sole mammalian LPS sensor. Current Opinion in Immunology 12(1):20–26. DOI: 10.1016/S0952-7915(99)00046-1.
- Burke V, Robinson J, Gracey M, Peterson D, Partridge K. 1984. Isolation of Aeromonas hydrophila from a metropolitan water supply: Seasonal correlation with clinical isolates. Applied and Environmental Microbiology 48(2):361–366. DOI: 10.1128/aem.48.2.361-366.1984.
- Cai F-K, Su F-Y, Liu H-B, Qi L. 2007. Effect of pH on hatching rate and tadpole development of Rana dybowskii. Journal of Animal Ecology 11(2):100.
- Clark SR, Ma AC, Tavener SA, McDonald B, Goodarzi Z, Kelly MM, Patel KD, Chakrabarti S, McAvoy E, Sinclair GD, Keys EM, Allen-Vercoe E, DeVinney R, Doig CJ, Green FHY, Kubes P. 2007. Platelet TLR4 activates neutrophil extracellular traps to ensnare bacteria in septic blood. Nature Medicine 13(4):463–469. DOI: 10.1038/nm1565.
- Doyle SE, Vaidya SA, O’Connell R, Dadgostar H, Dempsey PW, Wu T-T, Rao G, Sun R, Haberland ME, Modlin RL, Cheng G. 2002. IRF3 mediates a TLR3/TLR4-specific antiviral gene program. Immunity 17(3):251–263. DOI: 10.1016/S1074-7613(02)00390-4.
- Fitzgerald KA, Palsson-McDermott EM, Bowie AG, Jefferies CA, Mansell AS, Brady G, Brint E, Dunne A, Gray P, Harte MT, McMurray D, Smith DE, Sims JE, Bird TA, O’Neill LAJ. 2001. Mal (MyD88-adapter-like) is required for Toll-like receptor-4 signal transduction. Nature 413(6851):78–83. DOI: 10.1038/35092578.
- Fitzgerald KA, Rowe DC, Barnes BJ, Caffrey DR, Visintin A, Latz E, Monks B, Pitha PM, Golenbock DT. 2003. LPS-TLR4 signaling to IRF-3/7 and NF-κB involves the toll adapters TRAM and TRIF. Journal of Experimental Medicine 198(7):1043–1055. DOI: 10.1084/jem.20031023.
- Fukata M, Chen A, Klepper A, Krishnareddy S, Vamadevan AS, Thomas LS, Xu R, Inoue H, Arditi M, Dannenberg AJ, Abreu MT. 2006. Cox-2 is regulated by Toll-like receptor-4 (TLR4) signaling: Role in proliferation and apoptosis in the intestine. Adenocarcinoma, and Barrett’s Epithelium: Gastroenterology 131(3):862–877. DOI: 10.1053/j.gastro.2006.06.017.
- Galindo CL, Fadl AA, Sha J, Gutierrez C, Popov VL, Boldogh I, Aggarwal BB, Chopra AK. 2004. Aeromonas hydrophila cytotoxic enterotoxin activates mitogen-activated protein kinases and induces apoptosis in murine macrophages and human intestinal epithelial cells. The Journal of Biological Chemistry 279(36):37597–37612. DOI: 10.1074/jbc.M404641200.
- Höpfinger A, Karrasch T, Schäffler A, Schmid A. 2021. Regulation of CAMP (Cathelicidin antimicrobial peptide) expression in adipocytes by TLR 2 and 4. Innate Immunity 27(2):184–191. DOI: 10.1177/1753425920988167.
- Hoshino K, Takeuchi O, Kawai T, Sanjo H, Ogawa T, Takeda Y, Takeda K, Akira S. 1999. Cutting edge: Toll-like receptor 4 (TLR4)-deficient mice are hyporesponsive to lipopolysaccharide: Evidence for TLR4 as the lps gene product. Journal of Immunology (Baltimore, Md: 1950) 162(7):3749–3752. DOI: 10.4049/jimmunol.162.7.3749.
- Hu X, Chi Q, Liu Q, Wang D, Zhang Y, Li S. 2019. Atmospheric H2S triggers immune damage by activating the TLR-7/MyD88/NF-κB pathway and NLRP3 inflammasome in broiler thymus. Chemosphere 237:124427. DOI: 10.1016/j.chemosphere.2019.124427.
- Kawai T, Takeuchi O, Fujita T, Inoue J-I, Mühlradt PF, Sato S, Hoshino K, Akira S. 2001. Lipopolysaccharide stimulates the MyD88-independent pathway and results in activation of IFN-regulatory factor 3 and the expression of a subset of lipopolysaccharide-inducible genes. Journal of Immunology (Baltimore, Md: 1950) 167(10):5887–5894. DOI: 10.4049/jimmunol.167.10.5887.
- Li K, Foy E, Ferreon JC, Nakamura M, Ferreon ACM, Ikeda M, Ray SC, Gale M, Lemon SM. 2005. Immune evasion by hepatitis C virus NS3/4A protease-mediated cleavage of the Toll-like receptor 3 adaptor protein TRIF. Proceedings of the National Academy of Sciences of the United States of America 102(8):2992–2997. DOI: 10.1073/pnas.0408824102.
- Lu Y-C, Yeh W-C, Ohashi PS. 2008. LPS/TLR4 signal transduction pathway. Cytokine 42(2):145–151. DOI: 10.1016/j.cyto.2008.01.006.
- Lynch MJ, Swift S, Kirke DF, Keevil CW, Dodd CER, Williams P. 2002. The regulation of biofilm development by quorum sensing in Aeromonas hydrophila. Environmental Microbiology 4(1):18–28. DOI: 10.1046/j.1462-2920.2002.00264.x.
- Miller SI, Ernst RK, Bader MW. 2005. LPS, TLR4 and infectious disease diversity. Nature Reviews Microbiology 3(1):36–46. DOI: 10.1038/nrmicro1068.
- Mortaz E, Adcock IM, Tabarsi P, Masjedi MR, Mansouri D, Velayati AA, Casanova J-L, Barnes PJ. 2015. Interaction of pattern recognition receptors with mycobacterium tuberculosis. Journal of Clinical Immunology 35(1):1–10. DOI: 10.1007/s10875-014-0103-7.
- Palumbo SA, Maxino F, Williams AC, Buchanan RL, Thayer DW. 1985. Starch-ampicillin agar for the quantitative detection of Aeromonas hydrophila. Applied and Environmental Microbiology 50(4):1027–1030. DOI: 10.1128/aem.50.4.1027-1030.1985.
- Priyathilaka TT, Bathige S, Lee S, Nam B-H, Lee J. 2019. Transcriptome-wide identification, functional characterization, and expression analysis of two novel invertebrate-type Toll-like receptors from disk abalone (Haliotis discus discus). Fish & Shellfish Immunology 84:802–815. DOI: 10.1016/j.fsi.2018.10.062.
- Re F, Strominger JL. 2001. Toll-like receptor 2 (TLR2) and TLR4 differentially activate human dendritic cells. The Journal of Biological Chemistry 276(40):37692–37699. DOI: 10.1074/jbc.M105927200.
- Scott MJ, Billiar TR. 2008. β2-integrin-induced p38 MAPK activation is a key mediator in the CD14/TLR4/MD2-dependent uptake of lipopolysaccharide by Hepatocytes*. The Journal of Biological Chemistry 283(43):29433–29446. DOI: 10.1074/jbc.M803905200.
- Seki E, De Minicis S, Österreicher CH, Kluwe J, Osawa Y, Brenner DA, Schwabe RF. 2007. TLR4 enhances TGF-β signaling and hepatic fibrosis. Nature Medicine 13(11):1324–1332. DOI: 10.1038/nm1663.
- Sun H, Yu D, Wang X. 2011. Risk assessment for the occurrence of iridovirus in Rana Dybowskii in Hailin, Heilongjiang Province. Journal of Animal Ecology 15(1):47–52.
- Swift S, Karlyshev AV, Fish L, Durant EL, Winson MK, Chhabra SR, Williams P, Macintyre S, Stewart GS. 1997. Quorum sensing in Aeromonas hydrophila and Aeromonas salmonicida: Identification of the LuxRI homologs AhyRI and AsaRI and their cognate N-acylhomoserine lactone signal molecules. Journal of Bacteriology 179(17):5271–5281. DOI: 10.1128/jb.179.17.5271-5281.1997.
- Takeda K, Akira S. 2004. TLR signaling pathways. Seminars in Immunology 16(1):3–9. DOI: 10.1016/j.smim.2003.10.003.
- Tong Q, X-P D, Z-F H, Cui LY, Wang HB. 2018. Modelling the growth of the brown frog (Rana dybowskii). PeerJ 6:e4587. DOI: 10.7717/peerj.4587.
- Uematsu S, Sato S, Yamamoto M, Hirotani T, Kato H, Takeshita F, Matsuda M, Coban C, Ishii KJ, Kawai T, Takeuchi O, Akira S. 2005. Interleukin-1 receptor-associated kinase-1 plays an essential role for Toll-like receptor (TLR)7- and TLR9-mediated interferon-α induction. Journal of Experimental Medicine 201(6):915–923. DOI: 10.1084/jem.20042372.
- Xie J, Gou Y, Zhao Q, Wang K, Yang X, Yan J, Zhang W, Zhang B, Ma C, Wang R. 2014. Antimicrobial activities and membrane‐active mechanism of CPF‐C1 against multidrug‐resistant bacteria, a novel antimicrobial peptide derived from skin secretions of the tetraploid frog Xenopus clivii. Journal of Peptide Science: An Official Publication of the European Peptide Society 20(11):876–884. DOI: 10.1002/psc.2679.
- Xu Y-G, Chai L-H, Shi W, Wang D-D, Zhang J-Y, Xiao X-H. 2017. Transcriptome profiling and digital gene expression analysis of the skin of Dybowski’s frog (Rana dybowskii) exposed to Aeromonas hydrophila. Applied Microbiology and Biotechnology 101(14):5799–5808. DOI: 10.1007/s00253-017-8385-3.
- Yamamoto M, Sato S, Hemmi H, Hoshino K, Kaisho T, Sanjo H, Takeuchi O, Sugiyama M, Okabe M, Takeda K, Akira S. 2003. Role of adaptor TRIF in the MyD88-independent toll-like receptor signaling pathway. Science 301(5633):640–643. DOI: 10.1126/science.1087262.
- Yang S-J, Xiao X-H, Xu Y-G, Li D-D, Chai L-H, Zhang J-Y. 2012. Induction of antimicrobial peptides from Rana dybowskii under Rana grylio virus stress, and bioactivity analysis. Canadian Journal of Microbiology 58(7):848–855. DOI: 10.1139/w2012-055.
- Yilmaz S. 2019. Effects of dietary caffeic acid supplement on antioxidant, immunological and liver gene expression responses, and resistance of Nile tilapia, Oreochromis niloticus to Aeromonas veronii. Fish & Shellfish Immunology 86:384–392. DOI: 10.1016/j.fsi.2018.11.068.
- Zhang M, Jia X-Y, Ma Y-D, Ma JZ. 2010. Genetic diversity and differentiation of the Dybowski’s frog (Rana dybowskii) in Northeast China. Journal of Forestry Research 21(2):239–245. DOI: 10.1007/s11676-010-0039-6.