
Abstract
Lacertid and amphisbaenian lizards are two squamate reptile lineages very divergent morphologically. In fact, adaptation to burrowing deeply modified amphisbaenian worm-like body. Lacertids instead have a typical reptile morphology with a long tail and four well-developed limbs. Despite so different in appearance, they are evolutionarily very close as evidenced by molecular phylogenetic approaches. Consistently, a slow-evolving satellite DNA (IMO-TaqI) described in lacertid lizards was isolated from the genome of the amphisbaenian Trogonophis wiegmanni too. Comparison with lacertid repeats evidenced great similarity, highlighting that molecular characters appeared very suitable especially when morphology is subjected to strong selective pressures.
Introduction
Squamates (lizards, snakes and amphisbaenians) are a vast assemblage of reptiles currently representing, with over 11,500 described species (http://www.reptile-database.org), the most diversified and species rich reptilian group. Molecular clock estimates and fossil records date the origin of squamates at the Permian/Triassic boundary, ca 257 million years ago (Simões et al. Citation2018). Starting from stem species, such as Megachirella wachtleri, that possessed a lizard-like morphology, these animals in the course of their long evolutionary history have repeatedly evolved snake-like morphologies, often as an adaptation to life as underground diggers (e.g., Greer Citation1991). Skinks, pygopodids and anguids are good examples of lizards that have experimented this evolutionary trend. However, among squamate reptiles, snakes, dibamids (or blind lizards) and amphisbaenians (or worm lizards) (“Krypteia” sensu Gauthier et al. Citation2012) are those which have completely modified their anatomy as an adaptation to burrowing. Snakes, after an evolutionary phase of underground life, have reoccupied surface habitats, whereas blind and worm lizards have embarked on a “dead-end road”, adapting themselves to a fossorial life. This is witnessed by modification in their skull, strongly ossified and akinetic to work like a ram for excavation, and by vestigial eyes and no external ear openings as a protection against mechanic traumas (Gans Citation1974).
A convergent “Bauplan”, as the result of adaptation to the same lifestyle in snakes, amphisbaenians and dibamids, has made a morphology-based phylogeny of squamates controversial (e.g., Rieppel Citation1984; Estes et al. Citation1988; Schwenk Citation1988; Conrad Citation2008; Gauthier et al. Citation2012).
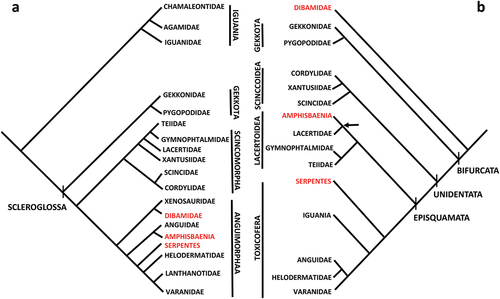
These difficulties due to homoplasy in morphological traits stimulated phylogenetic reconstructions based on gene-sequences that are less prone to convergence (Townsend et al. Citation2004). In fact, despite the distinctive core fossorial clades (dibamids, amphisbaenians and snakes) are widely supported across morphological data sets, they never group together in molecular trees based on either mitochondrial or nuclear markers (see Vidal & Hedges Citation2005; Reeder et al. Citation2015; Zheng & Wiens Citation2016) (). Paradoxically, clades as Iguania and Lacertidae, not showing any tendency to limb reduction (with the possible exception of the fossil lacertid Cryptolacerta, Tałanda Citation2016; but see also Müller et al. Citation2011), are considered closely related to snakes and amphisbaenians, respectively. Indeed, Gauthier et al. (Citation2012) raised doubts about the reliability of molecule-based phylogeny, considering possible alteration in evolutionary rate due to, for example, generation time or drastic changes in population size in survivors of mass extinctions.
Figure 1. Comparison between a) a phylogenetic tree morphology-based (simplified from Estes et al. Citation1988) and b) a phylogenetic tree molecular-based (simplified from Vidal & Hedges, Citation2005). In red, taxa with extremely modified body as adaptation to burrowing (“Krypteia” sensu Gauthier et al. Citation2012). Arrow in b) indicates Lacertibaenia clade.
In this context, satellite DNAs (satDNA henceforth) can be very helpful to settle phylogenetic controversies. This genomic fraction, which forms a substantial part of eukaryotic genomes (in some cases, over 50%), consists of long arrays of head-to-tail linked repeats, and it is the main constituent of (peri)/centromeric and/or telomeric constitutive heterochromatin. SatDNAs basic repeating units (monomers) are usually AT-rich and range in length from only a few base pairs (bp) to more than 1000 bp, building up 100 Mb long arrays (see Plohl et al. Citation2008, for a review). Although satDNA monomers are present with many thousands of copies per genome, sequence divergence between monomers of a given satDNA family is usually low (up to 15%) (e.g., King & Cummings Citation1997). This homogeneity is the result of the non-independent evolution of monomers, which is a consequence of concerted evolution, a process leading to the homogenization of mutations throughout members of a repetitive family and their fixation within a group of reproductively linked organisms (see Dover Citation1986). The evolutionary dynamics of satDNAs determine their marked taxon specificity not only at genus/species level but also at high-rank taxon level (Dover et al. Citation1982; Grechko Citation2002).
In reptiles, little information exists on satDNA array size, composition and long‐range organization, with the exception represented by Lacertidae, sister group to Amphisbaenia in the Lacertibaenia clade sensu Vidal and Hedges (Citation2005) (). So far, six satDNA families have been described for the lacertid genome (Capriglione et al. Citation1989, Citation1991, Citation1994, Citation1998; Capriglione Citation2000; Ciobanu et al. Citation2003, Citation2004; Grechko et al. Citation2005, Citation2006; Giovannotti et al. Citation2014, Citation2018, Citation2020; Rojo et al. Citation2015), revealing several common features, such as the same range of monomer lengths (140–190 bp), AT content (tendency toward AT enrichment 50–65%) and homopolymeric (A3–4 and T3–4) stretches. Some of these sequences are only observed in related species, whereas “IMO-TaqI” family (sensu Giovannotti et al. Citation2014) is conserved at the family level with a very low evolutionary rate (from 0.1% to 0.5% per million years, Myr henceforth) (see also Rojo et al. Citation2015; Giovannotti et al. Citation2018, Citation2020) that is comparable to levels found for slow evolving satDNAs in sturgeons (0.07–0.11%; Robles et al. Citation2004), scincid lizards (0.13%; Giovannotti et al. Citation2013) and cetaceans (0.2%; Arnason et al. Citation1992). This slow evolutionary rate is connected with the conservatism of this satDNA. Indeed, data on the phylogenetic distribution of IMO-TaqI among lacertids indicate that the evolutionary history of this satDNA is at least ~45 Myr old (Giovannotti et al. Citation2020). One explanation of this slow rate could be related to the location of IMO-TaqI in chromosome regions less prone to concerted evolution. In fact, as already observed in our previous works (e.g., Giovannotti et al. Citation2014, Citation2018, Citation2020; Rojo et al. Citation2015), IMO-TaqI repeats are located in interstitial/pericentromeric position (less susceptible to physical association) on a subset of chromosomes. This would make the exchange between non-homologous chromosomes bearing IMO-TaqI sequences difficult. This could reduce non-sister chromatid exchange and homogenization, thus determining a lower rate of interspecific divergence and a higher degree of intraspecific repeat heterogeneity. Indeed, in the sequences located on the non-recombining W chromosome of the Lacerta species, the absence of the homogenizing effect between autosomal and W-specific repeats determined an intraspecific heterogeneity similar to that found in the genus Timon, in which the presence of IMO-TaqI on only nine chromosomes could explain the low homogenization rate among repeats (Giovannotti et al. Citation2018). On the contrary, in the genus Iberolacerta, the HindIII satDNA is more widespread in the genome compared to IMO-TaqI and is centromerically located on almost all the acrocentric chromosomes (Giovannotti et al. Citation2014). This chromosomal location would favor physical association and crossing‐over between non-homologous chromosomes and then concerted evolution and intraspecific homogenization of satDNA, with a consequent deep interspecific divergence (Giovannotti et al. Citation2014). However, it cannot be excluded that the conservatism observed for IMO-TaqI could be also favored by a selective pressure deriving from a putative functional role, as already hypothesized for this satDNA by Giovannotti et al. (Citation2018). On the other hand, more and more scientific researches are unveiling functional roles for transcripts of satDNAs (e.g., Grewal & Elgin Citation2007; Feliciello et al. Citation2015; Kuhn Citation2015).
These features render IMO-TaqI satDNA a very good candidate for phylogenetic issues. The aim of the present paper was to check the occurrence of this satDNA in representatives of possible sister taxa to Lacertidae, namely Amphisbenia and Teiformata in the Lacertoidea clade () to verify if this repetitive element can be considered a synapomorphy of Lacertoidea or Lacertibaenia or only of Lacertidae.
Materials and methods
Animals
For chromosome and DNA analysis, one female and one male of Trogonophis wiegmanni Gervais, 1835 (Amphisbenia, family Trogonophidae) and one female of Gallotia galloti were used in this study (). T. wiegmanni specimens were collected on the Atlantic coast at 22 km south the city of Safi (W-Morocco), while samples of G. galloti were obtained from a captive-bred specimen. Permissions for fieldwork and ethics approval of experimental procedures were issued by the High Commissariat for Water and Forest (Decision Number 05/2013 HCEFLCD/DLCDPN/DPRN/CFF), Morocco.
Table I. Summary of repeat features for the species studied.
DNA extraction
Genomic DNA of T. wiegmanni and G. galloti was extracted from 10 μl of whole blood, using standard protocols with proteinase K digestion followed by phenol/chloroform extraction (see Sambrook et al. Citation1989). Genomic DNA of representatives of different clades of squamate reptiles [Gekko vittatus Houttuyn, 1782: Gekkota; Broadleysaurus major (Duméril, 1851), Chalcides ocellatus (Forsskål, 1775): Scincoidea; Hierophis viridiflavus (Lacépède, 1789), Anolis sagrei Duméril & Bibron, 1837, Anguis fragilis Linnaeus, 1758: Toxicofera; Gallotia galloti (Oudart, 1839), Lacerta strigata Eichwald, 1831, Tupinambis rufescens (Günther, 1871) and Cnemidophorus sp.: Lacertoidea], was extracted from ethanol preserved tissues of voucher specimens deposited at the Department of Life and Environment Science of the Polytechnic University of Marche (Ancona, Italy).
Isolation and characterization of IMO-TaqI satDNA repeats
A pair of degenerate primers (TaqI F: 5′-AAATTCTGACCSYGSGGGTTAG-3′; TaqI R: 5′-AAAATVGTGCCAAACTGTTG-3′) designed by Giovannotti et al. (Citation2018) was used to PCR-search IMO-TaqI satDNA repeats from the genomes of T. wiegmanni, G. galloti as well as other squamate representative species. PCR products were run in 2% agarose gels and the band corresponding to the amplified monomers was excised from the gel, purified with Pure Link Quick Gel Extraction Kit (Invitrogen, Carlsbad, CA, USA) and cloned in the pCR®-blunt vector with Zero Blunt PCR Cloning Kit (Invitrogen, Carlsbad, CA, USA) following manufacturer’s recommendations. Clones of IMO-TaqI were sequenced on an ABI PRISM 3730XL (Applied Biosystems, Foster City, CA, USA) automatic sequencer.
Sequence analysis
In order to compare IMO-TaqI satDNA obtained in the present study from T. wiegmanni (14 sequences) with the same satDNA obtained from lacertid lizards, sequences from i) Lacerta bilineata (16 sequences) (Giovannotti et al. Citation2018), Iberolacerta horvathi (6 sequences) (Rojo et al. Citation2015), I. monticola (5 sequences, Giovannotti et al. Citation2014), I. galani (5 sequences, Giovannotti et al. Citation2014), and Timon lepidus (10 sequences) (Giovannotti et al. Citation2018) (subfamily Lacertinae, Lacertini tribe); ii) Atlantolacerta andreanskyi (10 sequences) (subfamily Lacertinae, Eremiadini tribe) (Giovannotti et al. Citation2020); and iii) Gallotia galloti (subfamily Gallotinae) (15 sequences, present paper) were used to produce a phylogenetic tree. A total of 81 sequences were then aligned using the on-line version of Clustal Omega (https://www.ebi.ac.uk/Tools/msa/clustalo/) with default parameters (Sievers et al. Citation2011). The phylogenetic relationships among these 81 IMO-TaqI sequences were inferred using Bayesian analysis. The best fit model of nucleotide substitution for IMO-TaqI repeats aligned as above was selected among 88 models available in jModeltest 2.1.3 (Darriba et al. Citation2012) using the Akaike Information Criterion corrected for small samples (AICc). The most appropriate model was JC + G. Bayesian analysis was carried out with MrBayes v3.2 (Ronquist et al. Citation2012) using the appropriate model of nucleotide substitution (JC + G) selected as indicated above. This analysis was run with four incrementally heated Markov chains for 2 × 10⁶ generations in two independent runs with samplings at intervals of 500 generations that produced 4,000 trees. Once the stationarity had been reached, both in terms of likelihood scores and parameter estimation, 1,000 trees (25% “burn-in”) were discarded in both runs and a majority-rule consensus tree was generated from the 3,000 remaining (post burn-in) trees. The pp was calculated as the percentage of samples recovering any particular clade (Huelsenbeck & Ronquist Citation2001) with pp ≥ 95% indicating a statistically significant support (Wilcox et al. Citation2002). The BA tree was edited using FigTree v1.4.0 (https://tree.bio.ed.ac.uk/software/figtree/). Average AT content of the monomeric unit of IMO-TaqI was determined with MEGA version 5 (Tamura et al. Citation2011). Intraspecific nucleotide diversity (π), haplotype number, and haplotype diversity (h) were estimated using DnaSP v. 5 (Librado & Rozas Citation2009). Net average genetic distances between groups were calculated under the appropriate substitution model (see above) with MEGA v. 5. Rate of IMO-TaqI evolution was determined for the species here studied according to the divergence times estimated for Lacertidae and Amphisbaenia (ca. 130 Myr) by Simões et al. (Citation2018) and for Gallotinae and Lacertinae (ca. 60 Myr) by Hipsley et al. (Citation2009). The consensus sequences of T. wiegmanni and G. galloti repeats were determined with the program EMBOSS, available on-line at https://www.ebi.ac.uk/Tools/msa/emboss_cons/. The consensus sequences of these species were then aligned using the on-line version of Clustal Omega (https://www.ebi.ac.uk/Tools/msa/clustalo/) in order to verify sequence similarity between IMO-TaqI repeats of amphisbaenians and lacertids.
The occurrence of genetic differentiation between monomeric repeats in the species analyzed was also assessed by the analysis of molecular variance (AMOVA) (Excoffier et al. Citation1992) calculating Φ-statistics. This test was performed at two hierarchical levels to check how satDNAs sequence variability was partitioned within and among species. A total of six tests were carried out in order to compare T. wiegmanni with representatives of lacertid lineages: Lacertini (Lacerta autosome specific repeats, Lacerta W-specific repeats Timon, I. horvathi), Eremiadini (A. andreanskyi) and Gallotinae (G. galloti) (). The tests were based on pair wise genetic distances between clones and performed as implemented in ARLEQUIN 2.000 (Schneider et al. Citation2000), using 1000 permutations.
Table II. AMOVA analysis. The test was carried on IMO-TaqI satDNA sequences from Trogonophis wiegmanni (this paper), Atlantolacerta andreanskyi (AAN), Gallotia galloti (GGA), Lacerta bilineata (LBI_A: repeats from autosomes and LBI_W: from sex chromosome) and Timon lepidus (TLE), Iberolacerta horvathi (Rojo et al. Citation2015). Significance levels: *= p < 0.05, **=P < 0.01, ***= p < 0.001.
Chromosome analyses
Metaphase chromosomes were obtained from females and males of T. wiegmanni starting from lymphocyte cell cultures established from blood samples as reported by Ezaz et al. (Citation2005). Metaphase chromosomes from G. galloti were obtained from tail tip tissue as described in Rojo et al. (Citation2015) and Rens et al. (Citation2006). Fluorescence in situ hybridization (FISH) experiments were performed on metaphase preparations of T. wiegmanni and G. galloti using the probes obtained by PCR amplification of IMO-TaqI satDNA clones from these two species. The probes were labeled by PCR with biotin-16-dUTP (Roche Diagnostics GmbH, Mannheim, Germany). Slide pretreatment, denaturation, hybridization, posthybridization washes and detection were performed according to Schwarzacher and Heslop-Harrison (Citation2000). Chromosomes were observed with a Leica Leitz DMRBE epifluorescence microscope and the images were captured and processed with a Leica CytoVision version 7.2 system. In order to identify possible relationships between IMO-TaqI satDNA and the constitutive heterochromatin, C-banding was performed on metaphase chromosomes following Sumner (Citation1972). C-banded metaphases were mounted and stained with Vectashield mounting medium with 4′,6-diamidino-2-phenylindole (DAPI) (Vector Laboratories, Burlingame, CA, USA).
Results
Isolation and characterization of IMO-TaqI satDNA
PCR amplification using degenerate primers was successful in both G. galloti and T. wiegmanni. No PCR product was obtained for the representatives of other Squamata clades (Gekkota, Scinciformata, Toxicofera). The length of the 15 clones sequenced of G. galloti ranged from 188 to 194 bp, whereas the 14 clones of T. wiegmanni ranged from 176 to 198 bp (). IMO-TaqI features of the other species here used for comparison are reported in Giovannotti et al (Citation2014, Citation2018, Citation2020). and Rojo et al. (Citation2015). Sequences of satDNA repeats of the two species were deposited in GenBank (accession numbers: from OM810369 to OM810397). Six and 13 different haplotypes were detected in G. galloti and T. wiegmanni, respectively, with values of haplotype diversity (Hd) of 0.810 for the former and 0.989 for the latter species ().
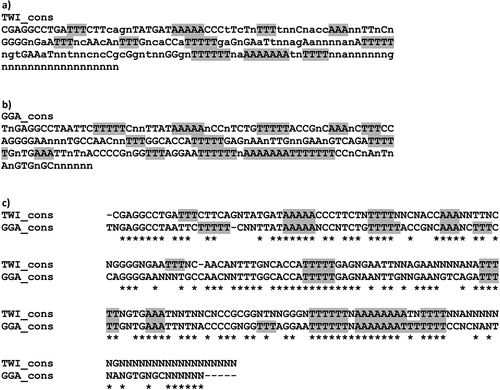
This satDNA showed an average AT content of 56.6% in G. galloti, and 58.2% in T. wiegmanni, indicating an enrichment in AT, as typical for these genomic elements, with short A and T stretches ranging from 3 to 7 base pairs (). The BLAST search (using either megablast or blastn algorithm) found significant similarity with Iberolacerta, Lacerta and Timon sequences for T. wiegmanni satDNA repeats (up to 96.17% identity and query cover up to 97% with Iberolacera horvathi repeats) and evidenced high similarity (100% identity with a query over of 98%) for some G. galloti clones to W-specific IMO-TaqI re-peats of Lacerta. In addition, the alignment of IMO-TaqI consensus sequence of T. wiegmanni and G. galloti highlighted a certain degree of similarity shared by the repeats of amphisbaenians and lacertids.
Figure 2. (a) Consensus sequences of IMO-TaqI satDNA repeats from Trogonophis wiegmanni (TWI) and (b) Gallotia galloti (GGA), (c) Alignment of IMO-TaqI consensus sequences from T. wiegmanni and G. galloti. Highlighted in grey, stretches of A/T characterizing the repeats. *s indicate matches between the two sequences.
As for genetic variability of clones, intraspecific nucleotide diversity (π) values were 0,17095 ± 0,01762 in G. galloti and 0.18675 ± 0.01327 in T. wiegmanni (). Nucleotide diversity values in the two species here studied are relatively high, even when compared to the values recorded for IMO-TaqI repeats located on the non-recombining W chromosome of Lacerta species (Giovannotti et al. Citation2018). Nucleotide diversity values of Lacerta species when autosomal and W-specific repeats are pulled together in the analysis (Giovannotti et al. Citation2018) become closer, although still lower, to the values here recorded for G. galloti and T. wiegmanni.
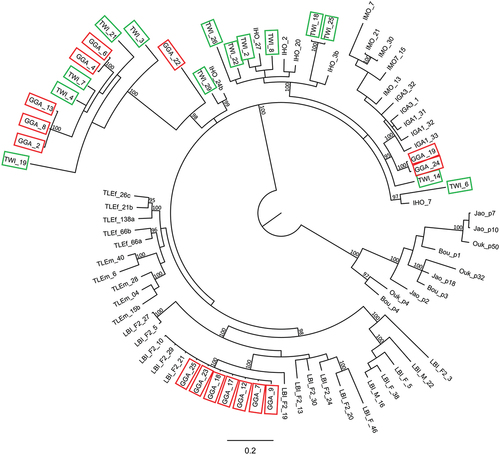
The phylogenetic tree obtained from Bayesian analysis of 81 IMO-TaqI satDNA is shown in . The 14 clones of T. wiegmanni sequenced do not form a single group but they are divided into five clusters: five T. wiegmanni repeats group together with five G. galloti repeats (pp = 100%); six T. wiegmanni repeats group together with four I. horvathi repeats (pp = 100%); one T. wiegmanni repeat groups together with one I. horvathi repeat (pp = 95%); one T. wiegmanni repeat groups together with one I. horvathi repeat (pp = 97%); finally, one T. wiegmanni repeat belongs to a non-supported clade (pp = 93%) containing all the repeats of I. galani and I. monticola and two of G. galloti. However, all the sequences from T. wiegmanni are within the cluster containing Lacertini + Gallotinae repeats, whereas the repeats from A. andreanskyi (Eremiadini) form a different supported clade (pp = 100%) external to all other repeats. Lastly, seven G. galloti clones nested within the W-specific sequences of L. bilineata, with statistical support (pp = 100%).
Figure 3. Bayesian tree depicting the phylogenetic relationships among IMO-TaqI satDNA repeats isolated from Trogonophis wiegmanni (TWI, green box) and Gallotia galloti (GGA, red box) and compared to other Lacertibaenia representatives (Jao, Ouk, Bou: Atlantolacerta andreanskyi; IGA: Iberolacerta galani; IHO: Iberolacerta horvathi; IMO: Iberolacerta monticola; LBI, Lacerta bilineata; TLE: Timon lepidus). At nodes only posterior probability values > 95% (BA) are reported.
The evolutionary rate of IMO-TaqI repeats was 0.028%/Myr when IMO-TaqI repeats of T. wiegmanni and G. galloti (basal lacertid) were compared, whereas the comparison between G. galloti and Lacertinae species (see Giovannotti et al. Citation2018) resulted in a rate of 0.068%/Myr. The evolutionary rate of this satDNA was 0.068%/Myr when T. wiegmanni was compared to Lacertinae (see Giovannotti et al. Citation2018).
The AMOVA analysis was carried out comparing IMO-TaqI satDNA of T. wiegmanni with 1) Lacerta autosome repeats; 2) Lacerta W repeats; 3) Timon; 4) A. andreanskyi; 5) G. galloti; 6) Iberolacerta horvathi. The among groups variance component was particularly low in comparisons involving species with this satDNA represented on few chromosomes (Timon, 30,89%, ΦST 0.30885, p < 0.001; I. horvathi, 13.71%, ΦST 0.13712, p < 0.001), on the W of Lacerta (36.17%, ΦST 0.36166, p < 0.001) or very poorly represented in the genome (G. galloti, 14.74%, ΦST 0.14736, p < 0.05). Intraspecific variance was high owing to the heterogeneity of T. wiegmanni repeats, with percentage of variation ranging from 49.40% to 85.26% and ΦSTATISTICS always significant, even though ΦST was low and weakly significant in the comparison involving T. wiegmanni and G. galloti ().
Chromosome analysis
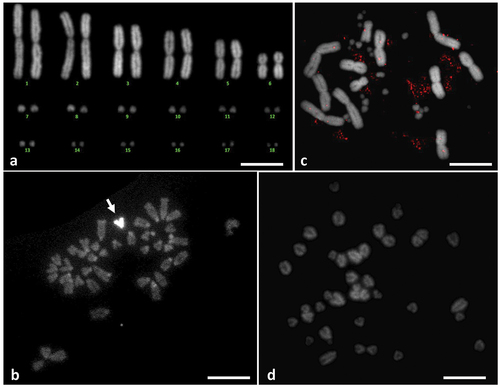
Our chromosome data are in accordance with Huang et al. (Citation1967) who described the karyotype of Trogonophis wiegmanni as composed of 12 biarmed macrochromosomes and 24 microchromosomes, without apparent heteromorphic chromosomes between sexes (). The same apply to the chromosomal complement of G. galloti that is consistent with data by Olmo et al. (Citation1987): 40 acrocentric chromosomes, without a clear distinction between macro- and microchromosomes and with a ZW-sex chromosome system. After C-banding and DAPI staining, no evident heterochromatin was detectable (). As for G. galloti, its acrocentric chromosomes showed clear heterochromatic blocks at all centromeres and fainter bands at some telomeres, with heteromorphic W chromosome completely heterochromatic (). FISH experiments with species-specific IMO-TaqI satDNA probes detected no signals both in T.wiegmanni and in G. galloti chromosomes (, respectively).
Figure 4. C‐banded chromosomes stained with DAPI of Trogonophis wiegmanni (a) and Gallotia galloti (b). FISH with IMO-TaqI probe onto metaphases of T. wiegmanni (c) and G. galloti (d, white arrow indicates W sex-chromosome). Scale bars = 10 μm.
Discussion
Satellite DNAs represent rapidly evolving genomic elements, and therefore, even among most closely related species, they usually differ in nucleotide sequence, copy number, and/or composition of satellite families (Csink & Henikoff Citation1998). However, some satDNA families evolve more slowly than others and occur in several closely related species with different degrees of sequence similarity (Bachmann & Sperlich Citation1993; Mantovani et al. Citation1997; Watabe et al. Citation1997). Some satDNAs seem to be rather ancient and are widely distributed among higher taxa (Modi et al. Citation2004; Robles et al. Citation2004). Consequently, some of these genomic elements may be valuable taxonomic identification tools while others might be useful for phylogenetic analyses at higher taxonomic levels. This is the case of IMO-TaqI satDNA, widely occurring in the genome of lacertid lizards
In the present research, PCR amplification of IMO-TaqI was successful in Lacertibaenia clade (sensu Vidal & Hedges Citation2005, see ), while in the other squamate taxa tested for the occurrence of this satDNA no PCR product was obtained. This result would suggest that IMO-TaqI satDNA appeared in the genome of the last common ancestor of Amphisbaenia and Lacertidae after their split from the Laterata clade (see Vidal & Hedges Citation2005). This result would push the origin of this genomic element further back in time with reference to an age of at least ~45 Myr previously hypothesized for IMO-TaqI by Giovannotti et al. (Citation2020). Indeed, according to the combined molecular and morphological relaxed-clock by Simões et al. (Citation2018), this repetitive element would have made its appearance during Cretaceous, before Amphisbaenia and Lacertidae separated, thus would be at least ~135 Myr old (Tałanda Citation2016; Simões et al. Citation2018). Therefore, IMO-TaqI satDNA could be considered a molecular synapomorphy of Lacertibaenia, confirming a close phylogenetic relationship between Amphisbaenia and Lacertidae, despite the deep morphological divergence in consequence of adaptation to burrowing of the former taxon (see Vidal & Hedges Citation2005). The close relationships within Lacertibaeniaa seems to be confirmed by the phylogenetic analysis of IMO-TaqI repeats. Indeed, the IMO-TaqI repeats isolated from T. wiegmanni genome did not form a species-specific clade in an out-group position in relation to sequences obtained from lacertids. On the contrary, these sequences are nested within the cluster containing Lacertini + Gallotinae repeats, and in some cases grouped together with the repeats isolated from the genome of lacertid lizard G. galloti, or Iberolacerta species (showing a close relationship with I. horvathi) forming statistically supported clades/subclades (). Further evidence for the close relationship of T. wiegmanni IMO-TaqI repeats with lacertid repeats is brought from the Blast search, highlighting a high degree of identity (up to 96.17%) and query cover (up to 97%) with lacertid repeats (especially with I. horvathi, Rojo et al. Citation2015). This relatedness is corroborated by the alignment of IMO-TaqI consensus sequences of T. wiegmanni and G. galloti showing a certain degree of sequence identity ().
Another result that needs an explanation concerns the lack of fluorescence on chromosomes of both T. wiegmanni and G. galloti after FISH with IMO-TaqI probes. Probably, this is due to the low number of repeats of the satellite in these genomes that results in the lack of a visible fluorescent signal in FISH experiments. This hypothesis seems to be supported by the values of intraspecific nucleotide diversity of this genomic element that are much higher than the values previously reported for lacertids (Giovannotti et al. Citation2014, Citation2018, Citation2020; Rojo et al. Citation2015). A reduced number of repeats could also explain the very low evolutionary rate of IMO-TaqI of G. galloti and T. wiegmanni (0.028–0.068%/Myr) when compared to data so far available for this genomic element (from 0.1% to 0.5%/Myr, see Giovannotti et al. Citation2014, Citation2018, Citation2020; Rojo et al. Citation2015). Indeed, the mechanisms of interaction between tandem repeat units that lead to the homogenization of their sequence (e.g., concerted evolution) do not act effectively when the number of repeats is low (see Nijman & Lenstra Citation2001 and references therein), thus leading to a low evolutionary rate and high intraspecific nucleotide diversity of monomer sequences. The fact that concerted evolution is not at work in these two species seems to be confirmed by the results of the analysis on genetic variability of this satDNA. Indeed, the phylogenetic reconstruction of the relationships between IMO-TaqI repeats of the species here investigated shows that repeats of T. wiegmanni and G. galloti are in some cases grouped together. This low degree of differentiation, consistent with a poor degree of intraspecific homogenization, is confirmed by AMOVA analysis. This test shows that in the comparison between T. wiegmanni and G. galloti the percentage of variation attributable to among species differentiation is rather low with a low and weakly significant ФST. On the contrary, in the comparisons involving T. wiegmanni and Lacerta and Timon, the percentage of variation among species was higher with a highly significant ФST. The comparison with I. horvathi showed a very low among species variation, although with a highly significant ФST (). Interestingly, this latter species has the IMO-TaqI repeats clusters on a small number of chromosomes (Rojo et al. Citation2015), condition that could hinder an effective homogenization of the repeats.
For both Gallotia galloti and Trogonophis wiegmanni genomes, the low copy number of IMO-TaqI repeats in the genomes could be explained by the “library” hypothesis (Fry & Salser Citation1977, Meštrović et al. Citation1998; Ugarković & Plohl Citation2002). Indeed, according to this hypothesis, related species would share a collection or library of different conserved satDNA families (Fry & Salser Citation1977, Meštrović et al. Citation1998; Ugarković & Plohl Citation2002; Ruiz-Ruano et al. Citation2016) or even a library of different monomer variants (Cesari et al. Citation2003). In this way, satDNAs may persist in the genome at latent locations for long evolutionary time forming a library of satellite sequences. An example of this is represented by the coleopteran insect of the genus Palorus. In this genus, four satDNA families remained completely frozen for long evolutionary periods of up to 60 million years (Mravinac et al. Citation2002, Citation2005). For stochastic reasons, different families or monomer variants of these repetitive elements would amplify or contract in different species. Mechanisms of concerted evolution would lead in this way to a species-specific profile of satDNA families/variants (Ruiz-Ruano et al. Citation2016; Rojo et al. Citation2015 and references therein). According to this hypothesis, only few IMO-TaqI sequences would have survived until now in the genome of G. galloti, where these repeats did not undergo amplification and homogenization by concerted evolution, thus remaining unchanged for a long evolutionary time. On the other hand, it is likely that other satDNA families underwent amplification as it seems to be suggested by the heterochromatic blocks highlighted by C-banding in the chromosomes of this species. In the light of these considerations, it seems that the library hypothesis could be a reliable scenario to explain the low number of IMO-TaqI repeats also in the genome of T. wiegmanni, where this satDNA did not amplify to form visible clusters when FISH with IMO-TaqI probe was carried out on the chromosomes of this species. This scenario with few monomers variants remained unchanged in the genome of T. wiegmanni and G. galloti would also explain the very low evolutionary rate obtained when IMO-TaqI repeats from these species are compared. In addition, the library hypothesis would also explain the fact that sequences of these two species with no amplified variants and high intraspecific nucleotide diversity do not cluster in a species/genus-specific way in the phylogenetic tree: different variants from the library that cluster with sequences from other species not following phylogenetic relationships among taxa. In this respect, it is interesting the clustering and the high similarity (100% identity and 98% of query cover) of some G. galloti repeats with W-specific repeats from Lacerta that seem to corroborate the hypothesis that the IMO-TaqI repeats in the two species here investigated are “molecular fossils”.
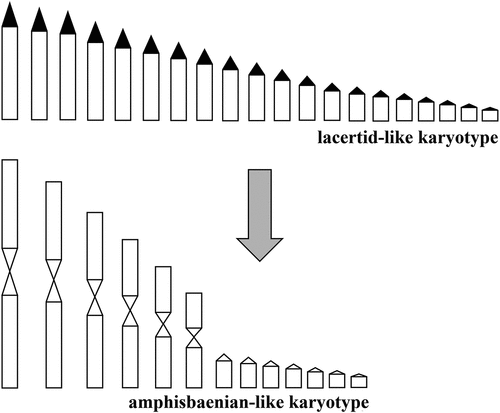
In the case of amphisbaenians, however, it is also intriguing to speculate on the possible relationship between the apparent low number of IMO-TaqI repeats and the chromosomal rearrangements that would have been implied in the karyotype evolution of these fossorial lizards. In this regard, it is worth noting that 12 metacentric macrochromosomes and 7 to 12 pairs of microchromosomes form the most common amphisbaenian karyotype, while variations from this complement were probably obtained from centric fission producing higher diploid numbers and many acrocentric chromosomes (see Cole & Gans Citation1987; Laguna et al. Citation2010). Interestingly, comparison with lacertid lizards suggests a possible evolutionary trend leading to the basic amphisbaenians karyotype. In fact, the most common lacertid lizard complement is composed by 38 uniarmed chromosomes, gradually decreasing in size. In this context, it is possible that the common ancestor of Lacertibaenia was characterized by a lacertid-like karyotype and that the origin of the amphisbaenian complement was the result of extensive Robertsonian fusions, probably in concomitance with the occupation of a fossorial niche, leading to 12 metacentric macro-plus 14 microchromosomes. The condition with 24 micro-chromosomes would be obtained through successive fissions of some small chromosomes (). It could be hypothesized that during the reciprocal translocation forming biarmed macrochromosomes IMO-TaqI satDNA (located at pericentromeric level) would have been largely lost along with heterochromatin, indeed not detectable after C-banding in the genome of T. wiegmanni, and of amphisbaenians in general (see also Medrano et al. Citation2011). In this way, only few IMO-TaqI sequences would have survived in the genome of T. wiegmanni. Afterwards, metacentric chromosomes would have prevented any further amplification of satDNA (as suggested by Hatch et al. Citation1976 for Dipodomys), thus transforming the few IMO-TaqI sequences in “molecular fossils” due to the impossibility of going towards homogenization through concerted evolution. Of course, further studies on amphisbaenians will be needed to choose between the two alternatives (“library hypothesis” or sequences loss via centric fusions).
Figure 5. Hypothesis of derivation of amphisbaenian chromosomes from lacertid-like complement by several centric fusion determining loss of IMO-TaqI satellite and associated heterochromatin (black areas in the lacertid-like karyotype).
To conclude, molecular characters appeare more and more useful in phylogenetic inference, especially in those cases in which morphology is subjected to strong selective pressures, as in the case of fossorial squamate reptiles. Here, in fact, the conservatism of the IMO-TaqI sequences confirm the close relationship of amphisbaenians and lacertids within the Lacertibaenia clade (Vidal & Hedges Citation2005), despite a radical morphological divergence.
Acknowledgments
We are pleased to dedicate this article to the late Teresa Capriglione, a pioneer of satellite DNA research in Italy, who unfortunately died too prematurely.
Disclosure statement
No potential conflict of interest was reported by the author(s).
Additional information
Funding
References
- Arnason U, Gretarsdottir S, Widegren B. 1992. Mysticete (baleen whale) relationships based upon the sequence of the common cetacean DNA satellite. Molecular Biology and Evolution 9(6):1018–1028. DOI: 10.1093/oxfordjournals.molbev.a040776.
- Bachmann L, Sperlich D. 1993. Gradual evolution of a specific satellite DNA family in Drosophila ambigua, D. tristis, and D. obscura. Molecuar Biology and Evolution 10:647–659.
- Capriglione T. 2000. Repetitive DNA as a tool to study the phylogeny of cold-blooded vertebrates. Chromosomes Today 13:183–194.
- Capriglione T, Cardone A, Odierna G, Olmo E. 1991. Evolution of a centromeric satellite DNA and phylogeny of lacertid lizards. Comparative Biochemistry and Physiology - Part B: Biochemistry & Molecular Biology 100(3):641–645. DOI: 10.1016/0305-0491(91)90233-4.
- Capriglione T, Cardone A, Odierna G, Olmo E. 1994. Further data on the occurrence and evolution of satellite DNA families in the lacertid genome. Chromosome Research 2(4):327–330. DOI: 10.1007/BF01552726.
- Capriglione T, De Santo MG, Odierna G, Olmo E. 1998. An alphoid-like satellite DNA sequence is present in the genome of a lacertid lizard. Journal of Molecular Evolution 46(2):240–244. DOI: 10.1007/PL00006299.
- Capriglione T, Olmo E, Odierna G, Smith DI, Miller OJ. 1989. Genome composition and tandemly repetitive sequence at some centromeres in the lizard Podarcis s. sicula Raf. sicula Raf. Genetica 79(2):85–91. DOI: 10.1007/BF00057925.
- Cesari M, Luchetti A, Passamonti M, Scali V, Mantovani B. 2003. Polymerase chain reaction amplification of the Bag320 satellite family reveals the ancestral library and past gene conversion events in Bacillus rossius (Insecta, Phasmatodea). Gene 312:289–295. DOI: 10.1016/S0378-1119(03)00625-5.
- Ciobanu DG, Grechko VV, Darevsky IS. 2003. Molecular evolution of satellite DNA CLsat in lizards from the genus Darevskia (Sauria: Lacertidae): Correlation with species diversity. Russian Journal of Genetics 39(11):1292–1305. DOI: 10.1023/B:RUGE.0000004145.00165.ee.
- Ciobanu DG, Grechko VV, Darevsky IS, Kramerov DA. 2004. New satellite DNA in Lacerta s. str. lizards (Sauria: Lacertidae): Evolutionary pathways and phylogenetic impact. JEZ-B 302B(6):505–516. DOI: 10.1002/jez.b.21014.
- Cole CJ, Gans C. 1987. Chromosomes of Bipes, Mesobaena, and other amphisbaenians (Reptilia), with comments on their evolution. American Museum Novitates 2869:1–9.
- Conrad JL. 2008. Phylogeny and systematics of Squamata (Reptilia) based on morphology. Bulletin of the American Museum of Natural History 310:1–182. DOI: 10.1206/310.1.
- Csink AK, Henikoff S. 1998. Large-scale chromosomal movements during interphase progression in Drosophila. The Journal of Cell Biology 143(1):13–22. DOI: 10.1083/jcb.143.1.13.
- Darriba D, Taboada GL, Doall R, Posada D. 2012. jModel test 2: More models, new heuristics and parallel computing. Nature Methods 9(8):772. DOI: 10.1038/nmeth.2109.
- Dover GA. 1986. Molecular drive in multigene families: How biological novelties arise, spread and are assimilated. Trends in Genetics 2:159–165. DOI: 10.1016/0168-9525(86)90211-8.
- Dover GA, Brown S, Coen E, Dallas J, Strachan T, Trick M. 1982. The dynamics of genome evolution and species differentiation. In: Dover G, Flavel R, editors. Genome evolution. London: Academic Press. pp. 343–372.
- Estes R, de Queiroz K, Gauthier J. 1988. Phylogenetic relationships within Squamata. In: Estes R, Pregill G, editors. Phylogenetic relationships of the lizard families. Stanford: Stanford University Press. pp. 119–282.
- Excoffier L, Smouse PE, Quattro JM. 1992. Analysis of molecular variance inferred from metric distances among DNA haplotypes: Application to human mitochondrial DNA restriction data. Genetics 131(2):479–491. DOI: 10.1093/genetics/131.2.479.
- Ezaz T, Quinn AE, Miura I, Sarre SD, Georges A, Marshall Graves JA. 2005. The dragon lizard Pogona vitticeps has ZZ/ZW micro-sex chromosomes. Chromosome Research 13(8):763–776. DOI: 10.1007/s10577-005-1010-9.
- Feliciello I, Akrap I, Brajković J, Zlatar I, Ugarković Đ. 2015. Satellite DNA as a driver of population divergence in the redflour beetle Tribolium castaneum. Genome Biology and Evolution 7(1):228–239. DOI: 10.1093/gbe/evu280.
- Fry K, Salser W. 1977. Nucleotide sequences of HS-α satellite DNA from kangaroo rat Dipodomys ordii and characterization of similar sequences in other rodents. Cell 12(4):1069–1084. DOI: 10.1016/0092-8674(77)90170-2.
- Gans C. 1974. Biomechanics. An approach to vertebrate biology. Phyladelphia, Toronto: Lippincott Company.
- Gauthier JA, Kearney M, Maisano JA, Rieppel O, Behlke ADB. 2012. Assembling the Squamate tree of life: Perspectives from the phenotype and the fossil record. Bulletin of the Peabody Museum of Natural History 53(1):3–308. DOI: 10.3374/014.053.0101.
- Giovannotti M, Nisi Cerioni P, Rojo V, Slimani T, Splendiani A, Olmo E, Caputo Barucchi V. 2018. Characterization of a satellite DNA in the genera Lacerta and Timon (Reptilia, Lacertidae) and its role in the differentiation of the W chromosome. JEZ-B 330(2):83–95. DOI: 10.1002/jez.b.22790.
- Giovannotti M, Nisi Cerioni P, Splendiani A, Ruggeri P, Olmo E, Caputo Barucchi V. 2013. Slow evolving satellite DNAs: The case of a centromeric satellite in Chalcides ocellatus (Forskål, 1775) (Reptilia, Scincidae). Amphibia-Reptilia 34(3):401–411. DOI: 10.1163/15685381-00002905.
- Giovannotti M, Rojo V, Nisi Cerioni P, González-Tizón A, Martínez-Lage A, Splendiani A, Naveira H, Ruggeri P, Arribas O, Olmo E, Caputo Barucchi V. 2014. Isolation and characterization of two satellite DNAs in some Iberian rock lizards (Squamata, Lacertidae). JEZ-B 322B(1):13–26. DOI: 10.1002/jez.b.22530.
- Giovannotti M, S’Khifa A, Nisi Cerioni P, Splendiani A, Slimani T, Fioravanti T, Olmo E, Caputo Barucchi V. 2020. Isolation and characterization of two satellite DNAs in Atlantolacerta andreanskyi (Werner, 1929) (Reptilia, Lacertidae). Journal of Experimental Zoology (Mol Dev Evol) 334(3):178–191. DOI: 10.1002/jez.b.22937.
- Grechko VV. 2002. Molecular DNA markers in phylogeny and systematics. Russian Journal of Genetics 38(8):851–868. DOI: 10.1023/A:1016890509443.
- Grechko VV, Ciobanu DG, Darevsky IS, Kosushkin SA, Kramerov DA. 2006. Molecular evolution of satellite DNA repeats and speciation of lizards of the genus Darevskia (Sauria: Lacertidae). Genome 49(10):1297–1307. DOI: 10.1139/g06-089.
- Grechko VV, Ciobanu DG, Darevsky IS, Kramerov DA. 2005. Satellite DNA of lizards of the genus Lacerta s. str. (the group L. agilis), the family Lacertidae Doklady. Biochemistry and Biophysics 400(1–6):44–47. DOI: 10.1007/s10628-005-0029-3.
- Greer AE. 1991. Limb reduction in squamates: Identification of the lineages and discussion of the trends. Journal of Herpetology 25(2):166–173. DOI: 10.2307/1564644.
- Grewal SIS, Elgin SCR. 2007. Transcription and RNA interference in the formation of heterochromatin. Nature 447(7143):399–406. DOI: 10.1038/nature05914.
- Hatch FT, Bodner A, Mazrimas JA, Moore DH. 1976. Satellite DNA and cytogenetic evolution. DNA quantity, satellite DNA and karyotype variations in kangaroo rats (Genus Dipodomys). Chromosoma 58(2):155–168. DOI: 10.1007/BF00701356.
- Hipsley CA, Himmelmann L, Metzler D, Müller J. 2009. Integration of Bayesian molecular clock methods and fossil-based soft bounds reveals early Cenozoic origin of African lacertid lizards. BMC Evolutionary Biology 9(1):151. DOI: 10.1186/1471-2148-9-151.
- Huang C, Clark HF, Gans C. 1967. Karyological studies on fifteen forms of amphisbaenians (Amphisbaenia: Reptilia). Chromosoma 22(1):1–15. DOI: 10.1007/BF00291283.
- Huelsenbeck JP, Ronquist F. 2001. MRBAYES: Bayesian inference of phylogenetic trees. Bioinformatics 17(8):754–755. DOI: 10.1093/bioinformatics/17.8.754.
- King LM, Cummings MP. 1997. Satellite DNA repeat sequence variation is low in three species of burying beetles in the genus Nicroporus (Coleoptera: Silphidae). Molecular Biology and Evolution 14(11):1088–1095. DOI: 10.1093/oxfordjournals.molbev.a025718.
- Kuhn GCS. 2015. ‘Satellite DNA transcripts have diverse biological roles in Drosophila’. Heredity 115(1):1–2. DOI: 10.1038/hdy.2015.
- Laguna MM, Amaro RC, Mott T, Yonenaga-Yassuda Y, Rodrigues MT. 2010. Karyological study of Amphisbaena ridleyi (Squamata, Amphisbaenidae), an endemic species of the Archipelago of Fernando de Noronha, Pernambuco, Brazil. Genetics and Molecular Biology 33(1):57–61. DOI: 10.1590/S1415-47572010005000009.
- Librado P, Rozas J. 2009. DnaSP v5: A software for comprehensive analysis of DNA polymorphism data. Bioinformatics 25(11):1451–1452. DOI: 10.1093/bioinformatics/btp187.
- Mantovani B, Tinti F, Bachmann L, Scali V. 1997. The Bag320 satellite DNA family in Bacillus stick insects (Phasmatodea): Different rates of molecular evolution of highly repetitive DNA in bisexual and parthenogenic taxa. Molecular Biology and Evolution 14(12):1197–1205. DOI: 10.1093/oxfordjournals.molbev.a025729.
- Medrano AS, Matos NB, Garcia C. 2011. Cytogenetic characterization of Amphisbaena vermicularis (Squamata, Amphisbanidae) from Jequié, Bahia state, Brazil. 2a Reunião brasileira de citogenética. 28 a 30 de Agosto 2011, Aguas de Lindoia.
- Meštrović N, Plohl M, Mravinac B, Ugarković D. 1998. Evolution of satellite DNAs from the genus palorus: Experimental evidence for the ‘library’ hypothesis. Molecular Biology and Evolution 15:1062–1068.
- Modi WS, Ivanov S, Gallagher DS. 2004. Concerted evolution and higher‐order repeat structure of the 1.709 (satellite IV) family in bovids. Journal of Molecular Evolution 58:460–465.
- Mravinac B, Plohl M, Mestrovic N, Ugarkovic D. 2002. Sequence of PRAT satellite DNA “frozen” in some coleopteran species. Journal of Molecular Evolution 54(6):774–783. DOI: 10.1007/s0023901-0079-9.
- Mravinac B, Plohl M, Ugarkovic D. 2005. Preservation and high sequence conservation of satellite DNAs indicate functional constraints. Journal of Molecular Evolution 61(4):542–550. DOI: 10.1007/s00239-004-0342-y.
- Müller J, Hipsley CA, Head JJ, Kardjilov N, Hilger A, Wuttke M, Reisz RR. 2011. Eocene lizard from Germany reveals amphisbaenian origins. Nature 473(7347):364–367. DOI: 10.1038/nature09919.
- Nijman IJ, Lenstra JA. 2001. Mutation and recombination in cattle satellite DNA: A feedback model for the evolution of satellite DNA repeats. Journal of Molecular Evolution 52(4):361–371. DOI: 10.1007/s002390010166.
- Olmo E, Odierna G, Capriglione T. 1987. Evolution of sex-chromosomes in lacertid lizards. Chromosoma 96(1):33–38. DOI: 10.1007/BF00285880.
- Plohl M, Luchetti A, Meštrović N, Mantovani B. 2008. Satellite DNAs between selfishness and functionality: Structure, genomics and evolution of tandem repeats in centromeric (hetero)chromatin. Gene 409(1–2):72–82. DOI: 10.1016/j.gene.2007.11.013.
- Reeder TW, Townsend TM, Mulcahy DG, Noonan BP, Wood PL, Sites Jr JW, Wiens JJ, Wilf P. 2015. Integrated analyses resolve conflicts over squamate reptile phylogeny and reveal unexpected placements for fossil taxa. PLOS ONE 10(3):e0118199. DOI: 10.1371/journal.pone.0118199.
- Rens W, Fu B, O’Brien PCM, Ferguson-Smith MA. 2006. Cross-species chromosome painting. Nature Protocols 1(2):783–790. DOI: 10.1038/nprot.2006.91.
- Rieppel O. 1984. The cranial morphology of the fossorial lizard genus Dibamus with a consideration of its phylogenetic relationships. Journal of Zoology 204(3):289–327. DOI: 10.1111/j.1469-7998.1984.tb02376.x.
- Robles F, de la Herrán R, Ludwig A, Rejón CR, Rejón MR, Garrido Ramos MA. 2004. Evolution of ancient satellite DNAs in sturgeon genomes. Gene 338(1):133–142. DOI: 10.1016/j.gene.2004.06.001.
- Rojo V, Martínez-Lage A, Giovannotti M, González-Tizón AM, Nisi Cerioni P, Caputo Barucchi V, Galán P, Olmo E, Naveira H. 2015. Evolutionary dynamics of two satellite DNA families in rock lizards of the genus Iberolacerta (Squamata, Lacertidae): Different histories but common traits. Chromosome Research 23(3):441–461. DOI: 10.1007/s10577-015-9489-1.
- Ronquist F, Teslenko M, van der Mark P, Ayres DL, Darling A, Höhna S, Huelsenbeck JP, Liu L, Suchard MA, Huelsenbeck JP. 2012. MrBayes3.2: EfficientBayesianphylogenetic inference and model choice across a large model space. Systematic Biology 61(3):539–542. DOI: 10.1093/sysbio/sys029.
- Ruiz-Ruano FJ, López-León MD, Cabrero J, Camacho J. 2016. High-throughput analysis of the satellitome illuminates satellite DNA evolution. Scientific Reports 6(1):28333. DOI: 10.1038/srep28333.
- Sambrook J, Fritsch EF, Maniatis T. 1989. Molecular cloning: A laboratory manual. Cold Spring Harbor, NY: Cold Spring Harbor Laboratory.
- Schneider S, Roessli D, Excoffier L. 2000. Arlequin, version 2.000: A software for population genetic data analysis. Geneva, Switzerland: Genetics and Biometry Laboratory, University of Geneva.
- Schwarzacher T, Heslop-Harrison P. 2000. Practical in situ hybridization. New York: Springer-Verlag.
- Schwenk K. 1988. Comparative morphology of the lepidosaur tongue and its relevance to squamate phylogeny. In: Estes R, Pregill G, editors. Phylogenetic relationships of the lizard families. Stanford, Massachisetts: Stanford University Press. pp. 506–598.
- Sievers F, Wilm A, Dineen D, Gibson TJ, Karplus K, Li W, Lopez R, McWilliam H, Remmert M, Söding J, Thompson JD, Higgins DG. 2011. Fast, scalable generation of high-quality protein multiple sequence alignments using clustal omega. Molecular Systematics and Biology 7(1):539. DOI: 10.1038/msb.2011.75.
- Simões TR, Caldwell MW, Tałanda M, Bernardi M, Palci A, Vernygora O, Bernardini F, Mancini L, Nydam RL. 2018. The origin of squamates revealed by a middle triassic lizard from the Italian Alps. Nature 557(7707):706–709. DOI: 10.1038/s41586-018-0093-3.
- Sumner AT. 1972. A simple technique for demonstrating centromeric heterochromatin. Experimental Cell Research 75(1):304–306. DOI: 10.1016/0014-4827(72)90558-7.
- Tałanda M. 2016. Cretaceous roots of the amphisbaenian lizards. Zoologica Scripta 45(1):1–8. DOI: 10.1111/zsc.12138.
- Tamura K, Peterson D, Peterson N, Stecher G, Nei M, Kumar S. 2011. MEGA5: Molecular evolutionary genetics analysis using maximum likelihood, evolutionary distance, and maximum parsimony methods. Molecular Biology and Evolution 28(10):2731–2739. DOI: 10.1093/molbev/msr121.
- Townsend TM, Larson A, Louis E, Macey R, Sites J. 2004. Molecular phylogenetics of Squamata: The position of snakes, amphisbaenians, and dibamids, and the root of the squamate tree. Systematic Biology 53(5):735–757. DOI: 10.1080/10635150490522340.
- Ugarković D, Plohl M. 2002. Variation in satellite DNA profiles—causes and effects. The EMBO Journal 21(22):5955–5959. DOI: 10.1093/emboj/cdf612.
- Vidal N, Hedges SB. 2005. The phylogeny of squamate reptiles (lizards, snakes, and amphisbaenians) inferred from nine nuclear protein-coding genes. CR Biologie 328(10–11):1000–1008. DOI: 10.1016/j.crvi.2005.10.001.
- Watabe H, Bachmann L, Haring E, Sperlich D. 1997. Taxonomic and molecular studies on Drosophila sinobscura and D. hubeiensis, two sibling species of the D. obscura group. Journal of Zoological Systematics & Evolutionary Research 35(2):81–94. DOI: 10.1111/j.1439-0469.1997.tb00407.x.
- Wilcox TP, Zwickl DJ, Heath TA, Hillis DM. 2002. Phylogenetic relationships of the dwarf boas and a comparison of Bayesian and bootstrap measures of phylogenetic support. Molecular Phylogenetics and Evolution 25(2):361–371. DOI: 10.1016/S1055-7903(02)00244-0.
- Zheng Y, Wiens JJ. 2016. Combining phylogenomic and supermatrix approaches, and a time-calibrated phylogeny for squamate reptiles (lizards and snakes) based on 52 genes and 4162 species. Molecular Phylogenetics and Evolution 94:537–547. DOI: 10.1016/j.ympev.2015.10.009.