
ABSTRACT
Objective: The highly sensitive chromatographic methods for quantifying phosphatidylethanol (PEth) require high levels of expertice and expensive instrumentation. Enzyme-linked immunosorbent assay (ELISA) kits have been developed for research purposes, but the implementation of PEth immunoassays to screen alcohol consumption has not been applied to the analysis of clinical samples. Our aim was to examine the ELISA method for PEth analysis in clinical samples.
Methods: We examined the alterations of the PEth serum levels of 22 male inpatients diagnosed with alcohol dependence according to the Diagnostic and Statistical Manual of Mental Disorders, Fourth Edition, during alcohol withdrawal (at days 1, 7, and 14) compared to 32 healthy controls using ELISA. All patients were admitted for detoxification treatment at the Alcohol and Substance Addiction Treatment and Rehabilitation Center, Trakya University School of Medicine, Edirne, Turkey. Control subjects were assessed with an initial clinical interview and screened with the Alcohol Use Disorder Identification Test (AUDIT), and they included 16 nondrinkers (AUDIT score = 0) and 16 social drinkers (AUDIT score < 8). We examined the diagnostic accuracy of PEth compared to the traditional biomarkers according to the receiver operating characteristic curve analysis.
Results: The patients undergoing detoxification had higher baseline PEth levels than the non-drinkers and social drinkers; the difference between groups showed a marginal trend towards significance (p = 0.052). PEth was correlated with the self-reported drinking amount in the past month and AUDIT scores, and the correlations showed marginal trends towards significance (rs = 0.269, p = 0.049; and rs = 0.266, p = 0.052; respectively). The PEth levels were statistically significantly correlated with gamma-glutamyl transferase (GGT) (rs = 0.355, p = 0.010), the correlations with alanine aminotransferase (ALT) and aspartate aminotransferase (AST) trended towards statistical significance (rs = 0.230, p = 0.095; and rs = 0.261, p = 0.056, respectively), and PEth was not statistically significantly correlated with mean corpuscular volume (MCV) (rs = 0.100, p = 0.478). PEth levels decreased statistically significantly during alcohol withdrawal (p = 0.002). PEth levels of the nondrinkers and social drinkers did not differ statistically significantly (p = 1.000). The area under the curve (AUC) for PEth measured by ELISA was statistically significantly higher than 0.5 (AUC = 0.691, p = 0.024), but PEth had poorer diagnostic efficacy than GGT (AUC = 0.933, p < 0.001), AST (AUC = 0.931, p < 0.001), MCV (AUC = 0.803, p < 0.001), and ALT (AUC = 0.789, p < 0.01).
Conclusions: The AUC of 0.69 shows that the diagnostic accuracy of the assay was poor, regardless of a statistical comparison to 0.5. The use of serum might have led to low concentrations that have not differed much between heavy drinkers and social drinkers or abstainers. Whole blood ELISA implementation for the quantification of PEth may increase its diagnostic efficacy.
Introduction
Alcohol abuse and dependence are globally prevalent disorders. Reliable biomarkers for characterizing drinking patterns and detecting alcohol use disorders are needed in treatment and research [Citation1]. Traditional biomarkers are indirect markers of alcohol-induced toxic effects and include gamma-glutamyl transferase (GGT), mean corpuscular volume (MCV), alanine aminotransferase (ALT), and aspartate aminotransferase (AST) [Citation1,Citation2]. Phosphatidylethanol (PEth) is a direct ethanol metabolite and an abnormal phospholipid that is formed only in the presence of ethanol via the action of phospholipase D [Citation3]. PEth is a promising new biomarker for alcohol use disorders. The sensitivity and specificity of PEth are higher than those of traditional biomarkers [Citation2]. It has been reported that PEth is highly specific for detecting alcohol use disorders; is correlated with the amount of ethanol intake in people who abuse alcohol; and has good clinical efficiency for detecting chronic heavy drinking, identifying binge drinking episodes, and differentiating between alcohol-dependent subjects and social drinkers and/or abstainers [Citation1,Citation3–10]. It is possible to detect PEth after 28 days of sobriety in chronic alcohol-dependent patients [Citation3].
Several analytical strategies have been utilized for quantifying the PEth concentration in blood, and these are mainly based on chromatographic or electrophoretic separation methods [Citation1]. These highly sensitive methods for quantifying PEth allow for the detection of even low to moderate drinking levels, but they require higher levels of expertice and expensive instrumentation [Citation11,Citation12]. To overcome this limitation in PEth analysis, PEth-specific monoclonal antibodies have been developed [Citation12,Citation13]. Because PEth is a group of molecules instead of a single molecule, its chemical structure could interfere with the implementation of PEth immunoassays in routine use [Citation2,Citation11]. Enzyme-linked immunosorbent assay (ELISA) kits have been developed for research purposes, but the implementation of PEth immunoassays to screen alcohol consumption has not been applied to the analysis of clinical samples, which is probably due to the non-specific nature of the derivatized products extracted and diluted, and studies evaluating the selectivity and accuracy of these assays are needed [Citation1,Citation2,Citation11,Citation12].
The following are the aims of the current study: (1) to investigate the alterations in the PEth serum levels in alcohol-dependent patients during alcohol withdrawal compared to the healthy controls using ELISA; (2) to report the correlations of PEth with traditional biomarkers, self-reported alcohol consumption, and clinical features related to drinking behavior; and (3) to assess the diagnostic accuracy of PEth compared to the traditional biomarkers.
Materials and methods
Participants
The present study was part of a research project (Evaluation of the levels of biochemical markers and neurotrophic factors in patients with alcohol use disorder) that was approved by the local Ethics Committee of the Trakya University School of Medicine (Project No: 2012–116). All procedures were in accordance with the ethical standards of the local Ethics Committee on human experimentation (institutional and national) and with the Helsinki Declaration of 1975, revised in 2000. Informed consents were obtained from all participants for inclusion in the study. A total of 54 subjects, including 22 alcohol-dependent patients and 32 healthy controls (16 nondrinkers and 16 social drinkers), were enrolled. The age and body mass index (BMI) were similar for the three study groups. We examined the PEth serum levels of 22 male inpatients who were diagnosed with alcohol dependence according to the Diagnostic and Statistical Manual of Mental Disorders, Fourth Edition (DSM-IV-TR), and were admitted for detoxification treatment from June 2013 to September 2014 (the Alcohol and Substance Addiction Treatment and Rehabilitation Center, Trakya University School of Medicine, Edirne, Turkey). Exclusion criteria were axis I psychiatric diagnoses, apart from alcohol and nicotine use disorders, according to the DSM-IV-TR; delirium tremens; severe neurological diseases, such as epilepsy and cerebrovascular diseases; significant physical illnesses, such as cardiovascular, hepatic, and renal diseases; and using any psychotropic medications.
We assessed the patients with an initial clinical interview to ascertain their DSM-IV-TR diagnoses. All patients underwent a detailed physical examination, routine laboratory testing, and urine drug screening. None of the patients reported a non-drinking period; they had been drinking until the day before hospitalization. Alcohol consumption was stopped immediately and completely at admission. The patients were treated with various doses of diazepam, which were adjusted by the severity of their withdrawal symptoms and tapered gradually during alcohol withdrawal. The cumulative benzodiazepine dosage used during detoxification was recorded and documented as milligrams of diazepam. Oral vitamin B complex (including B1, B6, and B12) supplementation was also administered to all patients. No other psychopharmacological agents have been used during alcohol withdrawal. Measurements of the breath alcohol concentration were performed on admission and during alcohol withdrawal using an alcohol breath analyser.
We investigated the PEth serum levels of 32 healthy male volunteers without known psychiatric and physical illnesses and with normal results for routine laboratory tests. Controls were assessed with an initial clinical interview and screened with the Alcohol Use Disorder Identification Test (AUDIT) [Citation14,Citation15]. They were negative for alcohol use disorders and any other axis I diagnosis based on DSM-IV-TR. An AUDIT score ≥8 is considered to indicate hazardous or harmful alcohol use, and a score <8 in the AUDIT was required for inclusion in the study. Healthy subjects included 16 nondrinkers (AUDIT score = 0) and 16 social drinkers (AUDIT score < 8). They were not receiving any pharmacological treatment.
Additional data (such as the socio-demographic data, BMI, history of alcohol drinking and smoking behavior, and estimation of alcohol consumption in the last month) were obtained using a structured interview. The intensity of alcohol craving was measured using the Penn Alcohol Craving Scale (PACS) [Citation16,Citation17]. The severity of alcohol withdrawal was measured using the Clinical Institute Withdrawal Assessment for Alcohol (CIWA-Ar) [Citation18]. These measurements were performed once a day on days 1, 7, and 14.
Biochemical assessments
Fasting blood samples were collected from the patients on the morning after hospitalization (day 1) and on days 7 and 14 of alcohol withdrawal and were compared to the serum levels of the healthy controls. All blood samples were centrifuged and stored at −80°C immediately after collection until they were studied. The PEth levels were assessed using ELISA kits (Shanghai Sunred Biological Technology. Product information: (1) Assay type: sandwich ELISA. (2) Samples: human serum, plasma, and other related tissue liquid. (3) Sensitivity: 0.475 µg/ml. (4) Specificity: no significant cross-reactivity or interference between human PEth and analogs was observed, limited by current skills and knowledge, cross-reaction may still exist; sample linear regression with the expected concentration of the correlation coefficient R is over 0.95; intra-assay precision CV < 10%, inter-assay precision CV < 12%). All of the assays were performed according to the manufacturer’s instructions (Summary procedures: (1) Prepare reagents, samples, and standards. (2) Add prepared samples and standards, antibodies labeled with enzyme, and allow to react for 60 minutes at 37°C. (3) Plate washed five times, add chromogen solution A, B, allow to react for 10 minutes at 37°C. (4) Add stop solution. (5) Measure the optical density value within 10 minutes. (6) Calculate). The PEth values were defined as µg/ml. Determination of further blood parameters (including AST, ALT, GGT, and complete blood count) was performed using routine clinical laboratory methods.
Statistical analysis
Descriptive statistics for continuous variables were shown as the mean ± standard deviation (SD) and median (25‒75% values); categorical variables were expressed as the number of cases (n) and (%). According to the normality of distribution, differences between groups (patients, nondrinkers, and social drinkers) were investigated using one-way analysis of variance (ANOVA) or Kruskal–Wallis tests and Bonferroni-corrected Mann–Whitney U tests for multiple comparisons. Alterations in the PEth levels during alcohol withdrawal were assessed with Friedman and Bonferroni-corrected Wilcoxon tests for multiple comparisons. Categorical variables were evaluated using the Pearson Chi squared test. Correlations between the PEth levels and other variables were analysed using the Spearman rank correlation coefficient. Receiver operating characteristic (ROC) curve analysis was performed to analyse the area under the curve (AUC) for the diagnostic accuracy of PEth, MCV, GGT, AST, and ALT. Data from the healthy controls were compared to the data from alcohol-dependent patients. Analyzes were performed using the statistical package for the social sciences (SPSS) version 20 for Windows. Statistical significance was defined as a two-sided p value of <0.05. A Bonferroni-adjusted p value threshold of 0.017 was used.
Results
A total of 54 subjects, including 22 alcohol-dependent patients and 32 healthy controls (16 nondrinkers and 16 social drinkers), were enrolled. The age and BMI were similar for the three groups. There were statistically significant differences between the groups with respect to self-reported alcohol consumption (g ethanol/last month), AUDIT score, and smoking amount (cigarettes/day and pack-years). The characteristics of the study subjects are shown in .
Table 1. Characteristics of the study subjects.
PEth serum levels of alcohol-dependent patients and healthy controls
The PEth, GGT, MCV, AST, and ALT levels of the study subjects and clinical features of alcohol withdrawal are shown in . The difference between the groups (patients [day 1], nondrinkers, and social drinkers) with respect to the PEth levels showed marginal trends towards significance (χ2 = 5.921, p = 0.052). The patients showed marginal trends towards significantly higher baseline PEth levels compared to the social drinkers and nondrinkers (z = −2.218, p = 0.027, r = −0.36; and z = −1.863, p = 0.062, r = −0.30, respectively). The nondrinkers and social drinkers had similar PEth levels (z = 0.000, p = 1.000). The PEth levels of the patients decreased statistically significantly during alcohol withdrawal (χ2 = 12.091, p = 0.002). In pairwise comparisons, the PEth levels on day 1 were statistically significantly higher than those on days 7 (z = −3.539, p < 0.001, r = −0.76) and 14 (z = −2.581, p = 0.010, r = −0.55). There was no statistically significant difference between days 7 and 14 (z = −0.958, p = 0.338, r = −0.20). The PEth levels of the patients on days 7 and 14 did not differ statistically significantly from those of the nondrinkers and social drinkers (χ2 = 0.038, p = 0.981; and χ2 = 0.045, p = 0.978, respectively). The PEth levels of the alcohol-dependent patients during alcohol withdrawal compared with that of the healthy controls are shown in .
Figure 1. PEth serum levels of the alcohol-dependent patients during alcohol withdrawal compared to the healthy controls (nondrinkers and social drinkers). The difference between the groups (patients [day 1], nondrinkers, and social drinkers) with respect to the PEth levels showed marginal trends towards significance (p = 0.052). PEth levels of the patients decreased statistically significantly during alcohol withdrawal (p = 0.002).
![Figure 1. PEth serum levels of the alcohol-dependent patients during alcohol withdrawal compared to the healthy controls (nondrinkers and social drinkers). The difference between the groups (patients [day 1], nondrinkers, and social drinkers) with respect to the PEth levels showed marginal trends towards significance (p = 0.052). PEth levels of the patients decreased statistically significantly during alcohol withdrawal (p = 0.002).](/cms/asset/2ae9c171-3312-4f5e-9d9a-c0bf643ddc60/tbcp_a_1293249_f0001_c.jpg)
Table 2. Biomarker levels of the study subjects and clinical features of alcohol withdrawal.
Correlations of the PEth serum levels with other variables
The PEth levels were not statistically significantly correlated with age (Spearman’s rs = 0.057, p = 0.684), BMI (rs = 0.142, p = 0.332), or smoking amount (cigarettes/day rs = 0.107, p = 0.444; pack-years rs = 0.078, p = 0.581). They were correlated with the self-reported drinking amount in the past month and AUDIT scores, and the correlations showed marginal trends towards significance (rs = 0.269, p = 0.049; and rs = 0.266, p = 0.052, respectively).
The PEth levels were statistically significantly correlated with GGT (rs = 0.355, p = 0.010). They were not statistically significantly correlated with MCV (rs = 0.100, p = 0.478), and the correlations with ALT and AST trended towards statistical significance (rs = 0.230, p = 0.095; and rs = 0.261, p = 0.056, respectively). The PEth levels were not statistically significantly correlated with the CIWA-Ar scores (rs = 0.188, p = 0.401), PACS scores (rs = 0.279, p = 0.209), or cumulative benzodiazepine dosage used during alcohol withdrawal (rs = −0.165, p = 0.463). The PEth levels were not statistically significantly correlated with GGT, MCV, ALT, AST, CIWA-Ar, or PACS scores during alcohol withdrawal (days 7 and 14, data not shown).
ROC curve analysis with PEth and other biomarkers
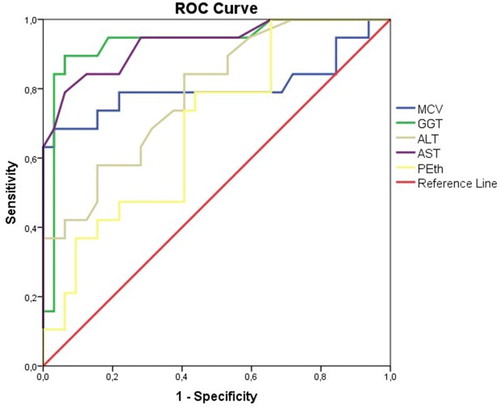
ROC curve analysis for the alcohol-dependent patients versus healthy controls, with PEth, GGT, MCV, ALT, and AST as test variables, was performed (). The resulting AUC for PEth was 0.691, and it was significantly higher than 0.5 (p = 0.024, confidence interval [CI] 0.544‒0.837). The AUC for PEth was lower than that for GGT (AUC = 0.933, p < 0.001, CI 0.853‒1.000), AST (AUC = 0.931, p < 0.001, CI 0.856‒1.000), MCV (AUC = 0.803, p < 0.001, CI 0.649‒0.958), and ALT (AUC = 0.789, p = 0.001, CI 0.665‒0.914).
Figure 2. ROC curve analysis for the alcohol-dependent patients versus healthy controls, with PEth, GGT, MCV, ALT, and AST as test variables. PEth was found to have statistically significant diagnostic efficacy for detecting chronic heavy drinking according to the ROC curve analysis (p = 0.024), but traditional biomarkers performed better than PEth.
Discussion
To the best of our knowledge, this is the first study to apply the ELISA method for PEth analysis in clinical samples. Our main findings are as follows: (1) the alcohol-dependent patients undergoing detoxification showed marginal trends towards significantly higher baseline PEth levels compared to the social drinkers and nondrinkers; (2) the PEth levels of the patients decreased statistically significantly during alcohol withdrawal and the PEth levels on days 7 and 14 of detoxification did not differ statistically significantly from those of the nondrinkers and social drinkers; (3) there were correlations with the self-reported drinking amount in the past month and AUDIT scores; and (4) the AUC for PEth measured by ELISA was significantly higher than 0.5, but traditional biomarkers had higher diagnostic efficacy according to the ROC curve analysis.
It has been reported that PEth is highly specific for detecting alcohol use disorders; is correlated with the level of ethanol intake in people who abuse alcohol; and has good clinical efficiency for detecting chronic heavy drinking, identifying binge drinking episodes, and differentiating between alcohol-dependent subjects and social drinkers and/or abstainers. Furthermore, the sensitivity and specificity of PEth are higher than that for traditional indirect biomarkers [Citation1–10,Citation19]. Analytical strategies based on chromatographic or electrophoretic separation methods were used in these studies. We applied the ELISA method to measure PEth in the analysis of clinical samples in this study. PEth was found to have statistically significant diagnostic efficacy for detecting chronic heavy drinking according to the ROC curve analysis, but traditional biomarkers performed better than PEth in our study. PEth, when measured by ELISA, was not able to detect moderate intake or distinguish moderate alcohol consumption from abstinence. PEth, when measured by ELISA, was correlated with increasing levels of alcohol consumption and AUDIT scores, but the correlations were weaker than those in previous studies that used chromatographic or electrophoretic separation methods [Citation3–5,Citation7,Citation9].
We could not study the normalization rate in our sample because there are no established cutoff values for the PEth concentrations measured by ELISA. Previous studies using chromatographic separation methods have indicated that PEth is detectable in blood for more than 2 weeks after sustained ethanol intake, and it is possible to detect PEth after 28 days of sobriety in chronic alcohol-dependent patients [Citation3,Citation5]. In our study, the patients trended towards statistically significantly higher baseline PEth levels compared to the social drinkers and nondrinkers. The PEth levels of the patients decreased statistically significantly during alcohol withdrawal, and the PEth levels after seven days of sobriety did not differ statistically significantly from those of healthy controls.
Several methods for determining PEth are in use or in development [Citation19]. The tests based on chromatographic or electrophoretic separation methods for quantifying PEth are highly sensitive and allow for the detection of even low to moderate drinking levels, but they require high levels of expertice and expensive instrumentation [Citation11,Citation12]. PEth-specific monoclonal antibodies have been developed, and the implementation of PEth immunoassays could foster more widespread use of this test [Citation1,Citation12,Citation19]. It has been suggested that because PEth is a group of molecules instead of a single molecule, its chemical structure and the non-specific nature of the derivatized products could hinder the implementation of PEth immunoassays in clinical use, and studies evaluating selectivity and accuracy are needed [Citation1,Citation2,Citation11,Citation12].
The positive correlation of PEth measured by ELISA with the reported alcohol consumption and AUDIT scores suggests that the implementation of PEth immunoassays may be beneficial in clinical use, and further studies are needed. The AUC of 0.69 shows that the diagnostic accuracy of the assay was poor, regardless of a statistical comparison to 0.5, and the ROC curve analysis of PEth was poorer than that of the traditional biomarkers. This might be due to using serum samples. Although the PEth ELISA kit is used to assay PEth in the sample of serum, plasma, and other related tissue liquid, PEth is an abnormal cellular membrane phospholipid and whole blood has been used in all previous PEth studies based on chromatographic methods, which are the gold standard analytical tools [Citation1,Citation2]. There would have to be some type of extraction of phospholipids from whole blood for the assay, and the use of serum might lead to low concentrations of PEth that do not differ much between heavy drinkers and social drinkers or abstainers. Whole blood ELISA implementation for the quantification of PEth may increase its diagnostic efficacy. This slight difference between cases and controls was further aggravated by PEth detection in abstainers, even though small amounts of PEth could be detected in serum. Ideally there should be no PEth detectable in nondrinkers; cross-reactivity or interference with other factors might exist and influence the results. The small number of participants used to generate the results of the study and the lack of validation against gold standard analytical tools are important limitations of this study. Further studies that apply the ELISA method to measure the PEth levels in a larger clinical sample and compare PEth results by the ELISA with those of chromatographic methods are needed to evaluate the selectivity and accuracy of PEth, replicate our study results, and establish cutoff values for PEth concentrations.
Acknowledgements
The authors thank Prof. Hakan Erbas, the Department of Medical Biochemistry (Trakya University, School of Medicine, Edirne, Turkey), for laboratory assistance.
Disclosure statement
No potential conflict of interest was reported by the authors.
Additional information
Funding
References
- Viel G, Boscolo-Berto R, Cecchetto G, et al. Phosphatidylethanol in blood as a marker of chronic alcohol use: a systematic review and meta-analysis. Int J Mol Sci. 2012;13(11):14788–14812. doi: 10.3390/ijms131114788
- Cabarcos P, Alvarez I, Tabernero MJ, et al. Determination of direct alcohol markers: a review. Anal Bioanal Chem. 2015;407(17):4907–4925. doi: 10.1007/s00216-015-8701-7
- Wurst FM, Thon N, Aradottir S, et al. Phosphatidylethanol: normalization during detoxification, gender aspects and correlation with other biomarkers and self-reports. Addict Biol. 2010;15(1):88–95. doi: 10.1111/j.1369-1600.2009.00185.x
- Aradottir S, Asanovska G, Gjerss S, et al. PHosphatidylethanol (PEth) concentrations in blood are correlated to reported alcohol intake in alcohol-dependent patients. Alcohol Alcohol. 2006;41(4):431–437. doi: 10.1093/alcalc/agl027
- Hartmann S, Aradottir S, Graf M, et al. Phosphatidylethanol as a sensitive and specific biomarker: comparison with gamma-glutamyl transpeptidase, mean corpuscular volume and carbohydrate-deficient transferrin. Addict Biol. 2007;12(1):81–84. doi: 10.1111/j.1369-1600.2006.00040.x
- Helander A, Peter O, Zheng Y. Monitoring of the alcohol biomarkers PEth, CDT and EtG/EtS in an outpatient treatment setting. Alcohol Alcohol. 2012;47(5):552–557. doi: 10.1093/alcalc/ags065
- Jain J, Evans JL, Briceno A, et al. Comparison of phosphatidylethanol results to self-reported alcohol consumption among young injection drug users. Alcohol Alcohol. 2014;49(5):520–524. doi: 10.1093/alcalc/agu037
- Kechagias S, Dernroth DN, Blomgren A, et al. Phosphatidylethanol compared with other blood tests as a biomarker of moderate alcohol consumption in healthy volunteers: a prospective randomized study. Alcohol Alcohol. 2015;50(4):399–406. doi: 10.1093/alcalc/agv038
- Piano MR, Tiwari S, Nevoral L, et al. Phosphatidylethanol levels are elevated and correlate strongly with AUDIT scores in young adult binge drinkers. Alcohol Alcohol. 2015;50(5):519–525. doi: 10.1093/alcalc/agv049
- Stewart SH, Koch DG, Willner IR, et al. Validation of blood phosphatidylethanol as an alcohol consumption biomarker in patients with chronic liver disease. Alcohol Clin Exp Res. 2014;38(6):1706–1711. doi: 10.1111/acer.12442
- Maenhout TM, De Buyzere ML, Delanghe JR. Non-oxidative ethanol metabolites as a measure of alcohol intake. Clin Chim Acta. 2013;415:322–329. doi: 10.1016/j.cca.2012.11.014
- Nissinen AE, Makela SM, Vuoristo JT, et al. Immunological detection of in vitro formed phosphatidylethanol—an alcohol biomarker—with monoclonal antibodies. Alcohol Clin Exp Res. 2008;32(6):921–928. doi: 10.1111/j.1530-0277.2008.00656.x
- Nissinen AE, Laitinen LM, Kakko S, et al. Low plasma antibodies specific for phosphatidylethanol in alcohol abusers and patients with alcoholic pancreatitis. Addict Biol. 2012;17(6):1057–1067. doi: 10.1111/j.1369-1600.2010.00279.x
- Saatcioglu O, Evren C, Cakmak D. [Reliability and validity of the alcohol use disorders identification test]. Türkiye’de Psikiyatri. 2002;4(2–3):107–113. Turkish.
- Saunders JB, Aasland OG, Babor TF, et al. Development of the alcohol use disorders identification test (AUDIT): WHO collaborative project on early detection persons with harmful alcohol consumption-II. Addiction. 1993;88(6):791–804. doi: 10.1111/j.1360-0443.1993.tb02093.x
- Evren C, Flannery B, Celik R, et al. [Reliability and validity of Turkish version the Penn alcohol craving scale (PACS) in male alcohol dependent inpatients]. J Depend. 2008;9(3):128–134. Turkish.
- Flannery BA, Volpicelli JR, Pettinati HM. Psychometric properties of the Penn alcohol craving scale. Alcohol Clin Exp Res. 1999;23(8):1289–1295. doi: 10.1111/j.1530-0277.1999.tb04349.x
- Sullivan JT, Sykora K, Schneiderman J, et al. Assessment of alcohol withdrawal: the revised clinical institute withdrawal assessment for alcohol scale (CIWA-Ar). Br J Addict. 1989;84(11):1353–1357. doi: 10.1111/j.1360-0443.1989.tb00737.x
- Wurst FM, Thon N, Weinmann W, et al. Characterization of sialic acid index of plasma apolipoprotein J and phosphatidylethanol during alcohol detoxification – a pilot study. Alcohol Clin Exp Res. 2012;36(2):251–257. doi: 10.1111/j.1530-0277.2011.01618.x