
ABSTRACT
OBJECTIVES: The determinants of subjective well-being have been largely investigated in recent years. According to Pavot and Diener who have developed TSWL (Temporal Satisfaction with Life Scale), to assess the life satisfaction level of an individual according to temporal factors, subjective well-being is composed of two constructs: an emotional or affective component (i.e. positive and negative affects) and a conceptual or cognitive component (i.e. satisfaction with life, marriage, work, and leisure). The aim of this study was to adapt the Temporal Satisfaction with Life Scale into Turkish (TSWLS-T) and examine the reliability and validity of this new Turkish version.
METHODS: The study was conducted in four phases with randomly chosen 236 participants (113 females, 123 males) and the mean age of sample was 38.6 ± 12.5 years. Cultural adaptation was implemented according to the internationally suggested method and a pre-test was administered to examine the language equivalence. Since the scale had high levels of language equivalence, validity and reliability studies were conducted. For construct validity, confirmatory factor analysis was employed. The Satisfaction with Life Scale (SWLS) was used in order to evaluate the validity of TSWLS-T, since internal consistency (Cronbach’s alpha and intra-class coefficients) and test–retest analysis were employed to estimate instrument reliability.
RESULTS: The TSWLS-T demonstrated acceptable internal consistency, with a Cronbach’s alpha of 0.87 for the total scale and ranging between 0.76 and 0.88 for the subscales. The test–retest reliability was also satisfactory, with intra-class correlation coefficients of 0.81 for the total scale and ranging between 0.61 and 0.74 for the subscales (p < 0.01). Fit indices of the model supported the factor structure. However, the 1st, 5th, and 11th items in scale (past, present, and future) showed a series of problems. With these items excluded, the 12-item model provided a better fit to the data than the 15-item model while the factor structure remained almost unchanged. The author recommends that the 12-item TSWLS be used to measure temporal life satisfaction.
CONCLUSIONS: The TSWLS-T is a valid and reliable measure to assess life satisfaction in Turkish.
Introduction
Life satisfaction is defined as a cognitive judgement of the life of a person and reflects a global evaluation related to his or her life by person [Citation1]. World Health Organization (WHO) has defined life satisfaction as “a person’s achieving his/her goals, expectations, standards, and interests in a positive way in his/her system of culture and values”. Another description of life satisfaction is “being satisfied and happy with our life and environment” [Citation2]. Life satisfaction focuses on emotional well-being in psychopathologies [Citation3] and it is important for the achievement of cooperation for the treatment of psychiatric patients. Life satisfaction or subjective well-being can be evaluated either with subjective experience or objective evaluation [Citation4,Citation5], but objective scales were found to be poor indicators of life satisfaction [Citation5]. Literature on this issue especially emphasize on the association of life satisfaction with social relationships and mental disorders [Citation6–9]. Therefore, understanding the life satisfaction, which also means understanding people’s health, income, and occupational performance in life, is important for assessing the quality of life [Citation10].
Over the past decade, a few tools have been developed to assess life satisfaction [Citation11,Citation12] such as the Satisfaction with Life Scale (SWLS), which has been used for measuring the widespread life satisfaction and has shown good psychometric properties in all known culturally adapted versions [Citation13–22]. Moreover, SWLS is one of the most frequently used instrument among all multiple-item-comprised life satisfaction instruments[Citation23]; however, it provides only a one-dimensional measurement structure [Citation14,Citation16,Citation22]. The temporal focus of the SWLS makes a distinction among life satisfaction at different times while helping to reduce measurement errors that may occur with the respondent’s focusing on his or her chosen time period [Citation24]. From this perspective, as people realize their goals of life, life satisfaction is expected to increase [Citation23]. Moreover, life satisfaction states perceived or anticipated changes about individual’s history or future goals, which also means people's present lives affects their perspective about their past and future [Citation1]. Therefore, subjective temporal assessments of the past and future life periods provide unique data on psychological relevance [Citation25].
Given the central role of life satisfaction in both individual and social well-being, the valid measurement of life satisfaction has become a major concern and the central challenge for quality of life research. Therefore the cultural adaptation of the TSWLS (Temporal Satisfaction with Life Scale) is certainly worthwhile in order to allow temporal factors to be assessed in the individual’s past, present, and future life satisfaction. The purpose of this study was to adapt the TSWLS into Turkish (TSWLS-T) and evaluate the validity and reliability of the new Turkish version of TSWLS.
Methods
Participants
The sample population for this study included 236 volunteer people (113 females and 123 males, age range 18–67 years) from Kastamonu and Ankara cities in Turkey. Sample size was determined according to Monte Carlo methodology of MacCallum and Widaman for estimating sample size in factor analysis studies [Citation26]. This study has been applied to people chosen by the sample randomization method, in which participants from each randomly selected household have been balanced according to the Turkish Statistical Institute database on the proportion of population by gender and age, between the dates of 3rd January and 3rd July 2011 () [Citation27]. The Turkish Statistical Institute (TSI) database was used to balance the proportion of population by age and gender in this study (). Therefore, for this research, quota sampling method was used for stratification. After stratification of age and gender, researchers selected the households randomly. If there are two appropriate samples at the household, the approval of participation was asked first and then the choice was made in between the two appropriate people by taking the coin as if it was a simple randomization technique. The population’s demographic data are shown in .
Figure 1. Randomization method of the database.
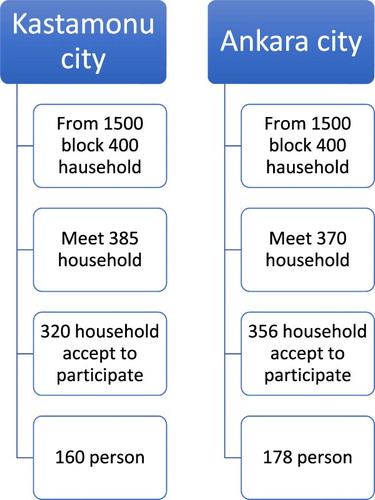
Table 1. Sample size according to the distribution of age and gender.
Table 2. Demographic data.
After explaining the purpose and procedure of the research, a written informed consent was obtained from all the participants prior to the initiation of the study. This study was approved by the Ethical Committee for Clinical Research of Hacettepe University Senate and performed in accordance with the ethical standards laid down in the revised Declaration of Helsinki (in 2013).
Measures
Information on the demographic characteristic of the participants – including age, gender, marital status (single or married), educational status (primary school, high school, or university degree), and occupational status (employed or unemployed) – were recorded. After recording the demographic factors individually with face-to-face interviews, the TSWLS and SWLS were immediately completed by all participants on their own in the same visit period.
Temporal Satisfaction with Life Scale (TSWLS): The 15-item TSWLS consists of three subscales that assess past, present, and future life satisfaction; high score indicates higher life satisfaction level because of positive written manner of all included items. Items are scored from 1 point to 7 points, ranging from “strongly disagree” to “strongly agree.” Further information on the reliability and validity of TSWLS (α’s ranged from 0.91 to 0.93 and test–retest correlation was 0.83) for U.S. participants is provided by Pavot et al. [Citation19]. The scale was further validated by McIntosh [Citation20] in a sample of Canadian university students and by Shengquan Ye [Citation21] in a sample of Chinese university students. TSWLS had good internal and temporal consistency and convergent validity in the studies. These studies stated a confirmatory factor model for this measure that emphasizes the obvious but relevant factors of life satisfaction in different time periods [Citation20,Citation21].
Satisfaction with Life Scale (SWLS): Likewise TSWLS, the SWLS use a 7-point scale and a high score means a high life satisfaction. The total score ranged from 5 to 35, a neutral score (which is 20 points) means that the respondent was equally satisfied and dissatisfied. The scores between 21 and 25 represent “slightly satisfied,” and scores between 15 and 19 represent “slightly dissatisfied” with life. Scores between 26 and 30 represent “satisfied,” and scores from 5 to 9 are indicative of being “extremely dissatisfied” with life [Citation20]. The internal consistency of the original version of SWLS was 0.87 and the test–retest reliability coefficient was 0.82 [Citation13]. The internal consistency of the Turkish adaptation of the scale was 0.81 and test–retest reliability coefficient was 0.83 [Citation22]. The SWLS’s Cronbach’s alpha was evaluated for our study and it was 0.82.
Cultural adaptation of the TSWLS
Permission was obtained from the original author of TSWLS before the initiation of the translation process. The cultural adaptation of the TSWLS was conducted according to the standardized procedures outlined by Beaton et al [Citation28].
Forward translation: The survey items and instructions were translated into Turkish by three independent translators, two with a medical background and one without a medical background. A meaningful and adequately optimal translation was made by comparing the translations. A detailed report about the problems encountered related to the translation has been written.
Back translation: The translated Turkish version of the survey was translated back into English by two native English speakers without a medical background in order to control for linguistic errors. Only minor differences were found between the original and back translated versions.
Expert Committee: An expert committee consisting of three people with a medical background on community-based researches examined all translations, reports, and the original version of the survey and developed the penultimate version of the pre-test questionnaire by majority vote.
Cultural adaptation: The original basis of the survey was preserved during the forward and backward translations, but in order to preserve the meaning, the content of the scales 1 and 7; 3 and 5 were modified. In scales 1 and 7, the word “strongly” was changed into “definitely” in order to improve understanding. In scales 3 and 5, the word “slightly” was changed into “generally” in order to improve understanding. In article 1, the phase “if I had my past to live over” was amended to read “if I would take the past back” in order to convey the same meaning.
Pre-test: To determine whether the survey was intelligible and appropriate for the Turkish culture, it was tested on 26 participants with a pilot study. The inclusion criteria were the same as that of the participants for the full study. The average age of the participants was 35.8 ± 11.1 years. After completing the questionnaire, the participants were interviewed individually about the lucidity of the items in the survey, the accuracy of the reflection of general life satisfaction in the survey, and the usefulness and the length of the survey. Among the participants in this pilot study, 6% of the respondents said that they did not understand some of the questions. 70% of the respondents said that they refused to answer the questions about future; hence, no one knows what future holds. The questions that the participants did not understand were examined again. The content of the items 11, 12, 14, and 15 was changed like 13 for religious reasons. According to their religious beliefs, the participants did not want to speak confidently about the future. For this reason, the “will” statement was changed into “may.” The time frame for the completion of the survey and the interview was about 15 minutes per person. After the completion of the pre-test and the interviews, the answers given by participants were examined, and the necessary minor changes were made to create the final version of the survey.
In this study, the final version of the TSWLS was applied twice to 236 people, with an interval of 15 days.
Statistical analysis
All of the statistical analyses were performed using SPSS 22.00 and LISREL software. A significance level of 0.05 was set for all analyses. In this study, the mean and standard deviation (SD) values were also presented. Cronbach’s alpha coefficients and corrected item-total correlations were computed to assess the reliability of the TSWLS. To assess the construct validity of the TSWLS, exploratory factor analyses were performed using LISREL and ML estimation procedures. The indexes of the model fit considered were: the ratio of chi square to degree of freedom (χ2/df), the goodness of fit index (GFI) and the comparative fit index (CFI), the root mean square error of approximation (RMSEA), and the standardized root mean square residual (SRMR) [Citation29].
Results
Explanatory analysis. presents the result of the items with mean value, standardized deviation, skewness, kurtosis, corrected item-total correlations, and correlations. Similar with the literature [Citation20–21], mean scores of the first and fifth items in each subscale were relatively lower and strongly negatively skewed. According to the corrected item-total correlations (calculated within each subscales), the first and fifth items in first and third subscales were less consistent with the other items. As the correlation with SWLS suggested, the fifth items in first and third subscales were less consistent than the other items and the second subscale’s items were more consistent with the SWLS ().
Table 3. Descriptive statistics for TSWLS items.
Differences in TSWLS based on gender, marital status, education, and employment. The independent sample t-test presented that there was a statistically significant difference between the TSWLS total sores of participants when grouping based on marital (p < 0.001) and educational (p = 0.03); however, there was no significant difference in the total score of life satisfaction when grouping based on gender (p = 0.59) and vocational status (p = 0.16) (). According to the results about TSWL total scores based on demographic subgroups, the life satisfaction of married participants was lower compared to the singles, similar to lower life satisfaction scores of university graduate participants compared to high school graduates. Additionally, the past, present, and future subscores of participants were also lower both in the groups of married and university graduate participants than their contrasts, and these results of the subscales about demographics were found as statistically significant. However, only the past life satisfaction subscore of employed participants was lower compared to unemployed, since grouping the sample according to the employment status. When the sample was grouped by gender, distinctly from the literature on issue [Citation19–21] that any statistically significant difference was not obtained in all of the past (p = 0.92), present (p = 0.57), and future (p = 0.53) subscores between males and females ().
Table 4. Distribution of TWLS and SWLS scores according to demographic properties.
The internal consistency of the scale and subscale. When the overall internal consistency of the final version of the scale was assessed, the Cronbach’s alpha coefficient was 0.87. The Cronbach’s alpha coefficients for the internal consistency of the subscales were 0.82, 0.88, and 0.76, respectively. The results indicate that the applicability and psychometric characteristics of the Turkish version of the survey can be rated as good ().
Table 5. Cronbach’s alpha and test–retest correlation coefficient for Turkish version of TSWLS’s each scale.
Reliability. After the pre-test, the test was administered twice to all 236 participants at an interval of 15 days to assess the test–retest reliability. More specifically, the data from these two administrations were compared to test the reliability of the questionnaire and the test–retest reliability was obtained as 0.81 (p < 0.001). Additionally, the correlation coefficient of present subscale (r = 0.743, p < 0.001) was found higher than the other subscales’ when test–retest reliability was examined separately on all of the three time subscales ().
Confirmatory factor analysis. It is known that Kaiser–Mayer–Olkin (KMO) test is a measure of whether the data are suitable for factor analysis or not. Moreover, the KMO values between 0.80 and 1 indicate the sampling is adequate [Citation30]. KMO value of our study was 0.83. A 15-item model was tested and there are 3 factors in SWLS scale. The goodness of model fit indices revealed that the initial model presented a poor fit to the data: χ² (87, n = 236) = 304.32, RMSEA = 0.103, CFI = 0.87, NFI = 0.83, TLI = 0.84, GFI = 0.86, and AGFI = 0.81. Various significant error covariance among the similar items of three subscales was determined on the modification indices and the model was modified and refitted according to the findings: χ² (74, n = 236) = 163.64, RMSEA = 0.072, CFI = 0.94, NFI = 0.91, TLI = 0.92, GFI = 0.92, and AGFI = 0.87 () [Citation29]. The final standardized model is presented in .
Figure 2. Final standardized model for the 15-item TSWLS.
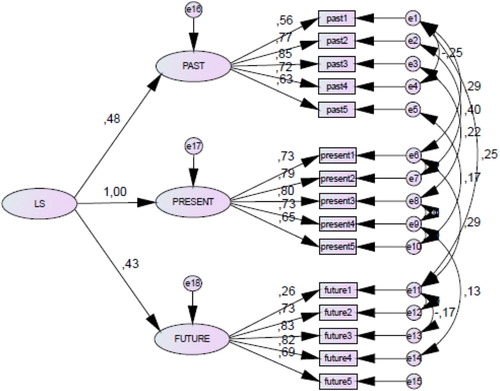
Table 6. Result from confirmatory factor analysis.
Significant chi squares were observed for three other error covariance, between present³ and present⁴; future¹ and future²; future¹ and future³, suggesting that there could be some response sets among the data. Four regression paths were found statistically significant in the response set tests of McIntosh, in which response bias was not considered in the model because of the absence of any powerful or consistent effect. However, two regression paths were found statistically significant in the response set tests of Shengquan Ye and the influence of response bias was powerful and consistent [Citation21].
In present study, it was also noted that the error covariance between the first items in each subscale was all significant. In addition, the loadings of these items on their factors were much lower than those of the other items.
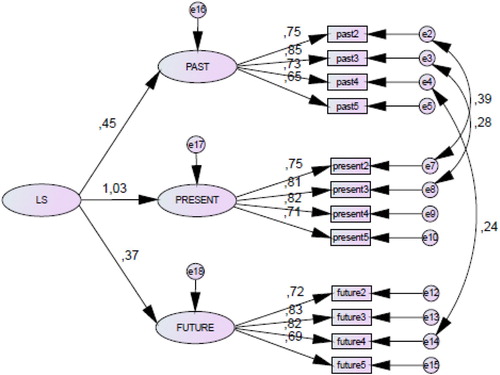
Structural equation model for the 12-item TSWLS. The first item in all three subscales has caused similar problems in McIntosh's, Shengquan Ye's study and as well as the present study we conducted [Citation20–21]. The 12-item TSWLS’s final model was shown in . The indices showed that this model was fit for TSWLS: χ² (48, n = 236) = 82.06, RMSEA = 0.055, CFI = 0.97, NFI = 0.94, TLI = 0.84, GFI = 0.95, and AGFI = 0.91.
Figure 3. Final standardized model for the 12-item TSWLS.
Note: Chi square = 82.064, df = 48, p = 0.002, RMSEA = 0.055.
Discussion
The purpose of this study was to adapt the TSWLS to Turkish and then measure the reliability and ensure validity of this constituted Turkish version of the scale on a large sample from different adult age groups and reflecting the Turkish population characteristics such as age and gender. Overall, the results showed that TSWLS in both 15-item and 12-item models were loaded in three factors and correlated to reflect their theoretical similarities. Except the 11th item, all items presented higher factor loadings (the lowest was 0.56) and corrected item-total correlations (the lowest was 0.49), as well as adequate levels of internal consistency (Cronbach’s alpha coefficient of past = 0.82; present = 0.88; future = 0.76; total = 0.87) across samples. These findings suggested that the temporal distinction (past, present, and future) in life satisfaction was also meaningful for this Turkish sample as it was for other samples.
The findings of the study supported the second prediction. First of all, 15-item and 12-item models supported the three-factor structure, but the findings showed that the first items were problematic for all the three subscales when we look at corrected inter-item correlation and factor loading. The other three items have been found to be more consistent within both the SWLS [Citation1,Citation17] and the TSWLS [Citation19]. The previous results also supported the results of our study.
Second, it was found that the items except 1st and 11th items were acceptable correlations with the general life satisfaction measure, suggesting that the 1st and 11th items were less valid in measuring life satisfaction [Citation20]. Factor loadings of the other items did not change much when we exclude the first item in all subscales (see and ), but since the first item is problematic, removing these items can help reducing measurement errors. Therefore, it is recommended to use only 12 items to measure the temporal life satisfaction of temporary life.
Third, analyses showed that the dimensions of the TSWLS did not show any statistical difference among the gender. There is no consensus in the literature on the distinction effect issue of gender across the life satisfaction level [Citation31,Citation32]. Interestingly, in our study, differences were found for means of factors indicating that single participants have a lower degree of past, present, and future levels of life satisfaction than married participants and the findings of similar researches in the literature, which have shown a positive association between having a marriage partner and being satisfied with life, were also supporting our results on the effects of marital status [Citation33,Citation34]. Furthermore, it is not surprising that differences were found for means of factors indicated that employed participants have a higher degree of life satisfaction than unemployed participations; however, on the temporal dimensions, only past life satisfaction subscore showed statistical difference among the employment of participants. The literature about the issue also showed that a person who is a self-employee has more satisfaction than a monthly paid employee [Citation35]; so the result of this study was consistent with the literature pointing out that being unemployed reduces people’s satisfaction of life [Citation36].
This study has some limitations. The most restrictive aspect of this work is that we cannot see whether the socio-economic situation affects life satisfaction, since participants have similar incomes. The relationship between the age and temporal life satisfaction is based on the cross-sectional studies, including different people of different ages. It may show the relationship between age and life satisfaction following more clearly for the same person over the years.
In conclusion, the present findings support the TSWLS as a valid and reliable measure of the temporal life satisfaction. Researchers may rely on the Turkish version of this scale to measure life satisfaction in Turkish samples. Future research should examine in more depth the association between aging and socio-economic impact of the level of life satisfaction by a follow-up designed study.
Disclosure statement
No potential conflict of interest was reported by the authors.
ORCID
Gokcen Akyurek http://orcid.org/0000-0002-0309-2321
References
- Pavot W, Diener E, Colvin CR, et al. Further validation of the satisfaction with life scale: evidence for the cross-method convergence of well being measures. J Pers Assess. 1991;57(1):149–161. doi: 10.1207/s15327752jpa5701_17
- World Health Organization, Health and Welfare Canada, Canadian Public Health Association. Ottowa charter for health promotion. Ottowa: Authors; 1986.
- Pavot W, Diener E. The affective and cognitive context of self-reported measures of subjective well-being. Soc Indic Res. 1993;28(1):1–20. doi: 10.1007/BF01086714
- Neugarten BL, Havighurst RJ, Tobin SS. The measurement of life satisfaction. J Gerontol. 1961;16:134–143. doi: 10.1093/geronj/16.2.134
- Lehman AF. The well-being of chronic mental patients. Arch Gen Psychiatry. 1983;40:369–373. doi: 10.1001/archpsyc.1983.01790040023003
- Kaprio J, Koskenvuo O, Langinvainio O, et al. Psychosocial factors and morbidity: hospitalization and mortality in the Finnish twin cohort. Based tabulations of a six-year follow-up of 31 116 Finnish adults. Public Health publication: 1987: M99. Helsinki: Department of Public Health, University of Helsinki, 1987.
- Larson R. Thirty years of research on the subjective well- being of older Americans. J Gerontol. 1978;33:109–125. doi: 10.1093/geronj/33.1.109
- Mosey JM, Shapiro E. Self-rated health: a prediction of mortality among the elderly. Am J Pub Health. 1982;72:800–808. doi: 10.2105/AJPH.72.8.800
- Hirdes JP, Forbes WF. Factors associated with the maintenance of good self-rated health. J Aging Health. 1993;5:101–122. doi: 10.1177/089826439300500105
- Cheung F, Lucas RE. Assessing the validity of single-item life satisfaction measures: results from three large samples. Qual Life Res. 2014;23(10):2809–2818. doi: 10.1007/s11136-014-0726-4
- Arrindell WA, Heesink J, Feij JA. The satisfaction with life scale (SWLS): appraisal with 1700 healthy young adults in the Netherlands. Pers Individ Dif. 1999;26:815–826. doi: 10.1016/S0191-8869(98)00180-9
- Pons D, Atienza FL, Balaguer I, et al. Satisfaction with life scale: analysis of factorial invariance for adolescents and elderly persons. Percept Mot Skills. 2000;91:62–68. doi: 10.2466/pms.2000.91.1.62
- Atienza FL, Balaguer I, Garcıa-Merita M. Satisfaction with life scale: analysis of factorial invariance across sexes. Pers Individ Diff. 2003;35:1255–1260. doi: 10.1016/S0191-8869(02)00332-X
- Lewis CA, Shevlin ME, Smekal V, et al. Factor structure and reliability of a Czech translation of the satisfaction with life scale among Czech university students. Stud Psychol (Bratisl). 1999;41:239–244.
- Blais MR, Vallerand RJ, Pelletier LG, et al. L’Echelle de satisfaction de vie: Validation Canadienne-Francaise du “‘Satisfaction with Life Scale”’ (French-Canadian Validation of the Satisfaction with Life Scale). Can J Behav Sci. 1989;21:210–223. doi: 10.1037/h0079854
- Neto F. The satisfaction with life scale: psychometrics properties in an adolescent sample. J Youth Adolesc. 1993;22:125–134. doi: 10.1007/BF01536648
- Sachs J. Validation of the satisfaction with life scale in a sample of Hong Kong university students. Psychologia: An Int J Psychol Orient. 2003;46:225–234. doi: 10.2117/psysoc.2003.225
- McDonald RP. Test theory: a unified treatment. Mahwah (NJ): Lawrence Erlbaum Associates; 1999.
- Pavot W, Diener E, Suh E. The temporal satisfaction with life scale. J Pers Assess. 1998;70:340–354. doi: 10.1207/s15327752jpa7002_11
- McIntosh CN. Report on the construct validity of the temporal satisfaction with life scale. Soc Indic Res. 2001;54:37–56. doi: 10.1023/A:1007264829700
- Ye S. Validation of temporal satisfaction with life scale in a sample of chine university students. Soc Indic Res. 2007;80:617–628. doi: 10.1007/s11205-006-0010-2
- Durak M, Durak ES, Gencoz T. Psychometric properties of the satisfaction with life scale among Turkish university students, correctional officers, and elderly adults. Soc Indic Res. 2010;99:413–429. doi: 10.1007/s11205-010-9589-4
- Jovanovic V. The validity of the satisfaction with life scale in adolescents and a comparison with single-item life satisfaction measures: a preliminary study. Qual Life Res. 2016;25(12):3173–3180. doi: 10.1007/s11136-016-1331-5
- Prasoon R, Chaturvedi KR. Life satisfaction: a literature review. Int J Manage Hum Soc Sci. 2016;1(2):25–32.
- Abdallah T. The satisfaction with life scale (SWLS): psychometric properties in an Arabic-speaking sample. Int J Adolesc Youth. 1998;7:113–119. doi: 10.1080/02673843.1998.9747816
- MacCallum RC, Widaman KF, Zhang SB, et al. Sample size in factor analysis. Psychol Methods. 1999;4 (1):84–99. doi: 10.1037/1082-989X.4.1.84
- Turkish Statistical Institute. Population and Housing census 2011.
- Beaton DE, Bombardier C, Guillemin F, et al. Guidelines for the process of cross-cultural adaptation of self-report measures. Spine. 2000;25(24):3186–3191. doi: 10.1097/00007632-200012150-00014
- Hu L, Bentler P. Cutoff criteria for fit indexes in covariance structure analysis: conventional criteria versus new alternatives. Struct Equ Modeling. 1999;6(1):1–55. doi: 10.1080/10705519909540118
- http://www.statisticshowto.com/kaiser-meyer-olkin/ date of access: 02.02.2018.
- Huebner ES. Initial development of the student’s life satisfaction scale. Sch Psychol Int. 1991;12:231–240. doi: 10.1177/0143034391123010
- Calasanti TM. Gender and life satisfaction in retirement: an assessment of the male model. J Gerontol: b. 1996;51b(1):s18–s29. doi: 10.1093/geronb/51B.1.S18
- Hong LK, Duff RW. Relative importance of spouses, children, and friends in the life satisfaction of retirement community residents. J Clin Geropsychol. 1997;3(4):275–282.
- Kehn DJ. Predictors of elderly happiness. Activ Adapt Aging. 1995;19(3):11–30.
- Hessels J, Arampatzi E, van der Zwan P, et al. Life satisfaction and self-employment in different types of occupations. Appl Econ Lett. 2018. doi: 10.1080/13504851.2017.1361003
- Aysan MF, Aysan U. The effect of employment status on life satisfaction in Europe. In: Bilgin MH, Danis H, Demir E, Can U, editors. Empirical Studies on Economic of Innovation, Public Economic and Management. Eurasian Studies in Business and Economics. Vol. 6. Cham: Springer; 2017. p. 335–347. doi:10.1007/978-3-319-50164-2_21